SYSTEMATIC OPTIMIZATION OF FORMULATION OF INCLUSION
COMPLEXES CONTAINING AN ANTI-DIABETIC DRUG
*1Nirmala P., 2Marina Koland and 3Narendra C.
1
Assistant Professor, Department of Pharmaceutics, Government College of Pharmacy,
Bengaluru, Karnataka, India. 2
Professor & Head of Department, Department of Pharmaceutics, NGSM Institute of
Pharmaceutical Sciences, Mangalore, Karnataka, India.
3
Assisstant Professor, Visveswarapura Institute of Pharmaceutical Sciences, Bengaluru,
Karnataka, India.
ABSTRACT
Glipizide (GZ), a BCS class II antidiabetic drug was formulated as
inclusion complexes using HPβ-CD by physical mixture and solvent
evaporation method. The effects of various excipients PEG 10000,
HPβCD, PVP k30 and PEG 6000 on the solubility of Glipizide were
investigated. The factorial design of experiment was applied to know
the interaction effect of the excipients on the solubility of GZ. FTIR,
DSC, H NMR, XRD, drug content and dissolution studies were
performed. PEG 6000 was found to enhance the solubility of the drug
only by 3.8 folds. The polynomial equation and experimented data
concluded that HPβCD alone was sufficient to enhance the solubility
of GZ. The formation of an inclusion complex of GZ with HPβCD was
confirmed by FTIR, DSC and H NMR studies. The XRD results supported the finding of
FTIR spectra and NMR spectras. The complex formed using solvent evaporation technique
entrapped 100 percent of the drug within the cavity of the HPβCD carrier molecule. The
inclusion complex shows a significant increase in the drug dissolution compared to physical
mixture and pure drug. It was concluded that HPβCD is most useful for enhancing the
solubility and thus drug release from its inclusion complex.
KEYWORDS: PEG 10000, HPβCD, PVP k30 and PEG 6000.
Volume 6, Issue 3, 916-936. Research Article ISSN 2277– 7105
*Corresponding Author
Nirmala P.
Assistant Professor,
Department of
Pharmaceutics, Government
College of Pharmacy,
Bengaluru, Karnataka, India. Article Received on
29 Dec. 2016,
Revised on 19 Jan. 2017, Accepted on 09 Feb. 2017
INTRODUCTION
Glipizide (GZ) is a second-generation sulfonylurea, hydrophobic which is poorly
water-soluble (BCS class II) antidiabetic drug for the treatment of patients with type II diabetes.[1],[2]
GZ acutely lowers the blood glucose level in humans by stimulating the release of insulin
from the pancreas and is typically prescribed to treat non-insulin-dependent diabetes mellitus.
The drug is insoluble in water, and its dissolution is considered to be a rate-determining step
(i.e., an effective factor) in its absorption from the gastrointestinal fluids.[3] This limits its
bioavailability and may be the reason for its delayed absorption.[4] Glipizide is reported to
have a short biological half-life (3.4±0.7 h) requiring it to be administered in 2 to 3 doses of
2.5 to 10 mg per day. A rapidly absorbed drug having faster elimination rate with short
half-life make it a suitable candidate to be formulated for the sustained delivery.[5],[6]
Cyclodextrins (CDs) form a group of structurally related oligosaccharides with
cylinder-shaped cavities that have the capacity to form inclusion complexes with many drugs by
taking a whole drug molecule, or a part of it, into the cavity.[7],[8] Because of the large number
of hydroxyl groups on CDs, they are water-soluble. They are known for their ability to
molecularly encapsulate a wide variety of drugs into their hydrophobic cavity without the
formation of any covalent bonds. CDs have widespread pharmaceutical applications mainly
because of their effect on enhancing the solubility and bioavailability of many drug
formulations. Complexation with cyclodextrins has been reported to enhance the solubility,
dissolution rate, and bioavailability of poorly water-soluble drugs.[9],[10],[11],[12]
Several methods have been proposed to obtain solid drug-CD complexes, both in liquid and
in solid medium, but there is still no general rule or universal method, probably because each
drug to be entrapped is a special case and optimal conditions depend on the characteristic of
both the host and guest molecules. Selection of the most suitable preparation method for a
given drug requires careful evaluation because apart from consideration of the performance
of the obtained product, such as the dissolution profile, other factors such as simplicity, low
cost, high yield, swiftness and ease of scale-up also play a major role in the choice of a
method.[13,14]
The objective of the present study was to prepare inclusion complexes of GZ with HPβ-CD
using various methods such as physical mixture and solvent evaporation to improve its
MATERIALS AND METHODS
Materials
Glipizide was a gift sample from Micro Labs, Bangalore. Polyethyleneglycol 10000
(PEG10000), polyethylene glycol 6000 (PEG 6000), polyvinylpyrrolidone K30 (PVP K30),
Ethyl Cellulose, Magnesium stearate, Span 80 and Tween 80 were purchased from SD Fine
Chem, India. Hydroxypropyl-β-cyclodextrin (HPβCD) was procured from M/s. Yarrow
Chem Products., Mumbai, India. All other chemicals and reagents used were of analytical
grade.
Methods
Preparation of standard calibration curve of glipizide
Preparation of standard solution: Primary stock solution: 100 mg of Glipizide was accurately
weighed and dissolved in sufficient amount of 0.1N NaOH taken in 100 ml volumetric flask,
finally the volume was made up to 100ml with the same. (1000 μg/ml). Secondary stock
solution: 10 ml of the above solution was pipette out into second 100ml volumetric flask;
volume was made up with 0.1N NaoH to get a concentration of 100μg/ml. Working standard
solution: Aliquots of 0.4ml, 0.8ml, 1.2 ml, 1.4ml, 1.6ml, 2.0ml, 2.4ml, 2.8ml, 3ml and 4ml
were pipette out from the working standard solution and transferred into 10 ml volumetric
flask. Then the volume was made up with distilled water to get a concentration which falls
within the Beer’s range 2 – 50μg/ml. The absorbance of these solutions was measured at 276
nm against reagent blank.
Phase Solubility Study
Phase solubility studies were carried out according to the method reported by Higuchi and
Connors.[15] An excess amount of Glipizide was added to 10ml aqueous solution containing
increasing concentrations of various excipients (0 – 10% w/v). The suspensions were
vigorously shaken at 25 + 10C for 72 hours in order to reach equilibrium. After equilibrium
was attained, the samples were filtered through a 0.45µm millipore membrane filter and
Glipizide concentration was determined by UV spectroscopy (Shimadzu UV - 18000) at
276nm. Each experiment was carried out in triplicate. The apparent 1:1 stability constant Ks
was calculated from the phase solubility diagrams using the equation:
) 1
(
0 slope
S
slope Ks
where the intercept corresponds to the intrinsic solubility (S0) of Glipizide at 250C. The
various excipients used were polyethyleneglycol 10000 (PEG10000), polyethylene glycol
6000 (PEG 6000), polyvinylpyrrolidone K30 (PVP K30) & hydroxypropyl-β-cyclodextrin
(HPβCD).
Design of experiment
A factorial design was adapted (Design expert version 6.05) to study the effect of 3
independent variables on the solubility of Glipizide.
Independent Variables
X1 = Amount of HPβCD (0 to 10%)
X2 = Amount of PVP K30 (0 to 10%)
X3 = Amount of PEG 6000 (0 to 10%)
Response Variable
Y1 = Glipizide solubility in water (mcg/ml)
Table 01. Design layout with response variable
Code Type X1 (%) X2 (%) X3 (%)
1 Fact 0.00 0.00 0.00
2 Fact 10.00 0.00 0.00
3 Fact 0.00 10.00 0.00
4 Fact 10.00 10.00 0.00
5 Fact 0.00 0.00 10.00
6 Fact 10.00 0.00 10.00
7 Fact 0.00 10.00 10.00
8 Fact 10.00 10.00 10.00
Method
Phase solubility studies were carried out by taking an excess amount of Glipizide, which was
added to 10ml aqueous solution containing concentrations of various excipients as mentioned
above. The suspensions were vigorously shaken at 25 + 10C for 72 hours in order to reach
equilibrium. After equilibrium was attained, the samples were filtered through a 0.45µm
millipore membrane filter and Glipizide concentration was determined by UV spectroscopy
Preparation of Inclusion complex
Physical mixture method: The 1:1 molar ratio of physical mixture of drug: HPβCD was taken
in a mortar and pestle and triturated for 30 minutes. The dry powder blend obtained was
passed through sieve number 80 and stored in a desicator until further use.
Solvent evaporation method: The solid inclusion of Glipizide was prepared in 1:1 molar ratio
by solvent evaporation method. Glipizide was dissolved in methanol and added to aqueous
mixture containing HPβCD and the suspension was stirred for 4hr at 600
C. The solvent was
then evaporated under vacuum at 400C with a rotary evaporator. The powder obtained was
passed through sieve number 80 and stored in a desicator until further use.
Characterization studies
Fourier-Transform Infrared (FTIR) Spectral studies
FTIR spectroscopy studies was carried out for pure Glipizide, inclusion complexes obtained
by physical mixture and solvent evaporation method by using Shimadzu FTIR -8400 by KBr
disc method using the scanning range from 500-4000 cm-1 and resolution of 4cm-1 and
compared with pure Glipizide.
DSC studies
The DSC of pure Glipizide, inclusion complexes obtained by physical mixture and solvent
evaporation method was carried out by using DSC apparatus Metler Toledo STAR SW model
with a scan range from 30 to 300°C with a ramp (heating rate) of 10°C per minute. The
sample holder was Standard 40µl Aluminium crucible (pin holed). About 3 to 6 mg of sample
powder was taken into a standard aluminium crucible and crimped with a cap. Crucible was
pin holed before putting into analysis. Data was collected from 30°C to 300°C with ramp of
10°C per minute. The position and intensities of thermograms were considered for the
identification and comparison of drug or complex.
1
H NMR studies
The pure drug and inclusion complex were subjected to 1H NMR studies spectroscopic
experiments (Varian) at 500MHz with dual full band channels and Z axis gradients. The
spectra obtained were measured at 298 K with an operating frequency of 499.742 MHz. The
900C pulse width for 1H was 10.8 at a transmitter power of 50. Solutions were purged prior
to data collection under a stream of argon for 1hr to reduce the amount of dissolved oxygen.
XRD studies
The X-ray diffractograms for the pure drug and the inclusion complex were obtained using on
X-ray diffraction instrument (Bruker D8 Advance Powder XRD) with Ni-filtered, Cu
radiation as anode target at 1.5406A0 at a voltage of 40 kV and current of 30 mA. The scan
was performed in the range of 30 2Ɵ to 450 2Ɵ with 15 sec as time per step and step size is
0.010 2Ɵ.
Estimation of drug content
The inclusion complexes prepared by physical mixture and solvent evaporation were
analyzed for the drug content. Mixtures containing 10mg equivalent of the drug were
dissolved in 100ml of 0.1N NaOH and suitably diluted and absorbance was measured at
276nm using UV spectroscopy (Shimadzu UV- 18000). The drug content experiment was
performed in triplicate.
Dissolution studies
The dissolution behaviour of the complex was compared with that of pure glipizide and
physical mixture containing quantities of formulation equivalent to 10mg of Glipizide. The
dissolution studies were carried out according to USP XXIII apparatus 2 (rotating paddle
method -model TDT-08L, M/s.Electrolab). Distilled water was used as the dissolution
medium, which was maintained at 370C+0.50C and stirred at 50rpm. Powdered samples
containing 10mg of Glipizide or its equivalent in complex or physically mixed with HPβCD
were used in a capsule. At appropriate time intervals, 5ml samples were withdrawn and
filtered rapidly through 0.8µm membrane filter. The concentration of Glipizide was
determined by UV spectroscopy at 276nm. Similar experiments were repeated without using
capsule as a dosage form. All experiments were performed in triplicate.
RESULTS AND DISCUSSION
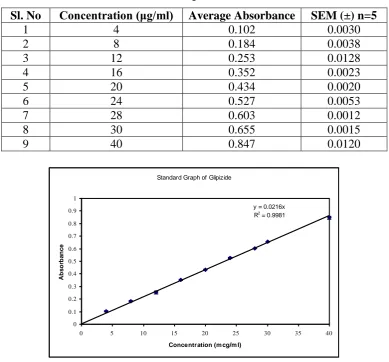
Preparation of standard calibration curve of glipizide: The linear regression was done on
absorbance data points. The results are presented as follows. For standard curve of Glipizide:
The slope = 0.0216 and the correlation coefficient = 0.9981. A straight-line equation (Y = mx
+ c) was generated to facilitate the calculation of amount of drug. The equation is Absorbance
Table No. 1: Data for Standard curve of Glipizide in 0.1N NaoH
Sl. No Concentration (μg/ml) Average Absorbance SEM (±) n=5
1 4 0.102 0.0030
2 8 0.184 0.0038
3 12 0.253 0.0128
4 16 0.352 0.0023
5 20 0.434 0.0020
6 24 0.527 0.0053
7 28 0.603 0.0012
8 30 0.655 0.0015
9 40 0.847 0.0120
Standard Graph of Glipizide
y = 0.0216x R2
= 0.9981
0 0.1 0.2 0.3 0.4 0.5 0.6 0.7 0.8 0.9 1
0 5 10 15 20 25 30 35 40
Concentration (m cg/m l)
A
b
s
o
rb
a
n
c
e
Fig. 1. Standard Calibration curve of Glipizide in 0.1NNaOH
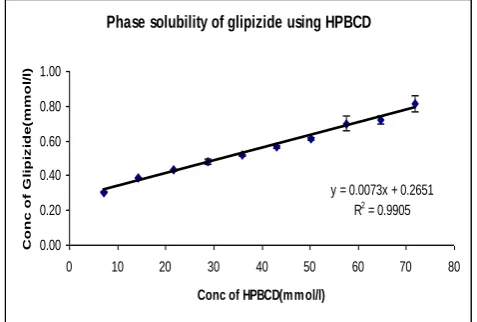
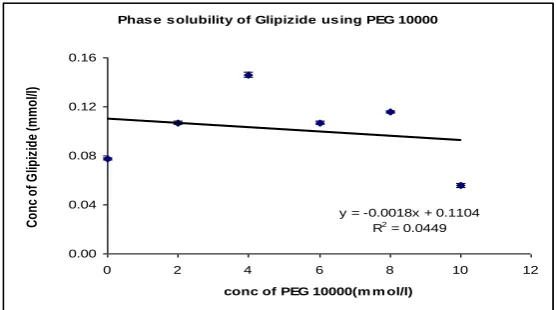
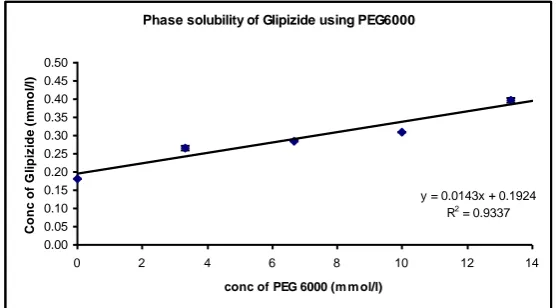
Phase solubility studies
The effects of various excipients PEG 10000, HPβCD, PVP k30 and PEG 6000 on the solubility of Glipizide were investigated. Figure no’s 01, 02, 03 and 04 shows the solubility
profile of Glipizide with various excipients at different concentrations. From the solubility
profile it was observed that the solubility of Glipizide increases linearly as the concentration
of HPβCD and PVP k30 was increased. It was found that the phase solubility diagram of the
HPßCD and PVP k30 solution showed a typical AL-type, suggesting the formation of a
soluble complex of 1: 1 molar ratio. PVP k30 showed a fourfold increase in solubility
whereas HPβCD exhibited a 9.5 fold increase. In case of PEG 10000 the graph exhibited a
nonlinear increase in solubility of Glipizide. Hence PEG 10000 was not considered for
further studies. PEG 6000 enhanced the solubility of the drug only by 3.8 folds (Table No. 2
Table No. 02: Phase solubility study of Glipizide using HPβCD
Conc of HPβCD Conc of HPβCD Average Absorbance* Average Conc of Glipizide SEM (±)
0 0 0.111 0.144 0.0032
1 7.18 0.215 0.305 0.0026
2 14.36 0.315 0.389 0.002
3 21.54 0.334 0.433 0.0032
4 28.72 0.387 0.48 0.0154
5 35.89 0.399 0.517 0.0054
6 43.07 0.434 0.568 0.0088
7 50.25 0.459 0.615 0.0085
8 57.43 0.546 0.7 0.0405
9 64.61 0.551 0.72 0.023
10 71.79 0.641 0.811 0.0047
*Average absorbance of three trials (n=3).
Phase solubility of glipizide using HPBCD
y = 0.0073x + 0.2651
R2 = 0.9905
0.00 0.20 0.40 0.60 0.80 1.00
0 10 20 30 40 50 60 70 80
Conc of HPBCD(mmol/l)
C
o
n
c
o
f
G
li
p
iz
id
e
(
m
m
o
l/
[image:8.595.178.417.303.464.2]l)
Fig. 2. Phase solubility of Glipizide using HPβCD
Table No. 3: Phase solubility study of Glipizide using PEG10000
Conc of PEG10000 Conc of PEG10000 Average Absorbance* Average Conc of Glipizide SEM (±)
(%w/v) (mmol/liter) (mmol/liter) (n = 3)
0 0 0.06 0.078 0.0008
2 2 0.083 0.107 0.0012
4 4 0.113 0.146 0.002
6 6 0.083 0.107 0.0012
8 8 0.089 0.115 0.0008
10 10 0.043 0.056 0.0016
[image:8.595.14.591.529.652.2]Phas e s olubility of Glipizide us ing PEG 10000
y = -0.0018x + 0.1104 R2 = 0.0449
0.00 0.04 0.08 0.12 0.16
0 2 4 6 8 10 12
conc of PEG 10000(m m ol/l)
[image:9.595.158.437.73.228.2]C o n c o f G lip iz id e (m m o l/l )
[image:9.595.168.429.448.566.2]Fig. 3. Phase solubility of Glipizide using PEG10000
Table No. 4: Phase solubility study of Glipizide using PVPk30
Conc of PVP k30 Conc of PVP k30 Average Absorbance* Average Conc of Glipizide SEM (±)
(%w/v) (mmol/liter) (mmol/liter) (n = 3)
0 0 0.091 0.118 0.0057
2 0.4 0.186 0.241 0.0037
4 0.8 0.218 0.283 0.0016
6 1.2 0.24 0.311 0.0012
8 1.6 0.263 0.341 0.0049
10 2 0.282 0.365 0.0029
*Average absorbance of three trials (n=3).
Phas e s olubility of Gllipizide us ing PVPk 30
y = 0.0769x + 0.2159 R2 = 0.9898
0.00 0.05 0.10 0.15 0.20 0.25 0.30 0.35 0.40
0.00 0.50 1.00 1.50 2.00 2.50
conc of PVP k 30(m m ol/l)
C on c of G lip iz id e( m m ol /l)
Fig. 4. Phase solubility of Glipizide using PVP k30
Table No. 5: Phase solubility study of Glipizide using PEG 6000
Conc of PEG 6000 Conc of PEG 6000 Average Absorbance* Average Conc of Glipizide SEM (±)
(%w/v) (mmol/liter) (mmol/liter) (n = 3)
0 0 0.14 0.182 0.0008
2 3.33 0.204 0.265 0.0065
4 6.67 0.22 0.285 0.0008
6 10 0.239 0.309 0.0012
8 13.33 0.307 0.398 0.0069
10 16.67 0.241 0.312 0.0037
[image:9.595.11.591.632.751.2]Phase solubility of Glipizide using PEG6000
y = 0.0143x + 0.1924 R2 = 0.9337
0.00 0.05 0.10 0.15 0.20 0.25 0.30 0.35 0.40 0.45 0.50
0 2 4 6 8 10 12 14
conc of PEG 6000 (m m ol/l)
C
o
n
c
o
f
G
li
p
iz
id
e
(
m
m
o
l/
[image:10.595.158.437.74.228.2]l)
Fig. 5. Phase solubility of Glipizide using PEG 6000
Design of Experiment
The factorial design of experiment was applied to know the interaction effect of the
excipients on the solubility of Glipizide. ANOVA report reveals that the combination of the
excipients influenced the solubility of the drug.
Response Y1: 229.08 + 106.50 X1 - 40.81 X1X2 -15.57 X1X3 -24.83 X2X3 + 8.12 X1X2X3
Based on the polynomial equation and the one factor plot (figure 05 & 05a) indicate that
HPβCD alone was most significant among all the excipients used to achieve a maximum
solubility.
The interaction effect between factor X1 & X2 can be studied with the help of figure no’s 06
& 06a. In absence or presence of PEG 6000, increase in concentration of PVP k30 with
HPβCD does not significantly increase the solubility of the drug.
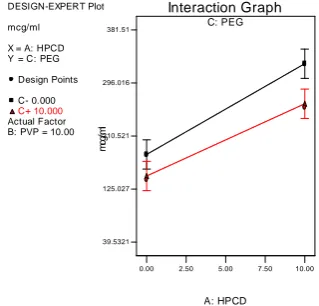
Figure no.07 & 07a indicates the interaction effect of X1 & X3 in absence and presence of
PVP k30. In absence of PVP and keeping HPβCD at high level, increasing the concentration
of PEG 6000 from 0-10% decreased the solubility from 381.51 to 378.47mcg/ml.
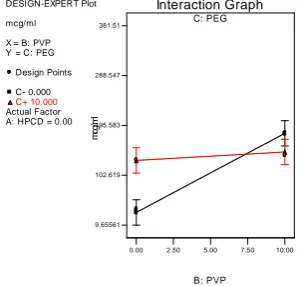
In presence and absence of HPβCD, the interaction effect between X2 & X3 can be studied with the help of figure 8 & 8a. In absence of HPβCD, increase in concentration of PVP k30
with or without PEG 6000 enhances the solubility to a very minimal extent. But this effect
was found to be opposite in presence of HPβCD.
Therefore, it was necessary to apply a multicriteria decision approach, like desirability
maximize solubility of the drug. Each response was associated with its own partial
desirability function, which varied from 0 to 10, according to the closeness of the response to
its target value. Based on the optimization studies, it was identified that presence of 10% of
HPβCD and 9.3% of PEG was found to be optimal combination to enhance the solubility of
Glipizide.
To validate the obtained solution further experiment was conducted and solubility was found
to be 373 ± 3.58 mcg/ml, which was lesser as compared to the solubility exhibited by HPβCD
10% alone. Hence based on the polynomial equation & experimented data, it was concluded
that HPβCD alone will be sufficient to enhance the solubility of Glipizide (Table No. 6 to 8
[image:11.595.178.419.326.471.2]and Fig. 6 to 13).
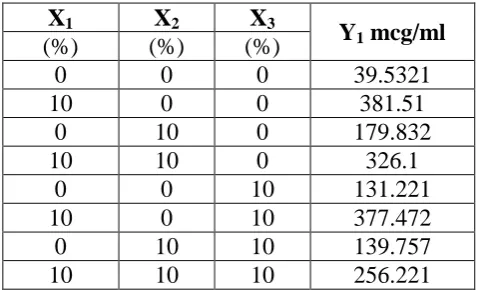
Table No. 6: Design of experiment
X1 X2 X3
Y1 mcg/ml
(%) (%) (%)
0 0 0 39.5321
10 0 0 381.51
0 10 0 179.832
10 10 0 326.1
0 0 10 131.221
10 0 10 377.472
0 10 10 139.757
10 10 10 256.221
Table No. 7: ANOVA for 3 factor interaction model
Source Sum of DF Mean F
Squares Square Value
Model 111451 5 22290.13 277.594
X1 90729.7 1 90729.68 1129.921
X1X2 13325.1 1 13325.12 165.947
X1X3 1938.48 1 1938.478 24.141
X2X3 4930.47 1 4930.467 61.402
X1X2X3 526.889 1 526.889 6.561
Residual 160.594 2 80.297
Cor Total 111611 7
* p< 0.05 significant.
Table No. 8: Statistical parameters
Std. Dev. 8.96 R-Squared 0.9985
Mean 229.08 Adj R-Squared 0.9949
C.V. 3.91 Pred R-Squared 0.9769
Response Y1: 229.08 + 106.50 X1 - 40.81 X1X2 -15.57 X1X3 -24.83 X2X3 + 8.12 X1X2X3
DESIGN-EXPERT Plot mcg/ml
X = A: HPCD
Design Points
Actual Factors B: PVP = 0.00 C: PEG = 0.00
0.00 2.50 5.00 7.50 10.00
9.65561 106.955 204.255 301.555 398.855 A: HPCD m cg /m l
One Factor Plot
Warning! Factor inv olv ed in an interaction.
DESIGN-EXPERT Plot mcg/ml
X = A: HPCD
Design Points
Actual Factors B: PVP = 10.00 C: PEG = 10.00
0.00 2.50 5.00 7.50 10.00
39.5321 125.027 210.521 296.016 381.51 A: HPCD m cg /m l
One Factor Plot
[image:12.595.97.256.114.266.2]Warning! Factor inv olv ed in an interaction.
Fig. 6. Effect of factor X1 on response Fig. 7. Effect of factor X1 on response
Y1 at low level of factor X2 and X3 Y1 at high level of factor X2 and
DESIGN-EXPERT Plot mcg/ml X = A: HPCD Y = B: PVP
Design Points B- 0.000
B+ 10.000
Actual Factor C: PEG = 0.00
B: PVP Interaction Graph A: HPCD m cg /m l
0.00 2.50 5.00 7.50 10.00
9.65561 106.955 204.255 301.555 398.855 DESIGN-EXPERT Plot mcg/ml X = A: HPCD Y = B: PVP
Design Points B- 0.000
B+ 10.000
Actual Factor C: PEG = 10.00
B: PVP Interaction Graph A: HPCD m cg /m l
0.00 2.50 5.00 7.50 10.00
[image:12.595.331.489.114.267.2]39.5321 129.935 220.337 310.74 401.142
Fig.8. Effect of Interaction factor X1X2 Fig.9. Effect of Interaction factor X1X2
on responseY1 at low level of factor X3 on responseY1 at high level of factor X3
DESIGN-EXPERT Plot mcg/ml X = A: HPCD Y = C: PEG
Design Points C- 0.000
C+ 10.000
Actual Factor B: PVP = 0.00
C: PEG Interaction Graph A: HPCD m cg /m l
0.00 2.50 5.00 7.50 10.00
9.65561 107.527 205.399 303.271 401.142 DESIGN-EXPERT Plot mcg/ml X = A: HPCD Y = C: PEG
Design Points C- 0.000
C+ 10.000
Actual Factor B: PVP = 10.00
C: PEG Interaction Graph A: HPCD m cg /m l
0.00 2.50 5.00 7.50 10.00
[image:12.595.89.249.341.501.2]39.5321 125.027 210.521 296.016 381.51
[image:12.595.341.497.347.499.2] [image:12.595.342.502.580.733.2]on responseY1 at low level of factor X2 on responseY1 at high level of factor X2
DESIGN-EXPERT Plot mcg/ml X = B: PVP Y = C: PEG
Design Points C- 0.000 C+ 10.000 Actual Factor A: HPCD = 0.00
C: PEG Interaction Graph B: PVP m cg /m l
0.00 2.50 5.00 7.50 10.00 9.65561 102.619 195.583 288.547 381.51 DESIGN-EXPERT Plot mcg/ml
X = B: PVP Y = C: PEG
Design Points
C- 0.000
C+ 10.000
Actual Factor A: HPCD = 10.00
C: PEG Interaction Graph B: PVP m cg /m l
0.00 2.50 5.00 7.50 10.00 39.5321
[image:13.595.97.248.116.259.2]129.935 220.337 310.74 401.142
Fig. 12. Effect of Interaction factor X2X3 Fig. 13. Effect of Interaction factor
X2X3 on responseY1 at low level of factor X1 on responseY1 at high level of factor X1
[image:13.595.360.490.133.258.2]Development of optimized formulae by using desirability function
Table No. 9: Constrain table
Independent variable Goal Lower Upper
Limit Limit
X1 is in range 0 10
X2 is in range 0 10
X3 is in range 0 10
Y1 mcg/ml is in range 377.47 381.51
Table No. 10: Predicted solution
Independent variables Response variable
Desirability
X1 X2 X3 mcg/ml
10 0 9.3 377.33 1
Table No. 11: Experimented data
Independent variables Response variable
X1 X2 X3 mcg/ml
10 0 9.3 373 ± 3.58
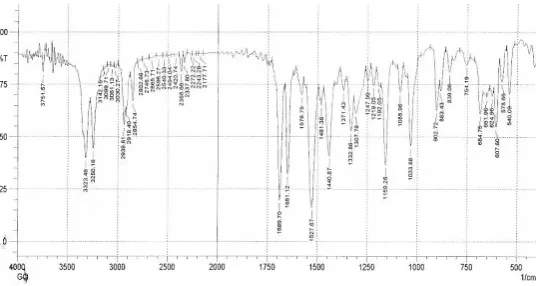
FTIR Spectral studies
The FTIR spectra of the inclusion complex, physical mixture, together with the pure drug are
shown in Figure no. 09, 10 & 11 for comparison. Principal peaks of Glipizide were found at
3030, 1528, 1690, 1650, 1159, 1032, 900 cm−1. As can be clearly seen from the spectra, the
characteristic bands of Glipizide at 1528, 1690 and 1159 cm−1 were modified significantly in
the physical mixture and inclusion complexes as a result of complex formation[16]. The C-H
[image:13.595.69.476.337.633.2]completely absent in the complex. The C = O, C = C absorption band at 1689cm-1 shows a
significant change in the complex when compared with pure drug. This indicates the
[image:14.595.164.436.146.289.2]formation of an inclusion complex (Fig .14 to 16).
[image:14.595.176.423.326.491.2]Fig. 14. FTIR of pure Glipizide
Fig.15. FTIR of Physical mixture containing Glipizide and HPβCD
[image:14.595.163.435.535.700.2]DSC studies
Differential Scanning Calorimetry enables the quantitative detection of all processes in which
energy is required or produced (i.e. endothermic and exothermic phase transformations). The
DSC thermogram of Glipizide is shown in Fig. 17 to 19. A single endothermic peak
corresponding to its melting point was observed at 214.280C. The onset of melting point was
observed at 210.44ºC. The DSC thermogram of Glipizide/HPβCD physical mixture shows a
broad peak at 47.310 representing the HPβCD melting and an endothermic peak of glipizide
at 2050C with less intensity than that of the pure drug, which may be a result of decrease in
crystallinity from physical mixing. The latter peak disappears completely in a complex state,
thereby confirming the formation of a inclusion complex with HPßCD.
Fig.17. DSC of pure Glipizide
Fig. 19. DSC of Inclusion complex of (1:1) Glipizide with HPβCD
1
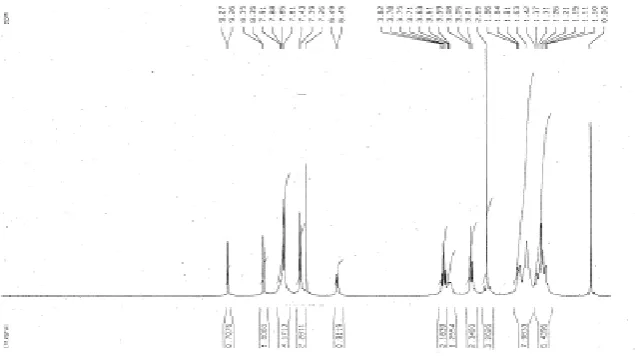
H NMR studies
1
H NMR studies of Glipizide and the inclusion complex are presented in figure no.15 & 16
for comparison. A singlet (2H) at δ 8.35 corresponds to heterocyclic hydrogens, a singlet (2H) at δ 9.26-9.27 for CONH, appearance of a multiplet (5H) at δ 7.26 -7.91 corresponds to
aromatic ring hydrogen & heterocyclic hydrogen. A doublet (1H) corresponds to SO2NH is
present at δ 6.45-6.49. Methyl (3H) is present at δ 2.65 as a singlet. δ 3.01 –3.82 represent the ethylene group (triplet) and δ 1.1-1.86 represents 10H of cyclohexane. The inclusion
complex possesses the SO2NH and CONH groups. However the intensity of the aliphatic
hydrogen is significantly reduced as observed from δ 3.5-3.8. The aromatic groups have
completely disappeared. Thus, the formation of an inclusion complex of Glipizide with
HPβCD is confirmed (Fig. 20 to 21).
[image:16.595.144.462.519.700.2]Fig.21. 1HNMR of Inclusion complex (1:1) Glipizide with HPBCD
XRD studies
The diffractogram of pure drug reveals its highly crystalline nature, as indicated by the
numerous distinctive peaks. The peak position (angle of diffraction) is an indication of crystal
structure in which, peak height is the measure of sample crystallinity. A lack of numerous
intense peaks signifies that the drug is distributed homogenously in an amorphous state
within the inclusion complex without any interaction. The complete crystallinity of the drug
[image:17.595.159.449.396.744.2]is lost. This result supports the finding of FTIR spectra and NMR spectras (Fig. 22 to 23).
Fig. 22. XRD of Pure Glipizide
[image:17.595.178.438.428.556.2]Analysis of drug content
The drug content analysis from the inclusion complex analysed is shown in table 11. Using
solvent evaporation technique for the complex formation 100 percent of the drug was
entrapped within the cavity of the HPβCD carrier molecule. The driving force for the
complex formation may be release of enthalpy rich water molecules from the cavity,
hydrogen bonding, Vanderwaal’s interaction, charge transfer interaction etc.
Dissolution studies
The dissolution studies of the pure drug along with the physical mixture and complex using
capsule as a dosage form are shown in figure 19. The inclusion complex shows a significant
increase in the drug dissolution compared to physical mixture and pure drug. It means that
HPβCD is most useful for enhancing the solubility and thus drug release from its inclusion
complex. Similar studies were repeated without using capsule as a dosage form. This was to
understand the effect of capsule on the dissolution rate. Results reveal that there was a slight
delay in the release of the drug, which may be due to delay in erosion of the capsule (Table
[image:18.595.111.475.425.595.2]No. 12 to 13 and Fig. 24 to 25).
Table No. 12: Dissolution studies using capsule as dosage form
Time % Drug release
Minutes F1 F2 F3
2.5 5.10 ± 0.35 4.55 ± 0.37 11.25 ± 0.28
5.0 6.65 ± 0.477 7.61 ± 0.43 15.82 ± 0.20
10 8.29 ± 0.58 9.36 ± 0.62 31.48 ± 2.11
15 11.32 ± 0.65 16.61 ± 0.64 56.31 ± 1.78
20 13.73 ± 0.56 25.45 ± 0.81 93.46 ± 3.69
30 15.70 ± 0.55 44.53 ± 0.57 104.29 ± 2.08
45 18.45 ± 0.58 78.96 ± 0.68 ---
60 21.41 ± 0.53 91.27 ± 0.67 ---
90 23.32 ± 0.60 97.00 ± 1.01 ---
*n=3 F1= pure drug, F2 = Physical mixture containing 1:1 molar ratio of drug and
HPßCD, F3 = Inclusion complex
Dissolution studies
0 20 40 60 80 100 120
0 20 40 60 80 100
Time (mins)
%
drug
r
el
ea
se
F1 F2 F3
[image:18.595.169.425.632.740.2]Table No. 13: Dissolution studies without using capsule as dosage form
Time % Drug release
Minutes F1 F2 F3
2.5 10.57 ± 1.54 12.77 ± 0.58 69.46 ± 0.76
5.0 12.43 ± 2.47 30.87 ± 1.33 75.72 ± 0.44
10 15.80 ± 1.86 39.69 ± 1.12 80.68 ± 0.53
15 21.37 ± 0.50 53.45 ± 0.85 85.61 ± 0.59
20 23.44 ± 0.20 78.26 ± 1.69 89.97 ± 0.26
30 25.74 ± 0.99 94.91 ± 0.96 100.70 ± 0.62
45 31.49 ± 2.68 97.38 ± 0.70 - - -
60 33.21 ± 2.87 103.37 ± 1.68 - - -
90 37.44 ± 1.86 - - -
*n=3
F1= pure drug, F2 = Physical mixture containing 1:1 molar ratio of drug and HPßCD
F3 = Inclusion complex
Dissolution studies
0 20 40 60 80 100 120
0 20 40 60 80 100
Tim e (m ins)
%
C
D
R F1
[image:19.595.168.427.329.496.2]F2 F3
Fig. 25. Dissolution studies without using capsule as dosage form
CONCLUSION
The inclusion complexes of GZ with HPβ-CD using various methods such as physical
mixture and solvent evaporation were prepared.
The phase solubility diagram of the HPßCD and PVP k30 solution showed a typical AL-type,
suggesting the formation of a soluble complex of 1: 1 molar ratio. PVP k30 showed a four
fold increase in solubility whereas HPβCD exhibited a 9.5 fold increase. In case of PEG
10000 the graph exhibited a nonlinear increase in solubility of Glipizide. Hence PEG 10000
was not considered for further studies. PEG 6000 enhanced the solubility of the drug only by
3.8 folds. The factorial design of experiment was applied to know the interaction effect of the
excipients influenced the solubility of the drug. Using solvent evaporation technique for the
complex formation 100 percent of the drug was entrapped within the cavity of the HPβCD
carrier molecule. The inclusion complex showed a significant increase in the drug dissolution
compared to physical mixture and pure drug. It meant that HPβCD was most useful for
enhancing the solubility and thus drug release from its inclusion complex.
ACKNOWLEDGEMENT
I extend my sincere gratitude to Government college of Pharmacy, Bengaluru for providing
the required facilities to carry out my work. I also acknowledge Microlabs, Bengaluru for
providing the gift sample for the work.
Conflict of interest
None.
REFERENCE
1. Serajuddin AT. Solid dispersion of poorly water soluble drugs: Early promises,
subsequent problems and recent breakthrough. J Pharm Sci, 1999; 88: 1058-66.
2. Lobenberg R, Amidon GL. Modern bioavailability bioequivalence and biopharmaceutics
classification system: New scientific approaches to international regulatory standards. Eur
J Pharm Biopharm, 2000; 50: 3-12.
3. Dollery SC. Therapeutic drugs. London: Churchill Livingstone, 1991.
4. Parfitt K. Martindale, the complete drug reference. London: Pharmaceutical Press, 1999.
5. Jamzad S, Fassihi R. Development of controlled release low dose class II drug-glipizide.
Int J Pharm, 2006; 312: 24-32.
6. Sweetman SC. Martindale the complete drug reference. 33rd ed. London: Pharmaceutical
press, 2002.
7. Pitha J, Milecki J, Fales H, Pannell L, Uekama K. Hydroxypropyl-β-cyclodextrin:
preparation and characterization; effects on solubility of drugs. Int J Pharm. 1986; 29: 73–
82.
8. Duchêne D. Cyclodextrins and their industrial uses. Editions de Santé Paris, 1987; SS.
447–460.
9. Baboota S, Agarwal SP. Rofecoxib complexation with β-cyclodextrin: influence on the
10.Fernandes CM, Teresa VM, Veiga FJ. Physicochemical characterization and in
vitro dissolution behavior of nicardipine-cyclodextrins inclusion compounds. Eur J Pharm
Sci. 2002; 15: 79–88.
11.Kamada M, Hirayama F, Udo K, Yano H, Arima H, Uekama K. Cyclodextrin
conjugate-based controlled release system: repeated- and prolonged-releases of ketoprofen after oral
administration in rats. J Control Release. 2002; 82: 407–416.
12.Mukne AP, Nagarsenker MS. Triamterene-β-cyclodextrin systems: preparation,
characterization and in- vivo evaluation. AAPS PharmSci Tech. 2004; 5(1): E19.
13.Winters CS, York P, Timmins P. Solid state examination of a glipizide-β- cyclodextrin
complex. Eur J Pharm Sci1997; 5: 209-15.
14.Al-Marzouqi AH, Shehatta I, Jobe B, Dowaidar A. Phase solubility and inclusion
complex of itraconazole with beta-cyclodextrin using supercritical carbon dioxide. J
Pharm Sci. 2006; 95(2): 292-304.
15.Higuchi T, Connors KA. Phase solubility techniques. Adv Anal Chem Instrum 1965; 4:
117- 212.
16.Kapil K, Manisha G, Pankaj N, Singh RP, Jain DA. Solubility enhancement of rifapentine