www.wjpr.net Vol 3, Issue 6, 2014. 1628
FORMULATION AND IN VITRO EVALUATION OF FAST
DISSOLVING TABLETS OF OLMESARTANMEDOXOMIL
Sheik Muddasar*, Dasari Prasad, Dr. Yasmeen, Dr.Sudhakar
Department of Pharmaceutics,Malla Reddy College of Pharmacy, Maisammaguda,
Dhoolapally, Rangareddy.
ABSTRACT
The objective of this research was to formulate fast dissolving tablets
of Olmesartan medoxomil (Antihypertensive drug) for rapid action.
Demand for fast dissolving tablets has been growing especially for
elderly and children who are swallowing difficulties. The problem of
certain fast dissolving tablets is their low physical resistance and high
friability. In this investigation fast dissolving tablets are prepared by
using 3 different super disinitegrants Crospovidone, Croscarmellose
sodium, Sodium starch glycolate in 4%, 5% by 6% by direct
compression technique. Prepared tablets were evaluated for pre and
post compression parameters. All the formulations were evaluated for
influence of disintegrates and their concentrations on the
characteristics mainly on disintegration time and dissolution studies. Crospovidone in
higher concentration showed, rapid disintegration, wetting and in vitro drug release as
compared to other formulations.
KEY WORDS: Olmesartan medoxomil, Fast dissolving tablets, Direct Compression method.
INTRODUCTION
For the drugs which are intended to produce therapeutic effect in systemic circulation, the oral
route of drug delivery is preferred. These include traditional and conventional dosage forms
of tablets. Tablets are most widely used dosage forms because of their convenience in term of
self-administration. However geriatric, pediatric, bedridden, mentally disabled who may face
difficulty in swallowing conventional tablets and also those having persistent nausea
sudden episodes of allergic attacks or coughing leads to ineffectiveness of therapy.It
Volume 3, Issue 6, 1628-1639. Research Article ISSN 2277 – 7105
Article Received on 22 June 2014,
Revised on 17 July 2014, Accepted on 12 August 2014
*Correspondence for
Author
Dasari Prasad
Department of Pharmaceutics
,Malla Reddy College of
Pharmacy, Maisammaguda,
www.wjpr.net Vol 3, Issue 6, 2014. 1629 is estimated that 50% of population is affected by this problem.[1] To overcome this weakness pharmaceutical technologist have designed innovative drug delivery system
known as oral disintegratingtablets (ODTs). Rapid disintegrating tablets are those solid
dosage forms when put on tongue disintegrates or dissolve instantaneously releasing the
drug within few seconds without the need of water. When this type of tablet is placed in
mouth the saliva will serve to rapid disintegration of the tablet.[4] However the proper choice of disintegrant and its consistency of performance are of critical importance inthe
formulation development of such tablets.[3]
Oral disintegrating tablets were prepared by various techniques.Direct compression is one of
the techniques which requires the incorporation of a superdisintegrant into the formulation to
achieve fast tablet disintegration and hence dissolution. Hence the present study was carried
out to enhance the solubility and oral bioavailability of olmesartan medoxomil by the
formulation of oral disintegrating tablet using various superdisintegrants.[4]
In the present studyCrospovidone, Croscarmellose sodium and Sodium starch glycolatewere
used as superdisintegrants. Olmesartan medoxomilis an anti-hypertensive agent used in the
treatment of high blood pressure. Olmesartanacts by blocking the binding of angiotensinII to
the AT1 receptors in vascular muscle.Olmesartan is selective for AT1 and has12,500 times greater affinity for AT1 than the AT2 receptor. Olmesartanmedoxomil is an inactive ester
prodrug that is completely hydrolysed to the active form, olmesartan during absorption from
the gastrointestinal tract. The absolute bioavailability of olmesartan is approximately 26%.
After oral administration, the peak plasma concentration (Cmax) of olmesartan is reached after 1 to 2 hours. Food does not affect the bioavailability of olmesartan.[5] The aim of the present study is to develop orally disintegrating tablets ofOlmesartan medoxomilto achieve
rapid disintegration, dissolution/absorption and further improving the bioavailability of the
drug. Also, to resolve the swallowing problems in paediatric, geriatric patients by rapid
disintegration in saliva and improve the patient compliance.
MATERIALS AND METHODS Material
Olmesartan medoxomil, crospovidone (CP), croscarmellosesodium(CCS), sodium starch
glycolate (SSG), microcrystalline cellulose, lactose monohydrate, aspartame, talc and sodium
www.wjpr.net Vol 3, Issue 6, 2014. 1630 Method
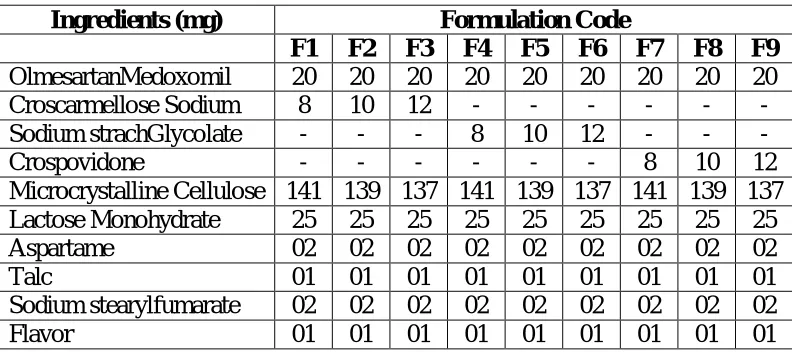
Table 1: Composition of Nine different formulations of Olmesartan medoxomil ODTs
Ingredients (mg) Formulation Code
F1 F2 F3 F4 F5 F6 F7 F8 F9 OlmesartanMedoxomil 20 20 20 20 20 20 20 20 20 Croscarmellose Sodium 8 10 12 - - - - Sodium strachGlycolate - - - 8 10 12 - - -
Crospovidone - - - 8 10 12
Microcrystalline Cellulose 141 139 137 141 139 137 141 139 137 Lactose Monohydrate 25 25 25 25 25 25 25 25 25 Aspartame 02 02 02 02 02 02 02 02 02
Talc 01 01 01 01 01 01 01 01 01
Sodium stearylfumarate 02 02 02 02 02 02 02 02 02
Flavor 01 01 01 01 01 01 01 01 01
Preparation of Oral disintegrating tablets
Oral disintegrating tablets containing 20mg of olmesartan medoxomil were prepared by
direct compression technique. Compositions of the different formulations are shown in Table
1. All the ingredients except sodium stearylfumarateand talc were mixed uniformly, and
passed through sieve #60. Then sodium stearylfumarate and talc were added and various
pre-compression parameters like Bulk density, Tapped density, Hausner’s ratio, Carr’s Index and
Angle of repose were evaluated. After evaluation of powder blend the tablets were
compressed using CEMACH punching machine.
Pre-Compression Parameters [6, 7] Angle of repose
Angle of repose (θ) was determined using fixed funnelmethod. The height of the funnel was
adjusted in such a way that the tip of the funnel just touched the apex of the heap of the
granules. The granules were allowed to flow through the funnel freely onto the surface. The
diameter of the granular cone was measured and angle of repose was calculated using the
following equation. θ = tan-1 (h/r) Where h and r are the height and radius of the cone.
Bulk density
It is measured bypouring the powder in to a measuringcylinder. Then initial volume was
noted. This is called as bulkvolume. From this bulk density is calculated by thefollowing
www.wjpr.net Vol 3, Issue 6, 2014. 1631 Tapped density
The measuring cylinder containing a known mass of blend wastapped for a fixed time. The
volume was measured. Thetapped density was calculated by the following formula. Tapped
Density = Weight of granules / Tapped volume
Compressibility Index and Hausner ratio
The compressibility index and the closely related hausner’sratio have become the simple, fast
and popular methods of predicting powder flow characteristics. The compressibility index
and hausner ratio were determined by measuring both the bulk density and tapped density of
granules.
Compressibility Index = Tapped density – Bulk density× 100 / Tapped density
Hausner’s ratio = Tapped density/ Bulk density
Post-Compression Parameters: [7, 8, 9] Thickness measurement
10 tablets were taken randomly from each formulation and their thickness was measured
using ascrew gauge.
Hardness
The crushing strength or hardness of the tablets was measured with help of a Monsanto
hardness tester and expressed in kg/cm2.
Friability
Friability test is performed to assess the effect of friction and shock, which may often cause
tablet to chip, cap orbreak. Roche friabilator was used for the Purpose.Preweighed sample of
ten tablets were placed in thefriabilator, which was then operated for 100 revolutions.After
100 revolutions the tablets were dusted and reweighed. Compressed tablets should not loose
more than 1% of their initial weight.
Percentage friability = (Initial weight - Final weight / Initial weight) × 100
Weight variation
Twenty tablets were randomly selected and individuallyweighed. The average weight ofthe
www.wjpr.net Vol 3, Issue 6, 2014. 1632 Assay
Ten tablets from each formulation were powdered. Thepowder equivalent to 100mg was
weighedand dissolved in phosphate buffer pH 6.8 in 100mlstandard flasks. From this suitable
dilution was preparedand the solution was analyzed at 255nm using UV doublebeam
spectrophotometerusing pH 6.8 asblank.
Wetting time
Five circular tissue papers of 10cm diameter were placedin a petridish with10cm diameter. 10
ml of simulatedsaliva pH (phosphate buffer pH 6.8) was poured into thetissue paper placed in
the petridish. Few drops of soluble dye (eosin) was added to the petridish. A tablet was
placedcarefully on the surface of the tissue paper. The timerequired for the solution to reach
upper surface of thetablet was noted as the wetting time.
Water absorption ratio
The weight of the tablet before keeping in the petridishwas noted (Wb). Fully wetted tablet
from the petridishwas taken and reweighed (Wa). The water absorptionratio R can be
determined according to the followingformula.
R= (Wa – Wb)/Wa x 100
In vitro dispersion time
In vitro dispersion time was measured by dropping a tablet in a glass cylinder containing 6ml
of phosphate buffer (pH 6.8). Six tablets from each formulation were randomly selected and
in vitro dispersion time was performed.
Uniformity of Dispersion [10]
Fineness of the dispersion was done as an assessmentof the grittiness which arises due to
disintegration ofthe tablet into coarse particles. The test was performedby placing two tablets
in 100 ml water and stirring itgently, till the tablets get completely disintegrated. The
formulation is considered to form a smoothdispersion if the complete dispersion passes
through asieve screen with a nominal mesh aperture of 710 µmwithout leaving any residue on
the mesh.
In vitro disintegrating time [10]
Disintegration time is considered to be one of the important criteria in selecting the best
www.wjpr.net Vol 3, Issue 6, 2014. 1633 cavity) several methods were proposed, developed and followed. One of the simple methods
followed is described below. For this purpose, a Petri dish (10 cm diameter) was filled with
10 ml of water. The tablet was carefully put in the centre of the Petri dish and the time for the
tablet to completely disintegrate into fine particles was noted using a stop watch.
Dissolution test
Dissolution test was carried out using USP rotating paddle method (apparatus 2). The stirring
rate was 50 rpm. 6.8 pH phosphate buffer was used as dissolution medium (900ml) and was
maintained at 37 ± 10C. Samples of 5ml were withdrawn at pre – determined intervals (2, 4, 6, 8, 10, 15, 20, 25 and 30 min), filtered and replaced with 5ml of fresh dissolution medium.
The collected samples were suitably diluted with dissolution fluid, where ever necessary and
were analyzedfor olmesartanmedoxomil at 255 nm by using UV spectrophotometer. Each
dissolution study was performed for three times and mean values were taken.
RESULTS AND DISCUSSION
The FT-IR studies revealed that olmesartanmedoxomil is compatible with the excipients used
in the formulation. There were no extra peaks observed in the IR spectrum. The IR absorption
band in cm-1of the drug and excipients was found to be similar. This established that the drug olmesartanmedoxomil and all the excipients used in the study showed no interaction and
indicated that they were compatible with each other.
Pre-Compression Evaluation Parameters:
The results obtained by evaluating the powder blends of drug and excipients are shown in
Table 2. Bulk density and tapped density were found in the range0.317 – 0.339 g/cc and
0.345 – 0.391 g/cc respectively. The value of hausner’sratio was between 1.08 – 1.17 (< 1.25)
indicating that all batches of powder blends were having good compressibility. Values of
angle of repose (θ) were found in the range of 26.11 – 29.38 showing that blend of powder
was free flowing and can be used for direct compression.
Table 2: Pre-Compression Evaluation Parameters Formulation Angle of
repose (ө)
Bulk density (g/cc)
Tapped density (g/cc)
Compressibilty index (%)
Hausner ratio
F1 27.34 0.318 0.348 8.62 1.09
F2 27.01 0.327 0.378 13.4 1.15
F3 28.32 0.329 0.373 11.79 1.13
F4 29.05 0.321 0.354 9.32 1.10
www.wjpr.net Vol 3, Issue 6, 2014. 1634
F6 29.38 0.335 0.384 12.76 1.14
F7 26.11 0.325 0.382 14.92 1.17
F8 25.92 0.317 0.345 8.11 1.08
[image:7.595.64.538.162.330.2]F9 28.2 0.340 0.381 10.76 1.12
Table 3a: Post-Compression Evaluation Parameters Formulation Thickness
(mm)*
Hardness (kg/cm2)*
Friability (%)*
Weight variation (mg)*
[image:7.595.62.554.374.540.2]Drug content (%)* F1 3.84±0.032 3.05±0.15 0.48±0.03 202.00±0.10 98.9±0.47 F2 3.85±0.028 3.10±0.14 0.58±0.07 210.02±0.25 99±0.65 F3 3.86±0.051 2.95±0.09 0.44±0.06 200.26±0.17 99.1±0.60 F4 3.92±0.048 2.92±0.10 0.56±0.03 204.14±0.49 98.31±0.40 F5 3.91±0.052 3±0.08 0.45±0.05 210.30±0.58 98.7±0.58 F6 3.79±0.038 2.84±0.13 0.42±0.04 206.84±0.34 98.34±0.24 F7 3.86±0.040 2.93±0.07 0.53±0.04 212.90±0.25 99.15±0.38 F8 3.88±0.042 3.08±0.12 0.47±0.04 207.73±0.27 99.32±0.29 F9 3.90±0.034 3.11±0.08 0.53±0.06 202.84±0.26 98.95±0.11 *Each value is the mean ± SD (n=3)
Table 3b: Post-Compression Evaluation Parameters Formulation Wetting time
(sec)*
Water absorption ratio (%)*
In vitro dispersion time (sec)*
Disintegration time (sec)*
F1 38.56±0.32 59±0.05 49.42±0.74 35±0.75
F2 37.42±0.25 57±0.82 40.12±0.71 25±0.63
F3 34.15±0.31 56±0.44 37.69±0.68 22±0.6
F4 44.89±0.35 59±0.82 44.57±0.62 39±0.88
F5 41.32±0.29 56±0.27 39.87±0.77 31±0.77
F6 39.65±0.26 53±0.09 38.46±0.69 26±0.44
F7 37.45±0.27 57±0.59 41.45±0.66 32±0.64
F8 34.23±0.29 55±1.13 36.32±0.71 24±0.62
F9 31.63±0.22 50±0.42 31.53±0.70 19±0.80
*Each value is the mean ± SD (n=3)
Weight variation and Thickness
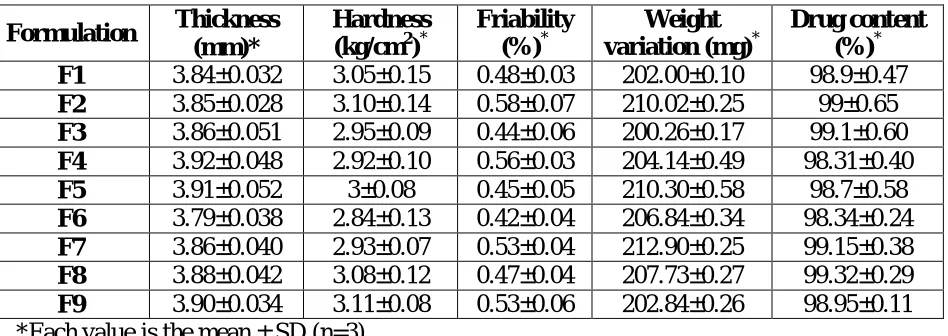
The tablets were tested for uniformity of the weight and thickness; results are shown in Table
3a.In all formulations, tablet weight and thickness were within mean ±7.5% and mean ±5%
respectively. The average weight of all the nine formulations was found to be 200.26±0.17 –
212.90±0.25 mg. The thickness varies between 3.79 ± 0.038 – 3.92± 0.048mm. Friability
values were less than 1% in all cases. Hardness of the tablets was maintained at 2.84±0.13 -
3.11± 0.08 kg/cm2 for all the formulations as mentioned before. Assay was performed and percent drug content of all the tablets were found to be between 98.31± 0.40% - 99.32 ±
www.wjpr.net Vol 3, Issue 6, 2014. 1635 Wetting time
Wetting time was determined for all the formulations and given in the Table 3b. The values
lie between 31.63 ± 0.22 – 44.89 ± 0.35sec. The variability in wetting time for different
formulations may be due to the changes in the compaction which cannot be controlled during
tablet preparation and the type of the disintegrantused.
Figure 1: Graphical representation of wetting time of Olmesartan medoxomil ODTs prepared by varying concentrations of superdisintegrants F1- F9
In vitrodispersion time
In vitro dispersion is aparameter in which the time taken by the tablet for complete dispersion
is measured. Time for all the 09 formulations varied between 31.53 ± 0.7 and 49.42±
0.74seconds the values are given in theTable 3b.
In vitro Disintegration time
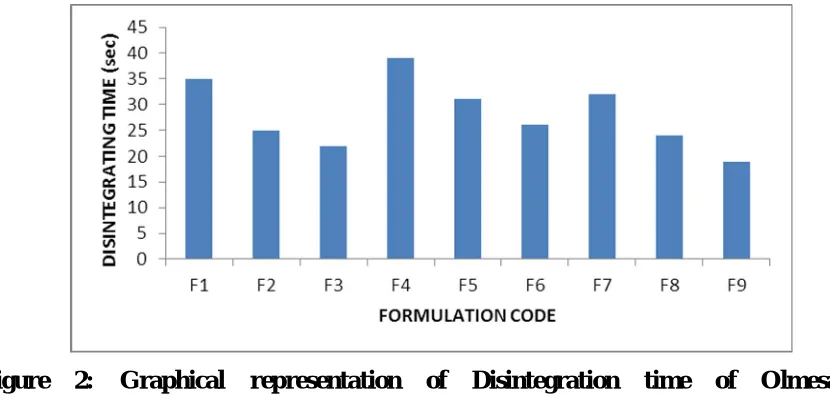
Disintegration time is considered to be important criteria in selecting the best ODT
formulation. The in vitro disintegration time for all the 9 formulations was determined and
given in the table 3b.Thein vitro disintegration time for all the 9 formulations varied from
19±0.8 - 39± 0.88 seconds. The rapid disintegration was seen in the formulations containing
crospovidone. This is due to rapid uptake of water from the medium, swelling and burst
effect. It is also noticed that as the disintegrant concentration was increased from 4 - 6%, the
time taken for disintegration was reduced. The disintegration time of formulation (F9)
containing 6% CP was found to be lower (19± 0.8) and was selected as the best ODT
www.wjpr.net Vol 3, Issue 6, 2014. 1636 Figure 2: Graphical representation of Disintegration time of Olmesartan medoxomilODTs prepared by varying concentrations of superdisintegrants F1-F9.
[image:9.595.82.497.70.275.2]In vitro dissolution
Table 4: % Cumulative Olmesartan medoxomil released from ODTs containing varying concentrations of Croscarmellose sodium.
Time (min) % Cumulative Olmesartan medoxomil released from ODTs*
F1 F2 F3
2 21.95±0.28 13.78±0.52 18.54±0.23
4 35.04±0.28 23.14±0.28 23.97±0.24
6 46.15±0.31 36.4±0.27 36.47±0.26
8 48.30±0.27 54.14±0.25 52.4±0.34
10 63.65±0.27 68.24±0.30 66.47±0.34
15 72.14±0.20 75.14±0.31 78.84±0.29
20 78.24±0.30 84.53±0.29 84.59±0.32
25 84.71±0.24 89.07±0.28 91.04±0.24
30 91.1±0.27 93.57±0.32 96.97±0.23
*Each value is the mean ± SD (n=3)
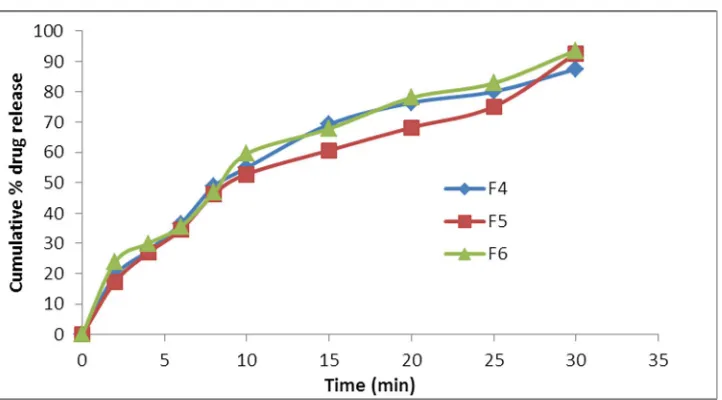
Table 5: % Cumulative Olmesartan medoxomil released from ODTs containing varying concentrations ofSodium starch glycolate.
Time (min) % Cumulative Olmesartan medoxomil released from ODTs*
F4 F5 F6
2 19.27±0.25 17.25±0.20 23.87±0.16
4 27.54±0.31 26.84±0.32 29.94±0.27
6 36.64±0.26 34.58±0.25 35.64±0.29
8 48.78±0.23 46.37±0.26 46.8±0.34
10 54.9±0.20 52.78±0.26 59.54±0.30
15 69.27±0.26 60.64±0.32 67.82±0.27
20 76.47±0.24 68.24±0.29 78.12±0.14
25 80.17±0.17 75.17±0.27 82.94±0.28
30 87.54±0.25 92.6±0.22 93.57±0.18
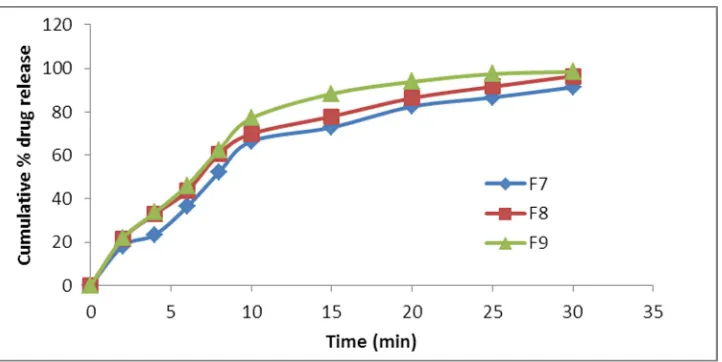
[image:9.595.97.498.595.757.2]www.wjpr.net Vol 3, Issue 6, 2014. 1637 Table 6: % Cumulative Olmesartan medoxomil released from ODTs containing varying concentrations of Crospovidone.
Time (min) % Cumulative Olmesartan medoxomil released from ODTs*
F7 F8 F9
2 18.24±0.30 21.65±0.32 21.87±0.04
4 23.47±0.25 33.14±0.28 33.78±0.02
6 36.47±0.21 43.57±0.31 46.10±0.24
8 52.21±0.33 60.55±0.27 62.49±0.64
10 66.42±0.24 69.87±0.35 77.12±0.28
15 72.87±0.34 77.94±0.28 88.45±0.30
20 82.54±0.23 86.47±0.30 93.97±0.02
25 86.74±0.18 91.74±0.26 97.5±0.36
30 91.5±0.18 96.54±0.14 98.45±0.43
*Each value is the mean ± SD (n=3)
Figure 3: Graphical representation of % Cumulative Olmesartan medoxomil released from ODTs containing varying concentrations of CCS
[image:10.595.118.483.304.471.2] [image:10.595.119.480.515.715.2]www.wjpr.net Vol 3, Issue 6, 2014. 1638 Figure 5: Graphical representation of % Cumulative Olmesartan medoxomil released from ODTs containing varying concentrations of CP
CONCLUSION
In the present work, an attempt was made to develop orally disintegrating tablets of
Olmesartan medoxomil using various super disintegrants. From the study conducted, the
following conclusions were drawn; amongst the various superdisintegrants used in the study,
tablets that were formulated (Direct compression) using Crospovidone, exhibited faster
disintegration when compared to those of Croscarmellose sodium and Sodium starch
glycolate. The order of enhancement of the drug release rate and disintegration time with
various superdisintegrats was found to be Crospovidone >Croscarmellose sodium > Sodium
starch glycolate. It was concluded that formulation (F9) containing6% Crospovidone gave the
better disintegration time of about 19 sec among all formulations and also released a
maximum of 98% of drug within 30 mins and hence the formulation F9 was selected as the
optimized formulation. Hence, from the present work it was concluded that synthetic
superdisintegrant Crospovidone (4%, 5% and 6%) showed better disintegration and in vitro
dissolution profile. Further it is advised that the same work should be confirmed for
its therapeutic efficacy where the in vivo studies in animals and human volunteers are
required to correlate in vitro release data and clinical trials.
REFERENCES
1. SaxenaVaibhav et al., International Journal of Research in Ayurveda & Pharmacy.2010,
1(2); 399-407.
2. Hiranietal., Orally Disintegrating Tablets: A Review. Tropical Journal of
www.wjpr.net Vol 3, Issue 6, 2014. 1639
3. Na Zhao and Larry L. Augsburger. Functionality Comparison of 3Classes of
Superdisintegrants in Promoting Aspirin Tablet Disintegration and Dissolution.AAPS
Pharm Sci Tech 2005; 6 (4): E634-E640.
4. A Gupta1 et al., Recent Trends of Fast Dissolving Tablet - An Overview of
Formulation Technology. International Journal of Pharmaceutical & Biological
Archives. 2010; 1(1): 1-10.
5. Martindale. The Complete drug Reference. Edition 34. Great Britain, Suffolk, The
Pharmaceutical Press. 2005: 975-976.
6. C.P. Jain and P.S. Naruka. Formulation and Evaluation of Fast Dissolving Tablets of
Valsartan. International Journal of Pharmacy and Pharmaceutical Sciences. 2009; 1(1):
219-226.
7. Lieberman H.A., Lachman L. and Schwartz J.B.Pharmacetical Dosage Forms: Tablets.
Edition 2. New York, USA, Marcel Dekker Inc. 2005: 3; 497-553.
8. Liebermann H A Lachman L.The Theory and Practice of Industrial Pharmacy, Special
Indian Edition. India: CBS Publishers. 2010.
9. Dr. Javed Ali, Dr. Alka Ahuja, Dr. R.K. Khar: AText Book of Dosage Form Design.
Edition 1. 2004: 16-17.