DEVELOPMENT AND VALIDATION OF UV SPECTROSCOPIC
METHOD FOR ESTIMATION OF MILRINONE IN FORMULATION
Ranjith Kumar D.*, Mohan S., Vanathi P., Prakash G., Sasikala M., Karpakavalli M.
Associate Professor, Karpagam College of Pharmacy, SF No. 762, Othakkalmandapam, Coimbatore–641 032.
ABSTRACT
Simple, specific, sensitive, reproducible, precised and cost effective UV spectroscopic method for Milrinone in single dosage form has been developed. Milrinone is used in the treatment of congestive heart failure. In the estimation of Milrinone by UV spectroscopy, the λmax
was found to be 271nm for Milrinone in solvent methanol. The calibration curve was obtained for Milrinone in the range 1.0-10.0g/ml. The slope, intercept and correlation coefficient values were found to be 0.0594, 0.0672 and 0.9989 respectively. The 50% and 100% recovery studies were carried out for formulation 1 and formulation 2 by adding known amount of standard drug. The related standard deviation (%RSD) was ˂2%. The stability studies were carried out and the drug was found to be stable more than 12 hours in solution form. Thus, the developed validated UV spectroscopic method can be used for the routine analysis of Milrinone from its single dosage form in research institutions, laboratories and educational institutions.
KEYWORDS: Milrinone, UV spectroscopy, methanol, validation, % RSD, injection.
INTRODUCTION
Milrinone is chemically 1-6-Dihydro-2-methyl-6-oxo-(3,4-bipyridine)-5-carbonitrile and is used in the treatment of congestive heart failure. The development of UV spectroscopic method for the estimation of Milrinone from its injection dosage form by using calibration curve and the method validation based on ICH guidelines has been followed.
Volume 5, Issue 4, 1501-1508. Research Article ISSN 2277– 7105
*Correspondence for
Author
Ranjith Kumar D.
Associate Professor,
Karpagam College of
Pharmacy, SF No. 762,
Othakkalmandapam,
Coimbatore–641 032.
Article Received on 08 Feb 2016,
Revised on 29 Feb 2016, Accepted on 20 Mar 2016
MATERIALS AND METHODS Drug Sample
Milrinone was obtained as a gift sample from Sanofi- Sythe lab Mumbai.
Chemical and solvent
Methanol AR grade
Instruments used
Jasco V-530 UV/VIS Spectrophotometer,
Elico LI 120 pH meter,
Shimadzu Digital Electronics Balance – BL220H.
Selection of Solvent
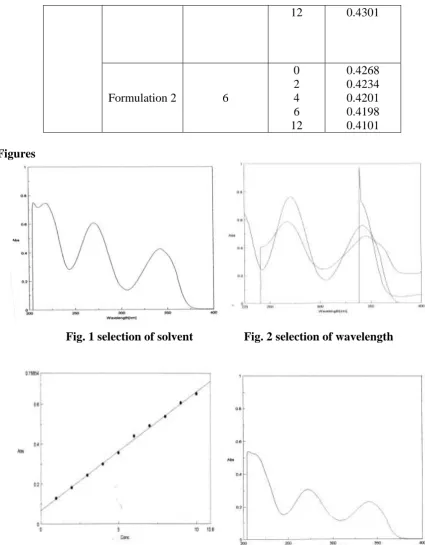
Solubility of the drug was tried in different solvents. Milrinone was found to be soluble methanol and showed a good spectrum with excellent stability. So methanol was selected as the solvent of choice. (Fig. 1).
Preparation of Standard Stock Solutions
Stock solution of 10mg in 100ml was prepared. From this 1ml was taken in a 10ml standard flask and made up to the volume with methanol to get a concentration of 100µg/ml.
Selection of Wavelength
From the stock solution 8µg/ml of Milrinone was prepared separately using methanol. The solution was scanned between 200-400nm and spectra was recorded. Milrinone exhibited maximum absorbance at 271nm (Fig. 2) Hence 271nm was selected for the proposed study.
Preparation of Standard Curves:
Aliquot dilutions were prepared from standard stock solution to get a concentration ranging from 1-10µg/ml using methanol. Absorbance of these solutions was measured at 271nm (Table 1). The measured absorbances were plotted against concentrations. From the graph it was found that Milrinone showed the linearity range between 1-10µg/ml. (Fig. 3).
Analysis of Formulation
resultant solutions were scanned in the wave length range of 200-400 nm and the absorbance were measured (Fig. 4). The amount was calculated using single point standardisation method. (Table 2).
Method Validation
The method developed was validated in terms of linearity and accuracy.
Linearity
Milrinone was found to be linear in a range of 1-10µg/ml. The absorbances of these solutions were measured at 271nm, and a calibration graph was plotted using concentrations Vs absorbances. The slope, intercept and correlation coefficient values were found to be 0.0594, 0.0672 and 0.9989 respectively. (Fig. 3).
Accuracy
The accuracy, specificity, suitability and validity of the present method were studied by conducting percentage recovery studies. A known quantity of the pure drug was added to the pre-analyzed sample formulation at 50% and 100% levels. The percentage recovery and standard deviations were calculated. (Table 3).
Precision
Intra-day assay
Intra-day precision was studied by measuring the absorbance of the standard drug solutions repeatedly on the same day. Solutions of 5µg/ml and 6µg/ml were used for the study. %RSDs were calculated which is shown in Table 4.
Inter-day assay
Interday precision was studied by measuring the absorbance of the standard drug solutions repeatedly on different days. Solutions of 5µg/ml and 6µg/ml were used for the study. % RSDs was calculated. (Table 5)
Stability Studies
RESULTS
Table 1: Linearity range
Concentration (µg/ml)
Absorbances (271nm)
1 0.1293 2 0.1816 3 0.2446 4 0.3002 5 0.3562 6 0.4402 7 0.4920 8 0.5382 9 0.6063 10 0.6520
Table 2: Analysis of formulation
Drug Formulation Amount (mg/amp) %Label claim
±SD٭ Label claim Estimated amount
Milrinone
Formulation 1 1 0.951 95.1± 0.43 Formulation 2 1 0.945 94.5 ± 0.51 ٭Mean of six observation
Table 3: Recovery Studies
Drug Formulation
Amount recovered
(mg)/ amp) % RSD *
50% 100% 50% 100%
Milrinone Formulation 1 98.06 97.99 0.14 0.16 Formulation 2 98.41 98.5 0.15 0.17 *Mean of six Observations
Table 4: Intraday assay
Drug Formulation Concentration
[µg/ml] Absorbance % RSD *
Milrinone Formulation 1 5 0.3472 0.3552 0.3434 0.3420 1.7071 6 0.4485 0.4562 0.4432 0.4412 1.4979
Formulation 2 5
0.3321 0.3312 0.3301 0.3300
0.4234 0.4201 0.4182 *Mean of four determinations.
Table – 5Inter-day assay
Drug Formulation Concentration
(µg/ml) Day Absorbance % RSD *
Milrinone Formulation 1 5 1st 0.3562 0.3550 0.3521 0.3482 1.0088 2nd 0.3432 0.3431 0.3420 0.3391 0.5593 6 1st 0.4486 0.4521 0.4462 0.4454 0.6714 2nd 0.4432 0.4401 0.4312 0.4286 1.6024 Formulation 2 5 1st 0.3381 0.3354 0.3301 0.3286 1.3376 2nd 0.3234 0.3224 0.3212 0.3201 0.4445 6 1st 0.4281 0.4273 0.4240 0.4208 0.7763 2nd 0.4202 0.4183 0.4182 0.4104 1.0432
Table – 6 Stability Studies
Drug Formulation Concentration (µg/ml)
Time in
hours Absorbance
Milrinone Formulation 1 6
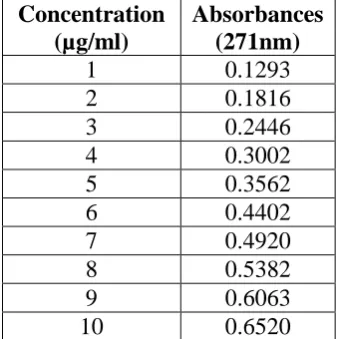
12 0.4301
Formulation 2 6
0 2 4 6 12
0.4268 0.4234 0.4201 0.4198 0.4101
Figures
[image:6.595.75.501.67.613.2]Fig. 1 selection of solvent Fig. 2 selection of wavelength
Fig. 3 standard graph of milrinone Fig. 4 spectrum of formulation
DISCUSSION
CONCLUSION
The developed simple, specific, sensitive, reproducible, precised and cost effective UV spectroscopic method for Milrinone in single dosage form can be used for the routine analysis of Milrinone from its single dosage form in research institutions, laboratories and educational institutions.
ACKNOWLEDGEMENT
We are thankful to the Management of Sri Ramakrishna Institute of Paramedical sciences, Coimbatore for providing all the facilities to carry out the mentioned research work successfully. We take a great opportunity to thank the Management and the Principal of Karpagam College of Pharmacy, Coimbatore for supporting us to publish our research paper in this article.
REFERENCES
1. Sasikala M, Bojja Aswini, Gowthami CL, S Nithya, Jamuna KM, Kiran Kumar A. Extraction, isolation, characterization of phytoconstituents from Curcuma caesia Roxb. By various analytical methods. International Journal of Research in Pharmaceutical and Nano Sciences, 2012; 1(2): 257-268.
2. Sasikala M, Bojja Aswini, Gowthami CL, S Nithya, Jamuna KM, Kiran Kumar A. Application of UV spectroscopic method for drug interaction studies of Mefenamic acid with Ofloxacin. International Journal of Research in Pharmaceutical and Nano Sciences, 2012; 1(2): 274-280.
3. The Merck Index. 13th ed., Merck & co. Inc., NJ, U.S.A, 2001; 3466.
4. Sharma BK. Instrumental Methods of Chemical Analysis. 24th ed., Goel Publishing House, Meerut, 2005; 68-176: 286-319.
5. Ashutoshkar, Pharmaceutical Drug Analysis, 1st ed., Minerva Press, Vasant Vihar, New Celhi, 2001; 55-57.
6. Satinder A, Stephen S, Hand Book of Modern Pharmaceutical Analysis., 3: 1-2.
7. Skoog DA. Principles of Instrumental Analysis. 3rd ed., CBS publishing & Sons, 1988; 40-58.
8. Beckett AH, Stenlake JB. Practical Pharmaceutical Chemistry-Part B. 4th ed., CBS publishers and Distributors, New Delhi, 2002; 275-315; 85-157.
10.Berry IR, Nash RA. Pharmaceutical process validation. 2nd ed., Marcel Dekker Inc, New York, 2000; 411.
11.Parfitt K, Martindale. The complete Drug Reference. 32nd ed., the Pharmaceutical Press, London, 1999; 862.
12.Munson JW. Pharmaceutical Analysis: Modern methods, Part–A. International medical book distributors, Mumbai, 2001; 230-231: 239-262.
13.Mendham J, Denney RC, Barnes JD, Thomas MJ. Vogel’s Textbook of Quantitative Chemical Analysis. 6th ed., Pearson education, Delhi, 2003; 1-11: 251-261, 617.
14.Munson JW. Pharmaceutical Analysis: Modern methods - Part B. International medical book distributors, Mumbai, 2001; 15-30: 155-173.