Work Smart – Reducing Effort in Short-Answer Grading
Margot Mieskes Hochschule Darmstadt, h da
Darmstadt, Germany
margot.mieskes@h da.de
Ulrike Pad´o
Hochschule f¨ur Technik Stuttgart, HFT Stuttgart, Germany
Abstract
In language (and content) instruction, free-text questions are important instruments for gaug-ing student ability. Grading is often done manually, so that frequent testing means high teacher workloads. We propose a new strat-egy for supporting manual graders: We care-fully analyse the performance of automated graders individually and as a grader ensemble and present a procedure to guide manual effort and to estimate the size of the remaining grad-ing error. We evaluate our approach on a range of data sets to demonstrate its robustness.
1 Introduction
Using computers in teaching has opened up new possibilities for learning independent of time or location while receiving individual feedback through frequent testing. For this, automated eval-uation of student answers, supported most easily by closed question formats like multiple choice, is key. This means that tests usually do not contain open question types like short answer questions, although these are didactically valuable because they provide insight into students’ reasoning.
There is a substantial body of research address-ing automated short-answer gradaddress-ing (SAG, see Burrows et al. (2015) for an overview). How-ever, the resulting tools are not widely used to pro-duce completely automated student feedback. In-stead, automated methods to reduce manual grad-ing workload have been proposed (which can also be used to reduce annotation workload for train-ing data in general). The use of clustertrain-ing for label propagation (Basu et al., 2013; Horbach et al., 2014; Zesch et al., 2015; Horbach and Pinkal, 2018) and of Active Learning (Horbach and Palmer,2016) has been investigated.
This work is licensed under a Creative Commons Attri-bution 4.0 International Licence. Licence details: http: //creativecommons.org/licenses/by/4.0/.
In this paper, we describe a new strategy to re-duce human graders’ workloads. We pre-grade student answers with automated methods that have been carefully analysed to reveal their strengths and weaknesses with regard to the target cate-gories. Combining several automated graders into an ensemble additionally yields insight into the reliability of individual machine grades. Human grading effort can now be focused on reviewing those answers that were most likely not graded correctly.
Effectively, we harness two basic insights of machine learning: Learners perform best on frequently-attested classes (and consequently, under-represented classes require more human at-tention), and ensembles of learners outperform any given single model (and consequently, auto-mated decisions with high agreement across learn-ers are likely reliable).
Our strategy allows a sizeable reduction of hu-man effort (by at least 40% and up to 93%), while grading accuracy remains at or even improves be-yond purely human grading.Since not every stu-dent answer is reviewed by a teacher, our approach does not support individual teacher comments on each answer. It is useful in situations where over-all performance is being determined by accumu-lating the grades for individual answers, for exam-ple placement tests or recurring text comprehen-sion tests.
grader compared to the human gold standard (Sec-tion5). In Section6, we assess how much grading effort can be saved and how much grading error remains when we use reliability estimates that are based on the Inter-Annotator Agreement of ma-chine grades only. We summarise our conclusions and point out future work in Section8.
2 Related Work
Recent work in minimising human annotation ef-fort for short-answer questions has followed two strategies: Clustering similar answers so that each set can be graded together (Basu et al., 2013; Brooks et al., 2014; Horbach et al., 2014;Zesch et al., 2015) or existing grades can be propa-gated (Horbach and Pinkal, 2018), and selecting the most informative answers for Active Learning (Horbach and Palmer,2016). Manual workload is reduced either in order to directly benefit teachers (Basu et al.,2013;Horbach et al.,2014;Horbach and Pinkal,2018) or in order to assist the creation of training data for automatic grading (Zesch et al., 2015;Horbach and Palmer,2016).
Beyond faster grading, clustering similar an-swers can also provide interesting insights into common (mis-)perceptions of the subject matter according toBasu et al.(2013), which underscores the didactic usefulness of short-answer questions. In follow-up work, Brooks et al. (2014) demon-strate a speed increase for assigning an initial grade of a factor of three when using clustering support (which corresponds to 66% of time saved). They work on native-speaker content-assessment data, whileHorbach et al.(2014) develop a simi-lar approach for language learner data and report a comparable speedup: Using their method could save the correction of 60% of items at 85% grad-ing accuracy. Horbach et al.(2014) acknowledge that perfect scoring accuracy is not necessary in many testing settings; we will investigate human performance levels in Section4below.Zesch et al. (2015) aim to reduce the amount of manual an-notation required to create training data for au-tomated graders and find that the clustering ap-proach is most useful for very short answer texts.
Horbach and Palmer (2016) perform Active Learning, where instances to be manually labelled are selected to quickly optimise classifier perfor-mance. They find that uncertainty-based sample selection is more efficient in improving the classi-fier than a random and a cluster-based baseline.
However, there is great performance variability across the question corpus.
Zesch and Horbach (2018) introduce a cluster-ing and classification workbench intended to fa-cilitate both first practical applications of human grader support and further research.
3 Experimental Setup
Our experiments target ad-hoc tests such as weekly quizzes or end-of-term exams, where question re-use is limited. This sets us apart from approaches that use a corpus of sample an-swers to prepare grading models for a standard-ised question pool. Rather, it restricts us to an unseen-question setting in which no training an-swers are available for any of the questions in the test set. We use various data sets (Section 3.1) to train machine learners (Section 3.2) and eval-uate their performance using Precision/Recall and Inter-Annotator Agreement (IAA) (Section3.3).
3.1 Data
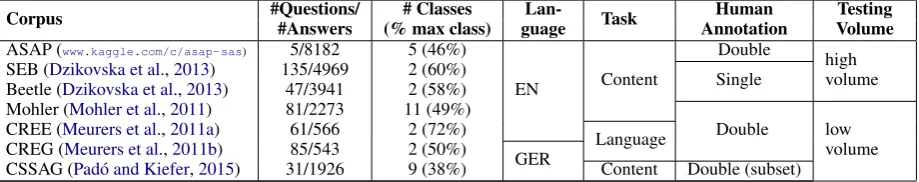
We test the generality of our findings by using a range of standard corpora that vary in size, lan-guage and test setting (see Table1). Our largest corpus is ASAP, although only five out of ten ques-tions have a reference answer and can be used in the unseen question setting. Five corpora are in English, two in German. Half of our corpora are collections of questions generated for low-volume testing (of tens of students at a time) that are graded by the teachers. SEB, Beetle and ASAP (Higgins et al.,2014) are from high-volume, stan-dardised testing and grading situations. Both cor-pora of language learner data (CREG and CREE) fall into this category; the other corpora test con-tent mastery. For four data sets (ASAP, CREE, CSSAG and Mohler) we have more than one set of human annotations.1
We also show the number of grade categories present in each corpus.2 We generally observe a
strong skew towards the majority category in our multi-class corpora. These characteristics of the data will be relevant in Sections4and5below.
1
CREG also has multiple annotations, but was con-structed to contain only answers with agreeing human anno-tation.
2
Corpus #Questions/ # Classes Lan- Task Human Testing #Answers (% max class) guage Annotation Volume
ASAP (www.kaggle.com/c/asap-sas) 5/8182 5 (46%)
EN Content
Double high
volume SEB (Dzikovska et al.,2013) 135/4969 2 (60%) Single
Beetle (Dzikovska et al.,2013) 47/3941 2 (58%) Mohler (Mohler et al.,2011) 81/2273 11 (49%)
Double low volume CREE (Meurers et al.,2011a) 61/566 2 (72%)
Language CREG (Meurers et al.,2011b) 85/543 2 (50%)
GER
[image:3.595.75.535.44.135.2]CSSAG (Pad´o and Kiefer,2015) 31/1926 9 (38%) Content Double (subset)
Table 1: Corpus sizes and characteristics
3.2 Automated Graders and Features
We follow the most common literature conceptu-alisation and treat the prediction of human short-answer grades as a classification task: The human grades are ordinal in nature, which means the or-der of the categories is defined, but the distance be-tween individual categories is not. We normalise the categories by using the percentages of the maximum score (e.g., 0% and 100% for the two-category corpora). This is useful because ques-tions can have different maximum scores, which means that the impact of absolute points differs across the corpus (2 points could be partially cor-rect for one question, but fully corcor-rect for another). Of course this also means that some of the inter-mediate percentage-based categories will be rare (e.g., 33% will only occur for the subset of 3-point questions if grading is in one-point steps).
As four out of seven corpora have little data, which reduces the possibility to tune parameters, we follow recommendations by Madnani et al. (2016) and employ Random Forest (RF) and Sup-port Vector Machines (SVM), adding Decision Trees (DT) as a third algorithm for their ease of interpretation (all from the Weka machine learn-ing toolkit3).
Individual models are trained by leave-one-question-out cross-validation to make the most of our smaller data sets. We experimented with fur-ther parameter tuning on the Beetle and SEB data sets, which provide unseen-question dev and test sets. Tuning did improve performance on the test sets, but rarely affected performance in the leave-one-question-out setting. By Occam’s razor, we therefore do not further tune parameters. This also applies to modifications of the training regime such as cost-sensitive learning. As a result, our learner performance underestimates the tuned, op-timal case.
We use the feature set described byPad´o(2016),
3
https://www.cs.waikato.ac.nz/ml/weka
who selected representative features explored in the literature: N-Gram features (token and lemma-based), text similarity features (with/without stop words), the overlap between student and reference answer in terms of dependency parse and deep se-mantic representations, and textual entailment (de-cision and confidence).
3.3 Evaluation Measures
We report weightedPrecision(P) andRecall(R)4
– on the whole corpus in Section4, for comparison to human performance; and per predicted category (see Section 5), for a more detailed performance analysis. P and R indicate how reliable a learner’s category predictions are and how well they over-lap with the actual incidence of that category. Note that weighted overall Recall corresponds to overall
Accuracy. Overall weighted RecallRec is com-puted as in Equation1.
Rec=
P
c T PcT P+F Nc c ∗Nc Ntotal
(1)
SinceT Pc+F Nc =Nc,
Rec=Acc=
P
cT Pc
Ntotal
. (2)
The advantage of Inter-annotator Agreement (IAA) measures such asFleiss’κ((1971), which
is more general than Cohen’s κ (1960)) is that they take into account chance agreement by con-sidering the study-specific distribution of annota-tion categories. Fleiss’ κ allows us to compute agreement for individual answers as well as on the question level.κestimates the annotation reliabil-ity in cases where two or more annotators (human or machine) are present. It is computed as
κ= P¯−P¯e 1−P¯e
(3)
4
where1−P¯edenotes the agreement predicted by chance andP¯−P¯edenotes the agreement ac-tually attained.P¯andP¯eare calculated as:
¯
P =
N
X
i=1 Pi
N (4)
¯ Pe =
k
X
j=1
p2j (5)
For each answer that receives a grade, we can calculate the individual agreementPias
Pi=
k
P
j=1
n(nij−1)
m(m−1) =
k
P
j=1
n2ij−nij
m2
−m
(6)
wheremis the number of annotators,nij is the number of annotators that chose a categoryj for token i, k the number of categories and N the number of tokens.
We followYannakoudakis and Cummins(2015) and do not report correlation measures like Pear-son’srand Spearman’sρ, as they are not appropri-ate for data with many ties (such as grading data sets with their fixed range of categories). Further-more,r is sensitive to outliers, whileρinherently measures the ability of a system to rank answers appropriately, as opposed to predicting the correct category. As such, correlation measures do not support our goal of determining how reliable item-wise machine predictions are.
4 Experiment 1: Comparing Human and Machine Performance
Our first experiment investigates human-human performance and compares it to the reliability of automated grading. We compute human P, R andκ
for the data sets where informative double manual annotations are available (ASAP, CREE, CSSAG and Mohler). For the human data, we report the performance of the best single annotator against the gold labels and show machine P and R for comparison. We begin with the easiest setting: bi-narycorrect-incorrectclassification for all corpora (where correctmeans> 50%of the max score). Results are shown in Table2.
Human P/R results (H P and H R in Table 2) are in the eighties (up to 94 for ASAP) through-out. For the Mohler data, we show two perfor-mance numbers: For this data set, the gold stdard is created by averaging the two single an-notations; therefore, every annotator’s grades are
highly correlated with the gold. This leads to arti-ficially inflated P and R values (shown in brackets in Table 2). For the other grades, the gold stan-dard was created independently (CSSAG) or one annotator’s grades are marked as the gold standard (CREE and ASAP), so that the other’s grades are independent of gold. Treating the Mohler data in this way (using annotator “me” as gold annotation) results in performance in the low eighties. We refer to this evaluation method als Mohler strict evaluationbelow.
Our results show that human annotation with up to 16.5% of error (Mohler strict evaluation, 14.2% for CREE) has been accepted in the past for low-volume testing. (Assuming error to be 1-Accuracy, that is 1-R, since weighted R equals Ac-curacy). For high-volume testing (ASAP), we see much lower rates at 6% error.
Humanκvalues vary widely across corpora and range from 0.41 (Mohler) to 0.82 (ASAP). The higherκ, the better the human annotators agreed on the grades, producing clearly defined categories and clean training data.
We find low κs for corpora collected as a by-product of low-volume, ad hoc testing with many different questions and different grade categories (CSSAG, CREE and Mohler). ASAP, collected in a high-volume testing setting, is the opposite, since the reliability of multi-annotator grading is a priority when single-annotator grading is impossi-ble due to testing volume. Consequently, there is a small number of grade categories and clear scor-ing rubrics exist for each question (and graders were likely carefully trained to apply them con-sistently).
Measure ASAP CREE CREG CSSAG Mohler Beetle SEB
H PR 93.793.7 86.085.8 n.a.n.a. 89.289.9 82.7 (95.4)83.5 n.a.n.a. n.a.n.a.
RF P 86.0 85.4 84.6 71.0 87.5 (93.6) 78.4 70.6
R 86.2 86.0 84.5 70.4 89.0 78.0 70.7
[image:5.595.142.458.41.106.2]H κ 0.82 0.64 n.a. 0.54 0.41 n.a n.a.
Table 2: Weighted Precision (P) and Recall (R): Human-gold (H) and machine-gold (Random Forest, RF) perfor-mance for binary classification. Human-human Fleiss’κ. n.a.: Single human annotation only.
the machine results are the lowest of all four cor-pora. This may be caused by the low reliability of the human annotations (evidenced by low κ). The strong skew of the Mohler data (49% of data points are annotated with the highest of 11 cat-egories) probably masks a similar effect for that corpus.
5 Experiment 2: Strengths and
Weaknesses of Single-Model Grading
Experiment 1 has presented human annotation standards and the performance of a vanilla auto-mated grading model. While the autoauto-mated grader clearly has room for improvement, our next analy-ses show that even unreliable machine predictions can considerably reduce human grading effort.
Our goal is to focus the human grading effort on those answers where it is most needed. We accept the consequence that not every student an-swer will be reviewed by a human grader and that some errors will remain in the final grades. There-fore, the approach is most suitable for testing situ-ations where the grades for individual answers are combined into an overall grade. This accumulated grade is more robust towards some remaining er-ror.
Note that the notion of “most needed human at-tention” depends on the testing context. In for-mative feedback situations, it is more acceptable to receive approximate grades than in high-stakes testing, since no decisive consequences depend on formative feedback. We will further discuss these issues below, where we strive to present the trade-off between grading accuracy and grading effort in order to allow users to find the ideal balance for their situation.
In this Section, we take a first step and dis-cuss how to identify reliable machine grades based only on the RF grader’s strengths and weaknesses. In Section 6, we will move on to comparing au-tomated predictions from several learners for im-proved reliability estimates.
Correct Incorrect Majority
Corpus P R P R class
[image:5.595.318.515.160.252.2]ASAP 69.8 66.3 90.6 91.9 I CREE 89.8 93.1 68.0 57.9 C CREG 83.3 85.2 85.8 84.1 – CSSAG 54.3 58.3 79.1 76.3 I Mohler 89.4 99.2 74.2 16.4 C Beetle 70.8 76.5 83.4 78.9 I SEB 70.0 52.7 70.9 83.7 I
Table 3: Weighted P and R per category (binary classi-fication) and majority class (CREG is balanced by de-sign). RF classifier.
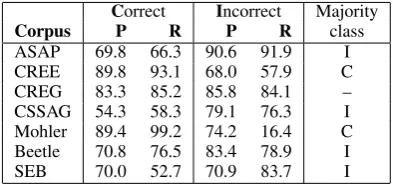
5.1 Case 1: Binary classification
Table 3 shows category-wise P and R for binary classification. As can be expected, the majority class is predicted more reliably and with fewer er-rors in all cases. As CREG is balanced by design, there is no such frequency effect. For the highly imbalanced data sets, R drops steeply in the mi-nority category (between 25%-points for ASAP – 71% incorrect – and 83%-points for Mohler – 87% correct) as the machine grader over-generalises to the majority category.
These results indicate that in a binary setting, manual effort should focus on reviewing the pre-dicted minority class results, as the majority class is fairly reliably marked. For a strongly skewed corpus like ASAP, 1717 instances out of 8182 (21%) need to be reviewed, while for a less skewed corpus such as Beetle, 1708 out of 3942 instances (43%) need to be checked.
Since most corpora are imbalanced, checking only the minority class predictions would save 60-80% of labor while eliminating the largest er-ror source. However, when relying on automatic graders, the information about which answers may have wrongly received the majority class is not available. Additionally, due to the binary setting, no additional information is available to reduce the error further.
all majority class predictions or at least a sam-ple should additionally be checked to catch mis-assigned minority class answers.
5.2 Case 2: Multi-class classification
We now move on to the more complex multi-class case (where a spectrum of grades is assigned in-stead of just pass/fail). We have three data sets with more than two target categories: ASAP (five categories), CSSAG (nine) and Mohler (11). We again evaluate RF classification using P/R. We also report category-wise human-human perfor-mance for comparison.
Table 4 shows results for the CSSAG data. Clearly, in the harder multi-class case, both human and machine grader performance degrade com-pared to the results in Table 2. Recall that the human-human data is for a subset of CSSAG – there are additional categories in the whole data set that are not covered in the subset. Human per-formance on all metrics is best for the categories0
and1, with similarκfor0.5. For categories0.25
and0.75, human agreement becomes erratic, with low P/R and κs, which indicates that these cate-gories are not assigned consistently. This implies that these intermediary categories are not well-defined in the annotators’ minds, which in turn causes data quality to suffer. Not surprisingly, therefore, the RF P and R show patterns of fre-quency (rare categories not attested in the human-human subset are predicted badly) and of annota-tion cleanness. Therefore, predicannota-tions of 0, 0.75
(high P) and1(which make up 74% of the train-ing data) can be trusted, while the other 25% of predictions should be checked. Additional spot checks of1 predictions are also advisable due to the lower P in high-stakes settings, while in for-mative settings, it may not be as important to dif-ferentiate between the fine-grained grade steps and over-generalisations to1may be acceptable.
Table5shows the results for ASAP. Again, both human and machine overall performance drop for the harder task, but with just five categories, the drop is not as steep. Also, human and machine performance is much more robust across all cate-gories. The automated grader performs worst on categories 0.33 and 0.66. Since human perfor-mance is stable for these categories, this is prob-ably a frequency issue as the categories are well-defined and clear to the annotators, and the auto-matic grader is generally reaping the benefits of
clean data for the majority class. The machine pre-dictions for category0, which makes up about half of the gold annotations, can generally be trusted, while predictions of 0.33 and 0.66 (23% of the data) should always be checked.
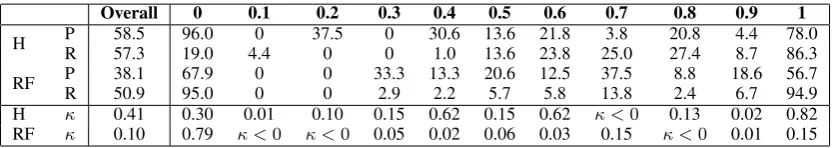
For the Mohler data set with 11 categories, the drop in performance from the binary classification case is clearest (Table 6, “overall” column; we present the stricter evaluation of one human anno-tator against the other). Looking at the category-wise results, the Mohler data set, like CSSAG, suffers from both ill-defined and sparsely attested categories. We see low human P/R except for 0
and 1 and low human κ except for 0.4, 0.6 and
1. Additionally, in case of human disagreement the difference between the human grades is often in the range of just one grade; this begs the ques-tion whether the difference between the 11 cate-gories can in fact be reliably annotated. The data sparseness stems from the fact that the majority of questions uses only six categories. This results in no machine predictions or very low P/R except for categories0and1.
Together, these two categories make up 50% of the training data. Any other category predictions are likely to be incorrect and should be checked; in a high stakes setting, even predictions for 1
could be additionally reviewed because the rela-tively low P at high R indicates over-generalisation towards this category.
In sum, when using a single, imperfect ma-chine grader, we can already identify a relatively large set of student answers that is likely graded correctly and probably does not need further hu-man attention. The more target categories there are in the data, the more fine-grained the analy-sis becomes, but also the reliability of both human and machine grades suffers. Therefore, in a high stakes situation, human graders can be most reli-ably supported by automated grades for a binary pass/fail decision if the machine grader shows high recall for the minority class. If this is not the case or if the distinction between more grade steps matters, the setup presented here may still be useful for formative feedback since repeated, for-mative feedback is a large drain of human grader resources and human time saved may outweigh the approximate nature of the grades.
Overall 0 0.17 0.25 0.33 0.5 0.66 0.75 0.83 1
H PR 77.276.2 79.298.3 –– 57.762.5 –– 50.057.4 –– 45.039.1 –– 93.562.3
RF P 49.1 63.7 0 18.2 0 40.7 15.8 75.0 0 38.4
R 67.4 73.6 0 2.0 0 10.0 10.3 2.6 0 71.6
[image:7.595.138.463.42.104.2]H κ 0.54 0.65 – 0.27 – 0.59 – 0.36 – 0.68
Table 4: CSSAG: Human-gold (H) and machine-gold (RF) P and R, human-humanκvalues. – : No prediction made.
Overall 0 0.33 0.5 0.66 1
[image:7.595.75.289.153.216.2]H P 87.2 92.4 87.6 80.4 86.0 86.0 H R 87.2 92.4 86.6 81.3 86.0 85.1 RF P 64.7 81.8 39.3 61.8 34.2 47.6 RF R 67.4 89.0 23.9 64.4 22.8 64.5 Hκ 0.82 0.88 0.86 0.74 0.85 0.82
Table 5: ASAP: Human-gold (H) and machine-gold (RF) P and R. Human-humanκvalues.
ASAP (2)
ASAP (5)
CREE (2)
CREG (2)
CSSA G(2)
CSSA G(9)
Mohler (2)
Mohler (11)
Beetle (2)
SEB (2) 0
20 40 60 80 100
72 50
72 69 55
31
85 35
63 54
12 15
13 15 16
18
4 15
14 16
8 11
9 9
17 19
8 15
13 18
8 17
6 7 12 26
3 26
10 12
7 6 9
%
of
items
NA PartAF FullAF PartAT FullAT
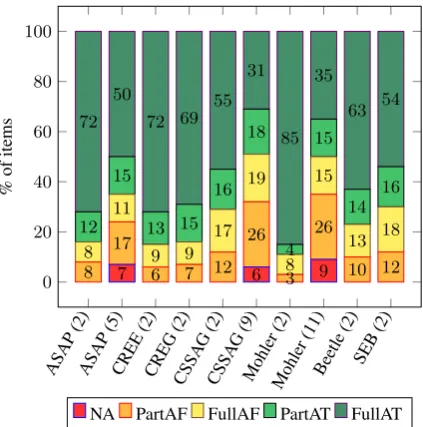
Figure 1: Proportion of items with no agreement (NA), partial agreement on false prediction (PartAF), full agreement on false prediction (FullAF), partial agree-ment on true prediction (PartAT) and full agreeagree-ment on true prediction (FullAT), in brackets: # of classes.
6 Experiment 3: Item-wise Reliability of Ensemble Grading
We now switch from using a single automated grader to combining three automated graders (RF, DT and SVM). This approach allows us to gen-erate multiple machine annotations and use them for reliability estimates. We useκ to analyse the automated graders’ reliability down to the single-item level and to generate fine-grained reviewing recommendations for manual graders.
We assume that a machine grade is more reli-able if more of the graders in our ensemble
pre-dict it (and therefore agree better, such that κ is high). With three learners, the item-wise predic-tions can be in full agreement (FullA,κ= 1), par-tial agreement (PartA,κ = 0.83) or no agreement (NA,κ= 0).
Figure 1 shows automated grader agreement and disagreement for the binary (and, where ap-plicable) multi-class case. The number of target categories is given in brackets. This figure demon-strates that our assumption of greater agreement = greater reliability is generally justified: Com-pare the proportion of true and false predictions for full agreement and partial agreement. There are vastly fewer cases of FullAF (full agreement, false; yellow) than FullAT (full agreement, true; dark green), while cases of PartAF (partial agree-ment, false; orange) and PartAT (light green) are closer to balance.
Cases of FullAF (full agreement, false predic-tion; yellow) are generally around 10%, with a maximum of 19% for CSSAG (9). This is similar to human standards: Human annotators may also agree on a category that does not match the gold standard. In our CSSAG subset, this occurred for 10% of annotations, as well.
Given this picture, our recommendation is to manually review answers in the order of the amount of learner disagreement on the category, beginning with NA. The first lines of Table7show that in the binary case, reviewing only NA cases of course means no manual work (three graders have to agree at least partially on two labels, so there is always a clear majority for one label), at error levels between 11% (Mohler (2)) and 30% (SEB). For four out of the seven corpora, error levels would already be close to human agreement error (at1−Accuracy=15% – recall Section4). This picture is close to single-grader performance in Section5.1.
[image:7.595.76.288.259.473.2]Overall 0 0.1 0.2 0.3 0.4 0.5 0.6 0.7 0.8 0.9 1
H RP 58.557.3 96.019.0 4.40 37.50 00 30.61.0 13.613.6 23.821.8 25.03.8 27.420.8 8.74.4 78.086.3
RF P 38.1 67.9 0 0 33.3 13.3 20.6 12.5 37.5 8.8 18.6 56.7
R 50.9 95.0 0 0 2.9 2.2 5.7 5.8 13.8 2.4 6.7 94.9
[image:8.595.91.510.41.115.2]H κ 0.41 0.30 0.01 0.10 0.15 0.62 0.15 0.62 κ <0 0.13 0.02 0.82 RF κ 0.10 0.79 κ <0 κ <0 0.05 0.02 0.06 0.03 0.15 κ <0 0.01 0.15
Table 6: Mohler: Human-gold (H) and machine-gold (RF) P and R. Human-humanκvalues. n.a.: No prediction made.
Binary Classification Multiclass Strategy Measures ASAP CREE CREG CSSAG Mohler Beetle SEB ASAP CSSAG Mohler
NA only
Effort (%) 0 0 0 0 0 0 0 7 4 9
Error (%) 16 15 16 29 11 23 30 28 44 41
PartA/ weak
Effort (%) 12 7 – 12 5 13 12 23 35 50
Error (%) 12 13 – 23 9 17 25 18 25 15
PartA/ all
Effort (%) 20 19 12 27 7 24 28 39 50 59
Error (%) 8 9 9 17 8 13 18 11 19 15
Table 7: Remaining effort (in % of items) and remaining error for all corpora following different review strategies. NA only: Review no-agreement answers; PartA/weak: Revise PartA predictions of classes with weak classifier performance; PartA/all: Revise all PartA predictions. Bold: Errorator below observed human agreement. –: CREG has no majority class.
hand-assigned categories are always correct, re-maining error would then range between 28% (ASAP (5)) and 45% (CSSAG (9)). More hu-man effort is clearly needed to further reduce er-ror in most grading situations, even though grader workload has been greatly reduced over the single-grader case (where 25-50% of predictions had to be reviewed) and remaining error also drops for ASAP and Mohler compared to using a single grader.
Finding Errors Figure 1 implies that grades predicted in partial agreement are unreliable be-tween 32% (CREE, CREG) and 43% (CSSAG (2), Mohler (2)) for the binary case and (at best) half of the time for the multiclass case. For comparison, grades predicted in full agreement are unreliable between 4 and 25% in the binary case and between 14 and 38% in the multiclass case. Focusing on PartA predictions is therefore an efficient use of human effort.
We can zoom in further on likely errors by con-centrating on the categories that are most likely affected because the machine graders perform weakly on them. For ASAP (5), machine grad-ing performance is known to be worst for classes 0.33, 0.66 and 1 (see RF performance in Table5). 60% of the erroneous PA predictions are in fact for those classes. Reviewing all PartA cases for these categories, which make up 16% of the total data set, and additionally checking all items where the
machine graders disagree (7%) results in a reduc-tion of manual grading effort of 77% of the items, while holding remaining error at 18%. Remaining error can be further reduced to 11% by revising the PartA predictions forallclasses instead of just the weakest classes. Humans still review only 39% of all answers in this case (corresponding to 61% of effort saved).
Table7shows the remaining manual effort and error for all data sets for the PartA/weak strategy (revise cases of NA and those PartA categories that the RF grader is known to perform weakly on) as well as for the PartA/all strategy. For the binary corpora, the predictions for the minority class are reviewed for the PartA/weak strategy.
Relaxing the Evaluation A second measure that helps save human effort is reconsidering the gravity of machine errors in the multiclass case: In repeated formative testing, a difference between actual and predicted grade of one grade step out of five (or even eleven) may not be of much con-sequence for the student. To model this relaxed evaluation, we use the definitions from above for FullA, PartA and NA predictions. However, we now count a prediction as correct if it is within one grade step of the gold category. We also apply the relaxed prediction matching to the reviewing recommendations: We now only review NA cases and those PartA cases where the predictions differ by more than one grade step (the majority predic-tion is accepted for the other PartA cases).
This relaxation is very relevant: 75% of PartA predictions for the ASAP (5) data and 72% for the Mohler (11) data differ within one grade step. For CSSAG (9), however, only four out of more than 800 PartA predictions are within one grade step of another. This pattern of results can be ex-plained by a tendency of the Decision Tree (DT) learner to predict the extreme categories. Since the Mohler and ASAP data are biased towards those categories, all the learners show this pattern and predictions match closely. CSSAG has a bias to-wards the middle category as well as the top that SVM and RF reflect better than DT. Therefore, they may cast votes that differ strongly from the DT vote.
The results of relaxed evaluation and review are very encouraging for practical application: For ASAP, error drops to 7% when reviewing just 25% of the data. This is at the human level observed for ASAP. Previously, reviewing all PartA predic-tions in strict evaluation, 11% of error remained and 38% of data were reviewed. For Mohler, 5% error remain after reviewing 38% of data (from 15% of error while reviewing 59% of data). For CSSAG, there is of course no change. This pat-tern of results makes the approach very promising for formative assessment, where testing is frequent (causing high grader workload) and the individual test result can still be informative even if it is ap-proximate.
7 Implications for Real-World Users
Our motivation for this work was to help human graders in language instruction (and elsewhere) save time and effort on manual grading of free text
answers. Our analysis shows that human effort can be reduced drastically by following our reliability-guided review strategy, while grading error stays at or even drops below the human level. However, there are a few points to consider for real-world graders as they choose the correct level of revision strictness for their testing context.
Human revision error We make the assump-tion that human review always determines the cor-rect category. This may seem optimistic given the human error rate of up to 15% in Section4, but it is hard to predict grader error more precisely for the general case. Our results in Section 4 show that grading error is lowest in a situation where graders have clear scoring rubrics and are (pre-sumably) carefully trained. Ad hoc grading by teachers shows the highest error rates. For this scenario, it can be hoped that, as the number of an-swers to review drops, grader alertness and moti-vation will rise, leading to cleaner annotation. We therefore report the assumed-to-be-perfect num-bers and leave it to each grader to discount them by the likely error rates incurred in their process.
overly generous: They tend to mis-label as 1, even though 0 is the most frequent class in the data (al-most twice as frequent as 1).The reason may be that many true 0 answers are simply empty or con-tain just a few (non-informative) words. The ma-chines therefore tend to over-generalise to the next more frequent category, 1, if an answer does not fit that pattern, even if it is still incorrect. There is an indication of this behaviour in the learner perfor-mance in Table 4: Precision for class 1 is much lower than for class 0, at similar recall. This in-dicates that class 1 predictions are more often un-reliable, and the machine is therefore being overly generous. Note, however, that this distortion af-fects only 11% of the data.
This error analysis suggests that we might im-prove the automated grader by training it only on non-empty incorrect answers, thereby remov-ing the bias towards distremov-inguishremov-ing between empty and non-empty rather than correct and incorrect. The empty answers would then be trivially la-belled as incorrect after filtering.
In general, since items to review are chosen on the basis of classifier grades, if the ensem-ble shares a bias towards a specific category, the grades of that category will be reviewed dispropor-tionally rarely. Fortunately, learner bias follows the frequency biases in the data, so that the bias categories are generally graded reliably, as mir-rored in the remaining error levels for our strategy. However, classifier bias and it’s tendency may still be relevant depending on the testing context, as we have seen.
Language lerner corpora In our experiments, language learner corpora generally fare better than content assessment corpora. The CREE and CREG corpora feature binary categories which were annotated reliably (κ= 0.64for CREE, only items with annotator agreement for CREG). While aκof0.64might not sound impressive, it gives an idea how hard the task of awarding the equivalent of “pass” or “fail” in these contexts are. This is the best-case scenario for the automated learners. In this situation, corpus size does not seem to matter as much as might be expected: The RF learner per-forms as well for CREE and CREG as it does for the binarised version of ASAP, which is roughly 16 times larger.
An additional factor in this scenario may be that CREE and CREG appear to be easier to machine-grade than many content-assessment
cor-pora (Pad´o,2016). Pad´o(2017) hypothesizes that this effect is due in part to the fact that the ma-jority of questions in language learner corpora are text comprehension questions, which require re-production and tend to produce answers that are very close to the reading text as well as the ref-erence answer taken from this text. Additionally, language learners’ limited proficiency may keep them from paraphrasing freely, which compounds the effect.
In sum, the language learner corpora we used for our experiments are very well suited to train reliable automated graders, and this is mirrored in the evaluation results: The machine ensemble pre-dictions (in full and partial agreement) were cor-rect at about the level of human performance (85% of labels correct) without any human review. This can optimally be raised to 91% correct categories when reviewing just 20% of the data. The remain-ing error (where the ensemble fully agrees on the wrong category) is at 9% of the data, which is the same level as human agreement on the wrong cat-egory for a subset of CSSAG.
This makes our strategy especially promising for free text grading in language instruction: On the one hand, the question type is frequent and grading therefore adds substantially to the teach-ers’ workloads; on the other hand, machine-supported manual grading yields grades that are definitely reliable enough for formative testing and possibly even summative testing (after the reserva-tions about possible distorreserva-tions in grade distribu-tion are considered).
many categories lead to unclear representations in humans as well, which in turn do not allow for clear models using machine learning. Fewer cat-egories are also easier to interpret, as the differ-ences of individual steps on a 10-point scale are less clear than differences for example on a 6-point scale.
In some NLP tasks, reducing the scale is not an option. Therefore, information about easily mod-elled categories could be used to focus the annota-tion effort on the harder categories to ensure con-sistent models.
8 Conclusions and Future Work
We have shown the practical usefulness of unop-timised automatic grading tools for reducing hu-man grading effort, based on seven different cor-pora and two different grading scenarios. For the binary grading scenario, where only correct vs. in-correct is distinguished, effort can be reduced by at least 75%. In more complex grading scenar-ios of assigning grades based on various levels of granularity, effort can be reduced by at least 40% – depending on the scale complexity. This reduction in effort retains an acceptable error rate, which is comparable to or even below human error rate. In the literature reviewed in Section2, a reduction in grading effort of of 60% is possible while the hu-man error levels.
Although our suggested strategy involves vari-ous evaluation steps, it is nevertheless technically simple to use for the human grader: Individual automatic graders have to be analysed with re-spect to their performance using Precision and Re-call in order to determine their biases. The au-tomatic grader predictions are then compared us-ing Inter-Annotator Agreement, which gives a de-tailed picture of the grading quality of individ-ual categories and items. This enables the human grader to focus the correction effort on the most important cases, ignoring automatic annotations that are most likely correct.
The cases to be revised can be chosen accord-ing to available gradaccord-ing time and required level of remaining error: First, only items that did not re-ceive an automatic grade have to be corrected. In the binary case this even means no manual effort at all, but this strategy also leaves the highest er-ror rate. Second, only items where the automatic graders are not unanimous and predict weakly per-forming categories are manually checked. This
re-sults in an error rate of 9-25% while reviewing 13% of the data for the binary scenario and 25-50% of the data for the multiclass scenario. The most detailed strategy involves reviewing all items that did not receive an unanimous vote. This re-sults in an error rate at or below human level, while reviewing 7-28% of the data for the binary sce-nario and 40-60% of the data for the multiclass scenario. Further reductions of effort and error are possible if evaluation is slightly relaxed in the multiclass case.
Our results match insights from the general ma-chine learning domain: a) Grader performance correlates to the number of training instances for a category. b) By using three flawed automated graders, we make use of the power of error in-dependence in the machine ensemble (Kuncheva, 2004).
Finally, based on our analysis we can give recommendations for Computer-Aided Language Learning (CALL), especially regarding the de-velopment of corpora, which serve as the basis of many approaches. In order to optimise ma-chine grading performance, first, the grading scale should not be too fine-grained, as rarely occurring categories are problematic even for humans. Sec-ond, the grading categories should be clearly de-fined. But thirdly, even relatively small-sized cor-pora are sufficient to create good models for auto-matic pre-grading if the first two points are true.
Our strategy seems especially promising for short answer grading in language instruction. On the one hand, the question type is frequent and grading therefore adds substantially to the teach-ers’ workloads; on the other hand, machine-supported manual grading in our experiments yields grades that are definitely reliable enough for formative testing at a fraction of the manual effort. Given the encouraging results of the present study, a logical future step to extend this work would be a user study with real-world human graders, since our work so far has been carried out only on existing corpora.
References
Sumit Basu, Chuck Jacobs, and Lucy Vanderwende. 2013. Powergrading: a clustering approach to am-plify human effort for short answer grading. Trans-actions of the Association for Computational Lin-guistics (TACL), 1:391–402.
Vanderwende. 2014. Divide and correct: Using clusters to grade short answers at scale. In Proceed-ings of L@S ’14,Atlanta, Georgia, 4–5 March 2014, pages 89–98.
Steven Burrows, Iryna Gurevych, and Benno Stein. 2015. The Eras and Trends of Automatic Short An-swer Grading. International Journal of Artificial In-telligence in Education, 25:60–117.
Jacob Cohen. 1960. A coefficient of agreement for nominal scales. Educational and Psychological Measurement, 20:37–46.
Myroslava Dzikovska, Rodney Nielsen, Chris Brew, Claudia Leacock, Danilo Giampiccolo, Luisa Ben-tivogli, Peter Clark, Ido Dagan, and Hoa Trang Dang. 2013. SemEval-2013 task 7: The joint stu-dent response analysis and 8th recognizing textual entailment challenge. InProceedings of SemEeval-2013, Atlanta, Georgia, 14–15 June 2013, pages 263–274.
Joseph L. Fleiss. 1971. Measuring nominal scale agreement among many raters. Psychological Bul-letin, 76(5):378–382.
Derrick Higgins, Chris Brew, Michael Heilman, Ra-mon Ziai, Lei Chen, Aoife Cahill, Michael Flor, Nitin Madnani, Joel R. Tetreault, Daniel Blanchard, Diane Napolitano, Chong Min Lee, and John Black-more. 2014. Is getting the right answer just about choosing the right words? The role of syntactically-informed features in short answer scoring. Com-puting Research Repository, Computation and Lan-guage.
Andrea Horbach and Alexis Palmer. 2016. Investigat-ing active learnInvestigat-ing for short-answer scorInvestigat-ing. In Pro-ceedings of BEA-11,San Diego, California, 16 June 2016, pages 301–311.
Andrea Horbach, Alexis Palmer, and Magdalena Wol-ska. 2014. Finding a tradeoff between accuracy and rater’s workload in grading clustered short answers. In Proceedings of LREC 2014,Reykjavik, Iceland, 26–31 May 2014, pages 588–595.
Andrea Horbach and Manfred Pinkal. 2018. Semi-Supervised Clustering for Short Answer Scoring. In Proceedings of LREC 2018,Miyazaki, Japan, 7–12 May 2018.
Ludmila I. Kuncheva. 2004. Combining Pattern Clas-sifiers – Methods and Algorithms. Wiley, Hoboken, NJ.
Nitin Madnani, Anastassia Loukina, and Aoife Cahill. 2016. A large scale quantitative exploration of mod-eling strategies for content scoring. In Proceed-ings of BEA-12,Copenhagen, Denmark, 8 Septem-ber 2017, pages 457–467.
Detmar Meurers, Ramon Ziai, Niels Ott, and Stacey Bailey. 2011a.Integrating parallel analysis modules
to evaluate the meaning of answers to reading com-prehension questions. Special Issue on Free-text Au-tomatic Evaluation. International Journal of Contin-uing Engineering Education and Life-Long Learn-ing (IJCEELL), 21(4):355–369.
Detmar Meurers, Ramon Ziai, Niels Ott, and Janina Kopp. 2011b. Evaluating answers to reading com-prehension questions in context: Results for german and the role of information structure. In Proceed-ings of the TextInfer 2011 Workshop on Textual En-tailment, pages 1–9, Edinburgh, Scottland, UK. As-sociation for Computational Linguistics.
Michael Mohler, Razvan Bunescu, and Rada Mihal-cea. 2011. Learning to grade short answer questions using semantic similarity measures and dependency graph alignments. In Proceedings of ACL-HLT 2011, Portland, Oregon 19–24 June 2011, pages 752–762.
Ulrike Pad´o. 2016. Get semantic with me! The use-fulness of different feature types for short-answer grading. InProceedings of COLING 2016,Osaka, Japan, 13–16 December 2016.
Ulrike Pad´o. 2017. Question difficulty – How to es-timate without norming, how to use for automated grading. In Proceedings of BEA-12, Copenhagen, Denmark, 8 September 2017.
Ulrike Pad´o and Cornelia Kiefer. 2015. Short answer grading: When sorting helps and when it doesn’t. In 4th NLP4CALL Workshop at Nodalida, pages 42– 50, Vilnius, Lithuania.
Helen Yannakoudakis and Ronan Cummins. 2015. Evaluating the performance of automated text scor-ing systems. In Proceedings of BEA-10, Denver, Colorado, 4 June 2015, pages 213–223.
Torsten Zesch, Michael Heilmann, and Aoife Cahill. 2015. Reducing annotation efforts in supervised short answer scoring. In Proceedings of BEA-10, Denver, Colorado, 4 June 2015, pages 124–132.