warwick.ac.uk/lib-publications
A Thesis Submitted for the Degree of PhD at the University of Warwick
Permanent WRAP URL:
http://wrap.warwick.ac.uk/106451
Copyright and reuse:
This thesis is made available online and is protected by original copyright. Please scroll down to view the document itself.
Please refer to the repository record for this item for information to help you to cite it. Our policy information is available from the repository home page.
A flexible low-cost quantitative phase imaging
microscopy system for label-free imaging of
multi-cellular biological samples
By
Chandrabhan Seniya
Thesis
Submitted to the University of Warwick
for the degree of
Doctor of Philosophy in Engineering
School of Engineering
TABLE
OF
CONTENTS
TABLE OF CONTENTS ... I
LIST OF FIGURES ... VI
LIST OF TABLES ... X
ACKNOWLEDGEMENTS ... XI
DECLARATION ... XII
LIST OF PUBLICATIONS ... XIII
LIST OF ABBREVIATIONS AND SYMBOLS USED ... XV
ABSTRACT ... XVIII
CHAPTER 1. INTRODUCTION... 1
1.1 Motivation ... 4
1.2 Aims and Objectives ... 5
1.3 Original contributions ... 6
1.4 Thesis direction ... 8
CHAPTER 2. PHASE IMAGING MICROSCOPY ... 10
2.1 Quantitative phase imaging ... 15
2.1.1 Digital holographic phase microscopy ... 16
2.1.2 QPI methods based on off-axis optics ... 16
2.1.3 QPI methods based on common-path optics ... 17
2.1.5 Phase shifting mechanism applied to PCM based QPI methods ... 19
2.2 Phase imaging optics for dynamic events ... 19
2.3 Optical coherence tomography ... 21
2.4 Phase shift interferometry in microscopy ... 21
2.4.1 Phase measurement techniques ... 22
2.4.2 Moving a reference mirror for phase stepping ... 24
2.5 Phase extraction techniques ... 25
2.5.1 Three-frame technique ... 25
2.5.2 Four-frame technique ... 26
2.5.3 Five-frame technique ... 26
2.5.4 Six plus one and other higher frame techniques ... 27
2.6 Summary ... 27
CHAPTER 3. PHASE SHIFT ALGORITHMS FOR PHASE MEASUREMENT
... 29
3.1 Phase shift induced by the biological cell and cellular organelles ... 30
3.2 Theoretical model for phase change by the biological structures ... 31
3.3 Assessment of phase shifting algorithms ... 34
3.3.1 Description of phase assessment models ... 34
3.3.2 Principle of phase unwrapping ... 36
3.4 Error sources in the phase measurement ... 36
3.4.1 Incorrect phase shift between interference frames ... 37
3.4.3 Error due to shot noise ... 37
3.4.4 Error due to intensity fluctuation ... 38
3.4.5 Error due to quantisation ... 39
3.4.6 Error due to additive white noise ... 39
3.5 Uncertainties in phase measurement ... 40
3.6 Summary ... 51
CHAPTER 4. OPTICAL DESIGN: LOW-COST QUANTITATIVE PHASE
IMAGING MICROSCOPE ... 52
4.1 Role of broadband illumination in QPI imaging ... 54
4.2 Spatial and temporal coherence of an illumination source ... 55
4.3 Magnification and resolution of the microscope ... 55
4.4 Calibration of phase stepper for precise phase shifting ... 57
4.5 Optical configurations of LQPIM system ... 59
4.5.1 Phase imaging microscope ... 60
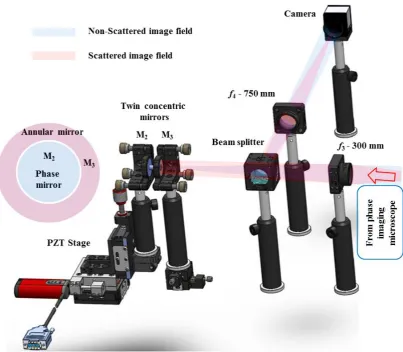
4.5.2 LQPIM system based on twin-machined concentric mirrors ... 61
4.5.3 LQPIM optics based on laser-cut apertures ... 65
4.6 Working principle of LQPIM system ... 66
4.7 Image acquisition and image processing... 71
4.8 Role of ‘halo effect’ in phase measurement ... 73
4.9 Summary ... 76
CHAPTER 5. RESULTS AND DISCUSSION ... 77
5.2 Phase imaging using LQPIM system based on laser-cut apertures: aperture
optimisation ... 80
5.3 Image processing ... 85
5.4 Assessment of spatial resolution from LQPIM system ... 88
5.5 Thickness measurement using LQPIM system ... 89
5.5.1 Uncertainties in the phase measurement ... 90
5.6 Implementation and assessment of PSAs in LQPIM system ... 93
5.6.1 Phase noise assessment under green LED illumination... 94
5.6.2 Phase and thickness measurement from the biological samples using LQPIM system ... 97
5.6.3 Phase noise assessment under green laser illumination ... 104
5.6.4 Phase measurement from the biological samples using green illumination from a laser ... 109
5.7 Summary ... 111
CHAPTER 6. CONCLUSIONS AND FUTURE WORK ... 113
6.1 An optimal solution for imaging label-free phase objects ... 113
6.2 A flexible LQPIM system for phase imaging ... 114
6.3 Phase imaging from label-free biological samples ... 115
6.4 Future work ... 115
APPENDIX ... 117
A.1 MATLAB code for the assessment of PSAs, bandwidth and wavelength of illumination source ... 117
L
IST OF FIGURES
Figure 2.1 Phase-contrast imaging of semi-transparent thin object ... 13
Figure 2.2 Optical train for phase contrast imaging ... 14
Figure 2.3 HeLa cells cultured on a glass coverslip imaged via a PCM ... 15
Figure 2.4 Fringe visibility inside an interference microscope ... 23
Figure 2.5 Schematic presentation of phase shift produced by a moving mirror; NDF (Neutral density filter), P1-P2 (Polarizer), M1-M2 (Mirror), BS (Beam splitter), OL (Output lens). ... 25
Figure 3.1 Phase distribution across the cell membrane ... 32
Figure 3.2 Phase distribution across the cell membrane, cytoplasm and the nucleus ... 32
Figure 3.3 Phase distribution across the cell contains all the organelles ... 33
Figure 3.4 Spectrum profile of green LED, centroid wavelength (519.9 nm), peak wavelength (514.20 nm), FWHM - 42.60 nm ... 41
Figure 3.5 Uncertainty in the phase measurement under green LED illumination using 6+1F@60° PSA. The phase error was considered in nm due to the fact of measuring large optical path difference from thick optical and biological samples. ... 42
Figure 3.6 Simulated interference of narrowband green light illumination from a LED ... 43
Figure 3.7 Uncertainty caused in phase measurement by warm white-light LED illumination using 6+1F@60° PSA. The phase error was considered in nm due to the fact of measuring large optical path difference from thick optical and biological samples. ... 44
Figure 3.8 Simulated interference of warm white-light LED illumination. ... 45
Figure 3.9 Theoretical phase noise using 6+1F@60°, bandwidth (FWHM, 1 - 42 nm), centre wavelength (450 - 650 nm). ... 48
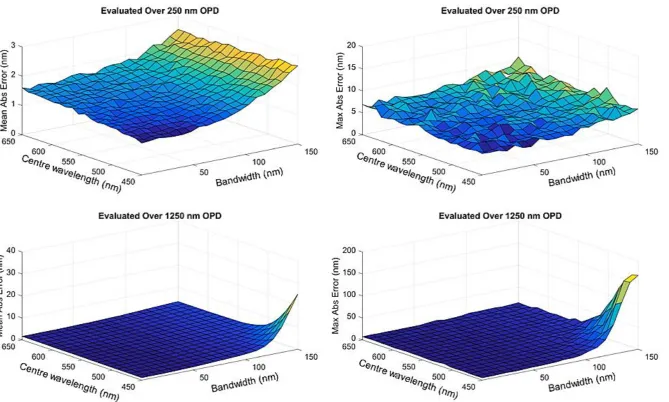
Figure 3.11 Theoretical phase noise using 6+1F@60°, bandwidth (1 - 250 nm), centre
wavelength (450 - 650 nm). ... 50
Figure 4.1 Aperture and image planes in Kohler illumination ... 54
Figure 4.2 Schematic presentation of LQPIM system based on LCAs, f2 - f4 (imaging and relay
lenses), M2 - M3 (mirrors with apertures in place) and BS (50/50 Beam splitter) ... 56
Figure 4.3 Schematic optics for the phase shifter calibration. NDF (Neutral density filter), Obj
(Objective lens), P (Pinhole), CL (Collimating lens), BS (Beam splitter), M1-M2 (Mirror), OL
(Output lens), PZT drive applied to mirror M2 ... 58
Figure 4.4 Processed phase-shifted images to check the accuracy of PSM ... 58
Figure 4.5 Histogram of phase-shifted interference images due to misalignment and
mechanical vibrations ... 59
Figure 4.6 CX-SLC Condenser lens (Olympus Ltd.) ... 60
Figure 4.7 Phase imaging microscopy module ... 61
Figure 4.8 Schematic of common-path LQPIM system using twin concentric mirrors, M1-M3
(mirrors), BS (Beam splitter) ... 62
Figure 4.9 Conjugated annular ring (white) and phase plate (grey circle) at the Fourier
plane ... 62
Figure 4.10 PSM based on twin concentric mirrors. M2-M3 (Mirrors) and f3-f4 (focal length of
relay lenses). ... 63
Figure 4.11 3D view of LQPIM system based on the twin-machined concentric mirrors in
back focal plane. ... 64
Figure 4.12 Ray optics of LQPIM system implemented with LCAs in PSM, M2 - M3 (Mirrors
with respective LCA apertures) ... 66
Figure 4.13 3D view of LQPIM system based on laser-cut aperture masks. ... 68
Figure 4.14 Quantitative phase image of epidermis cells of Allium cepa using 6+F@60°PSA
Figure 4.15 Front panel view of an in-house LabVIEW program ... 72
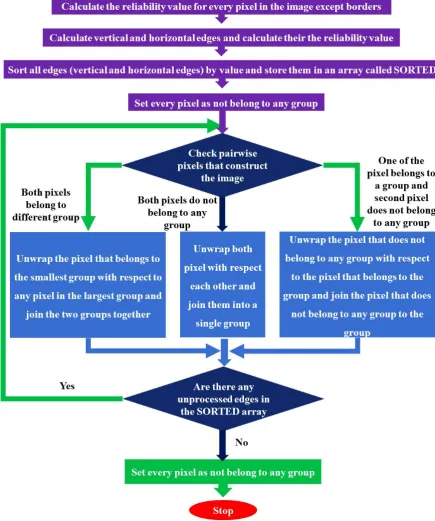
Figure 4.16 Flow chart of phase unwrapping process ... 73
Figure 4.17 Halo artefact image from a phase contrast microscopy ... 74
Figure 4.18 Light waves passing through a specimen ... 75
Figure 4.19 ‘Halo effect’ on phase resolution by QPI microscopy as a function of intensity ratios ... 76
Figure 5.1 Structural features in Pinus leaf (a) – Bright field image, and (b) – Contrast enhanced image ... 78
Figure 5.2 QPI data obtained using a Zernike-type LQPIM system based on twin concentric mirrors PSM from Pinus leaf ... 79
Figure 5.3 Left side - (a)-(b) Initial measured phase plate and annular rings, (c)-(d) Optimised masks to block the non-scattered and scattered light fields, respectively. ... 83
Figure 5.4 Phase image of epidermis cells of Allium cepa ... 85
Figure 5.5 Histogram of phase map shown in Figure 5.4 ... 86
Figure 5.6 Phase map of Allium cepa cells with not a number (NaN) values highlighted in black doted circles ... 87
Figure 5.7 Fixed phase map of Allium cepa cells values highlighted in black doted circles 87 Figure 5.8 NBS 1963A Test chart with 36 Cycle/mm Marker ... 88
Figure 5.9 Phase profile of thick glass bead against pixel number on the CCD camera ... 90
Figure 5.10 Theoretical and measured phase profile from the glass beads ... 91
Figure 5.11 2D and 3D phase map of glass bead (31.476 µm, diameter) ... 93
Figure 5.12 Phase resolution for column 1077 and 1230 under green LED illumination ... 95
Figure 5.14 2D reconstructed phase map of NBS 1963A Test chart using various PSAs under
green LED illumination, x and y axis represents pixel numbers in all images ... 97
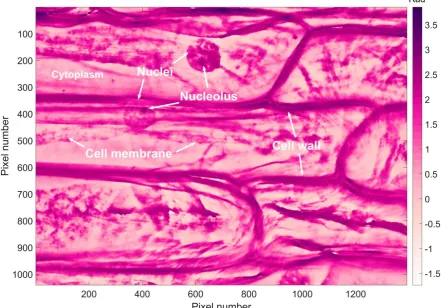
Figure 5.15 Quantitative phase map of epidermis cells of Allium cepa rendered using
6+1F@60° PSA ... 98
Figure 5.16 Phase map of epidermis cells of Allium cepa reconstructed using various PSAs
under green LED illumination, x and y axis represents pixel numbers in all images ... 99
Figure 5.17 Phase map of epidermis cells of Allium cepa containing spatially fine structure
using 6+1F@60° PSA. #1, #2, #3 and #4 area will be presented in Figure 5.18 and Figure 5.19
for further analysis. ... 100
Figure 5.18 Cross-section phase profile of the nucleus #1 area in Figure 5.17 ... 101
Figure 5.19 Cross-section profile of #2, #3 and #4 area outlined in Figure 5.17 ... 102
Figure 5.20 Quantitative phase map of epidermal cells and a cross-section of the nucleus 103
Figure 5.21Measured cell wall of Allium cepa ... 103
Figure 5.22 Representative laser illumination module implemented in LQPIM optics ... 105
Figure 5.23 Effect of laser speckle noise in the image field of resolution test chart; (a) Static
diffuser and (b) Rotating diffuser ... 106
Figure 5.24 Phase assessment of NBS 1963A Test chart under green laser illumination ... 107
Figure 5.25 Phase resolution assessment in column 1077 under green laser illumination .. 108
Figure 5.26 Reconstructed 2D phase maps of NBS 1963A Test chart under green laser
illumination. ... 109
Figure 5.27 2D reconstructed phase maps of onion cells under green laser illumination. .. 110
Figure 5.28 Phase map of epidermis cells of Allium cepa under green laser illumination . 111
Figure 6.1 Piezo actuator based mirror module, left side - side view and right side - top view.
L
IST OF TABLES
Table 3.1 Theoretical performance of PSAs (centre wavelength - 520 nm, bandwidth - 1
nm) ... 46
Table 3.2 Theoretical performance of PSAs (centre wavelength - 520 nm, bandwidth - 42 nm)
... 46
Table 3.3 Theoretical performance of PSAs (centre wavelength - 520 nm, bandwidth - 250
nm) ... 47
Table 4.1 Optical components used in the design of the bench-top optics of LQPIM
system ... 53
Table 5.1 Aperture size evaluation for high visibility and modulation depth ... 84
Table 5.2 Performance of PSAs under green LED illumination (λ - 530 nm, FWHM -42
nm) ... 94
Table 5.3 Performance of PSAs in the presence of green laser illumination (λ – 532 nm) . 107
A
CKNOWLEDGEMENTS
I would like to express profound gratitude and sincere thanks to my supervisor Professor
David Towers for his invaluable support, encouragement, belief, inspirational guidance, and
instilling skills over the past four years in the optical microscopy, live cell imaging, and
mathematical modelling. His moral support and fruitful guidance enabled me to complete my
research work successfully in time.
Besides my supervisor, I would like to thank the Madhya Pradesh State, Govt. of India for
providing partial funding including maintenance allowances and full tuition fees to the
University of Warwick, United Kingdom for doctoral research work. I also thank the School
of Engineering at the University of Warwick for the partial supporting maintenance
allowances in the UK.
My immense gratitude is extended to Dr. Jiang Shihong, (Research Fellow) for helping in
MATLAB and LabVIEW programme codes. The critiques provided by Dr Shihong helped
me to design the optical experiments and increased my level of understanding of optical
instrumentation. I benefited a great deal from discussions with Dr. Christian Kroner (Research
Fellow). His inspirational attitude helped me to stay positive and enthusiastic for the project.
Finally, I would like to thank my wife and my son, the two most beautiful and valuable
persons, for giving all necessary support and time to carry research work.
I would like to dedicate this research work to the memory of my father.
D
ECLARATION
The candidate confirms that the work embodied in this thesis is his own and that proper credit
has been given to the works that were taken advantage during this piece of research work. I,
CHANDRABHAN SENIYA, hereby declare that I have produced this thesis without the
prohibited help of third parties and without making use of aids other than those specified and
the notions taken directly or indirectly from other sources have been given proper credit.
This thesis has not previously been presented in a similar or identical form to any other
University for the award of Doctor of Philosophy. The research work embodied in this thesis
was conducted from January 2014 to October 2017 in the Optical Engineering and Imaging
Laboratory under the supervision of Prof David Towers, Head of School, School of
L
IST OF PUBLICATIONS
Papers/Conference proceedings published
1. C.Seniya, C.E. Towers, D.P. Towers, A flexible low-cost quantitative phase imaging microscopy for label-free imaging of biological samples using aperture masks, Optics
Express. (Manuscript submitted)
2. C. Seniya, C.E. Towers, D.P. Towers, Improvements in low-cost label-free QPI microscope for live cell imaging, Proc. SPIE 10414, Advances in Microscopic
Imaging. 104140F (July 28, 2017).
3. C. Seniya, C.E. Towers, D.P. Towers, [LS5.2009] Developments in low-cost label-free live cell imaging for biological samples, In MMC2017, Manchester 3-6th July
2017.
4. C. Seniya, C.E. Towers, D.P. Towers, Low-cost label-free live cell imaging for biological samples, in Quantitative Phase Imaging III. Gabriel Popescu; YongKeun
Park, Editors, Proceedings of SPIE Vol. 10074 (SPIE, Bellingham, WA 2017),
100741I.
5. C.Seniya, C.E. Towers, D.P. Towers, Phase shift interference microscopy for label-free live cell imaging of biological samples, 4th Annual School of Engineering
Symposium. University of Warwick, pp. 85-86, 22nd April 2016.
Posters Presented
1. C. Seniya, D.P. Towers, Low-cost Quantitative Phase Microscope for live cells imaging, in Warwick Medical Imaging Network meeting. University of Warwick, 28th
April 2017. [Best poster prize for early career researchers (£250)].
2. C. Seniya, D.P. Towers, Cost-effective method for label-free live cell imaging of biological sample, in Research Poster Competition 2016 (Research Student Skills
Note: The poster was selected to display in the Research Exchange (Library) during the summer period.
3. C.Seniya, D.P. Towers, Generate and evaluate tools to quantify cell: cell contacts in live cell imaging of label-free biological samples, Annual Postgraduate Symposium
L
IST OF ABBREVIATIONS AND
SYMBOLS USED
Abbreviation/symbol Full form/ meaning
BW Bandwidth
CCD Charged-coupled device
CL Coherence length
CPI Common-path interferometry
CW Centre wavelength
DHM Digital holography microscopy
DPM Dynamic phase microscope
DIC Differential interference contrast
DIM Dynamic interference microscopy
FOV Field of view
FPM Fourier phase microscopy
FWHM Full width half maximum
GFP Green fluorescent protein
ID Inner diameter
LCA Laser-cut aperture
LED Light emitting diode
LQPIM Low-cost quantitative phase imaging microscope
MoM Magnification of microscope
ms Milliseconds
NA Numerical aperture
nm Nanometer
OCT Optical coherence tomography
OD Outer diameter
OPD Optical path difference
OPL Optical path length
PCM Phase contrast microscopy
PIM Phase imaging microscope
PSI Phase shift interferometry
PSM Phase shifting module
PZT Piezoelectric transducer
QPI Quantitative phase imaging
R Resolution of microscope
SLIM Spatial light interference microscopy
SLM Spatial light modulator
Std Dev Standard deviation
WDT White-light diffraction tomography
WLI White light illumination
wDPM White-light diffraction phase microscopy
2D Two dimensions
3D Three dimensions
4D Four dimensions
3F@90° Three frames at 90°
3F@120° Three frames at 120°
4F@90° Four frames at 90°
5F@90 Fiver frames at 90°
7F@90° Seven frames at 90°
6+1F@60° Six plus one frame at 60°
h(x, y) Height at point (x,y)
I(x, y) Intensity of the image field at point (x,y)
Idc Non-scattered image light field
Iac Scattered image light field
k(x, y) Fringe order
Δφ(x, y) Phase change at point (x,y)
t(x, y) Thickness at point (x,y)
α Mean phase shift or step angle
γ Signal modulation
δ Standard deviation (Std Dev)
σφ Phase noise
φns Phase from background field
φs Phase from scattered field
nair Refractive index of air
no Refractive index of object
nm Nano-meter (10-9)
µm Micrometre (10-6)
λ Wavelength of illumination source
Δλ Spectral width
A
BSTRACT
In this thesis, a flexible low-cost quantitative phase imaging microscopy (LQPIM) system for
imaging both thin and thick biological phase objects in a non-contact, non-invasive, and
label-free manner is reported. LQPIM optics was developed based on classical Zernike’s phase
contrast approach and an additional phase shifting module to introduce user-defined phase
modulations by utilising standard optical components. The phase shifting was performed
using twin concentric mirrors or laser cut apertures in the arms of a Michelson interferometer
where the reference mirror can be moved in /n steps (n - number of steps) with a piezoelectric transducer. Hence, the optical phase shifting modules are 10 - 15%
(approximately) of the cost compared to the more widely reported modules based on spatial
light modulator. In the microscope implementation reported in this thesis, a total
magnification of 25x was achieved utilising relay lenses in LQPIM optics together with a
standard 10x objective lens. The imaging system was simulated in MATLAB, where
two-beam interference equation with varying bandwidth (1 – 250 nm), centre wavelength (450 –
650 nm) of the illumination sources and a range of previously reported phase shift algorithms
(PSA) were used. The simulation results confirm that the optimum phase resolution is
achievable if a broadband source of bandwidth 30 - 50 nm is used for illuminating thin (i.e. ≤
250 nm) and thick (i.e. ≥ 1250 nm) biological samples. The four frames at 90 PSA and six
plus one frames at 60 PSA offer different compromises between image acquisition time,
phase resolution and out-perform other PSAs. A phase resolution of 0.382 nm and 0.317 nm
was achieved using four frames at 90 and six plus one frames at 60 PSAs, respectively for
the broadband illumination from a green LED. A coherent, single longitudinal mode laser
source with a rotating diffuser for speckle averaging, gave 0.667 nm and 0.512 nm phase
resolution using the same algorithms mentioned above. The parasitic fringes resulted in
reduced resolution; hence, incoherent LED illumination was preferred. Measurements are
presented over a longer optical path difference (≥ 1250 nm) than hitherto reported for a similar
microscope. The given exemplar data demonstrates an ability of LQPIM system to quantify
cellular and sub-cellular structures at the nanoscale in epidermis cells of Allium cepa.
Chapter 1.
I
NTRODUCTION
To understand cellular physiology (cell cycle and cellular growth) and cellular mechanics or
dynamics (protein transport and migration) are very important in the field of cell biology and
biomedicine, especially without perturbing their natural activity. Furthermore, the cellular
phenomenon is very complex and challenging in the context of microscopy imaging due to
the fast migration of fine spatial objects, varying cell to cell contacts and changing structural
organisation, hence, several highly sensitive spatial and temporal measurements can be
associated for large-scale measurements. The time-scale ranging from milliseconds to hours
to measure from sub- scale to millimetre scale are very important to address the cellular and
subcellular structural dynamics.
There is an unresolved need in biological science to understand homoeostasis in live cell
imaging experiments and precisely the role of a cell to cell contact that is believed to inhibit
mitosis and potentially other growth mechanisms. In contrast, when cell to cell contact is not
present, e.g. when a tissue has wounded, the edges of the wound generate cells with free
surfaces, and repair mechanisms are needed to create cells to repair the wound. This leads to
a controversial philosophy that the local environment of cells, which determine the phenotype
of the cells, drives homoeostasis rather than a stem cell needed as an initiator for the
regeneration mechanism. Investigating these phenomena needs advanced microscopy
techniques to quantify the interaction between cells in live cell imaging experiments where
homeostasis can be maintained for an extended periods to observe cells over the long duration
(i.e. hours to days). This requirement limits the available techniques away from the prevalent
use of fluorescence as the mainstay of generating contrast. Furthermore, an introduction of,
cell imaging experiments play a vital role in addressing many issues, for example to
understand complex biological process in the cell, drug development studies, cancer-related
studies, morphological variations, cell to cell contacts, structural organisation of cellular and
subcellular organelles and tissues. The imaging experiments can also give an insight into
cellular functionality, mortality, biomechanical properties, effect of toxins and drugs on cells.
An ideal microscopy method should be non-invasive, non-contact, and able to render both
qualitative and quantitative information without altering the inherent properties of the living
specimen.
The epi-fluorescence microscopy methods have been readily applied to study cellular and
subcellular live events at the molecular level [1]. The observation of cellular structures, for
example mitochondria, cell membrane, nucleus, cytoskeleton proteins and vesicles in 3D with
a resolution down to scales [2] have been possible using flourescent labelling agents.
However, these observations may have limitations due to high cost of molecule specific
fluorophore agents, modification of natural bio-activity, photo-toxicity to healthy cells and
photo-bleaching [3], [4]. The discovery of green fluorescent protein (GFP) has revolutionised
measurements on live cells using epi-fluorescence microscope, where test cells are expected
to express GFP genetically [5], [6]. Furthermore, the prolonged exposure with high-intensity
illumination is required to visualise such genetically modified cellular moieties with tagged
auto fluorescence dyes. In this case, only a low temporal resolution and low quantum
efficiency can be achieved, and the prolonged exposure can cause phototoxicity to healthy
cells and alteration of natural events. Therefore, the label-free, non-invasive, non-contact, and
non-cell altering methods can be a better choice to understand the cellular and sub-cellular
events natively.
Practically, all the biological cells are transparent in nature and hard to image with most
straightforward label-free imaging techniques, for example bright field microscopy, because
they generate minute changes in the amplitude of light whilst altering the phase significantly
[7]. Therefore, to examine such phase objects an optical development in contrast-enhancing
imaging techniques, such as phase contrast microscopy (PCM) [8] and Differential
Interference Contrast (DIC) [9] have been developed. These modalities can provide an
enhanced contrast at an expense of additional optical components, light source and critical
alignment procedures. The information retrieved was only qualitative. Hence, none of the
method with labels or without labels (conventional phase contrast) are able to render
The imaging technologies developed in the mid-20th century and innovations in optical
instrumentation have become very attractive to biomedical scientists. The advancements have
fashioned a movement toward imaging at cellular and sub-cellular levels in a label-free
manner for the deeper understanding of the biological events. A variety of optical methods
have been developed to image both labelled and non-labelled samples to study cell
morphology and functionality both qualitatively and quantitatively [10], for example to
identify and track spatially distributed bio-molecules in a cellular medium as they function in
their native background [11]. To avoid any type of modification in natural behaviour and harm
to healthy cells, researchers have tried several label-free methods in past as well as in the
recent years, for example optical coherence tomography [12], DIC microscopy [13], Fourier
phase microscopy [14], diffraction phase microscopy [15] and modified versions of PCM, for
example quantitative phase imaging (QPI) [16], [17].
The optical imaging methods yield not only morphological changes such as shape and size
but also renders quantitative information of cellular structural gears, molecular details of
cellular interactions and information about growth as well as death of the cells. The ability to
monitor biological events in real-time at the cellular and sub-cellular level has widened
understanding of many physiological processes inside the cell including translocation of
cellular organelles, protein trafficking, protein-protein interactions and DNA-protein
interactions [18]. Optical imaging microscopy relies on the introduction of contrast between
transparent biological objects and their surrounding media, tissues, or cellular structures. The
label-based cellular assays can help in identifying morphological variation and alterations
inside a cell after phenotypic screening [19]. Furthermore, the phenotypic changes induced by
an imaging experiment can be avoided by using non-invasive high throughput techniques. The
label-free, multi-focus imaging methods can essentially work on differences in the optical path
lengths to enhance image contrast for the qualitative analysis of desired information. An
interferometry based techniques such as DIC [20] or digital holography do not readily provide
quantitative information on the specimen-induced phase shifts [21]. Furthermore, their
inherent contrast mechanism and related image artefacts make automated cell segmentation
very difficult and hardly robust [22]. Unfortunately, these methods suffer from well-known
halo artefacts at cell edges, which can compromise the success rate of downstream image
1.1
Motivation
It has been reported that the cell segmentation process is complicated and non-robust for
various forms of qualitative phase microscopy, however, for example the cells from a
ptychography imaging system have been well segmented [23]. In practice, these images are
mostly used to cell segmentation assays and potential data source for the direct analysis.
Although, the interference-based microscopy has tremendous advantages, however,
qualitatively it is still affected by the optical low contrast and noise associated with the
instrument. These effects can be removed to a certain extent by employing post-processing
methods.
Common path interferometry (CPI) is a well-known universal tool for extracting and
quantifying phase distributions from the optically transparent objects [24], [25]. The
researchers have, recently, combined PCM with QPI to develop an optimal solution to study
the cellular dynamics of weakly scattering and absorbing biological specimen [16], [26]–[28].
The cellular functions of spatially fine sutures can be quantified at scale or even at sub- scale
by detecting the optical path length change induced by the cellular structures [29], [30]. QPI
based methods have been applied to measure red blood cells dynamics [31], [32], average
tissue refractive index [33]–[36], cell dry mass [36]–[38] and statistical parameters [39]. QPI
methods based on common-path optics have shown superior stability in phase measurement
over long time periods [15]. However, the operational field of view and/or accuracy are
limited in some QPI methods because they are constrained to the assumption of a plane
reference wave [14], [15].
A good phase resolution can be achieved in diffraction phase microscopy (DPM), but the
speckle noise generated by high coherence illumination (i.e. laser source) has limited the
achievable resolution [15]. A common-path optical system, known as spatial light interference
microscopy (SLIM) was reported in 2011, by employing a broadband illumination source and
a SLM for phase filtering [26]. The merit of the method arises from the use of broadband
illumination to largely eliminate the coherent noise, but the approach introduces a need for
expensive and specialised components, for example, the spatial light modulator (SLM), phase
contrast illumination and a dedicated objective lens in combination with a high-speed camera.
Dynamics behaviour monitoring at 12.5 frames per second has been made possible, but, with
Phase shift interferometry (PSI) based method can be a robust methodology to extract and
quantify the phase change induced by objects in sample under examination. It has an
advantage of automatic phase determination over the image field. It also gives independent
phase values for each pixel in the image. PSI methods have been applied in holographic
interferometry [21], [41], quantitative phase microscopy [16], [29], [30], [42], [43] and
interference based microscopy methods [21], [42]. These methods are expensive to be utilised
in a biological laboratory. Therefore, there is a need to develop robust, flexible and cheaper
techniques that can be easily accommodated into the scientific community. Furthermore,
using the methods reported above, quantitative phase measurments have been obtained up to
20 µm into a cell culture grown on a coverslip and of optical path differences up to ≈ 240 nm,
which is representative of a single layer of cells. Therefore, there is a need to develop new
imaging methods that can image thick biological specimens, for example multi-layer or 3D
cell cultures.
Researchers have also employed different illumination sources from narrowband to broadband
wavelengths in interferometric configurations in order to resolve the fringe order ambiguity
in the wrapped phases resulting from PSI [44], [45]. For example a fibre optic pressure sensor
has been developed in the interferometric mode to measure the displacement of a diaphragm
due to a pressure differential between an internal cavity and that externally [46]. In this case,
multiple narrowband laser wavelengths were used where the multi-wavelengths allows the
fringe order information to be calculated and the single mode fibre helps produce low noise
interferometric signals at each wavelength [47]. The result is a sensor with high temporal
bandwidth and the ability to operate over a broad range of optical path differences.
1.2
Aims and Objectives
The overall aim of this PhD research work was to develop a flexible, low-cost quantitative
phase imaging microscopy technique for label-free live cell imaging and quantification of the
cell to cell interactions as such processes are of fundamental importance in cell biology and
cancer related studies. The objectives to reach this aim are listed below.
i. To develop theoretical models for phase measuring microscopy and light interaction
with cells.
ii. To construct a practical phase measuring microscope, that can offer new capabilities
iii. To demonstrate the efficiency of developed microscope by utilising optical and
biological specimens as a proof of concept.
1.3
Original contributions
From the literature, neither optical imaging with labels nor conventional phase contrast
imaging with PSI are able to render quantitative information from thick cell cultures, (i.e.
multilayer or 3D cell cultures). Therefore, to study complex multilayer cell-to-cell interactions
or the action of signalling molecules that directs a cell’s fate and biological process a suitable
microscopic method and quantitative analysis are needed. The following specific aspects have
been developed in this thesis.
To find optimal solutions for quantifying transparent thick biological specimens using theoretical models. A relationship between the wavelength (λ), bandwidth (FWHM) of the illumination source and a suitable PSA that can be of great importance
to render an optimal phase imaging solution has been addressed. This relationship
plays a critical role in the phase resolution and measurement range of the microscope
and has not been reported, previously. The mathematical models utilised are based on
the two-beam interference equation and their performance are evaluated in terms of
the phase resolution obtained (the effect of more complex models is considered within
the thesis, see Chapter 4, Section 4.8). The mathematical simulations are able to show
that on an average the six plus one frame at 60° PSA performed well compared to
other PSAs [25], [48], especially in the case of thick samples (≥ 1250 nm).
Furthermore, PSAs with low number frames have an advantage of more rapidly
producing good phase maps from thin samples (≤ 250 nm), but, have failed to
reconstruct phase map from thick samples (≥ 1250 nm). The simulation results also
confirm that the phase measurement accuracy can be strongly dependent on the
selected PSA, an optical path difference, bandwidth and wavelength of the
illumination source. The obtained results have informed the design of a microscope
for quantitative phase imaging from both thin and thick optical samples.
Construction of a flexible LQPIM system to offer new capabilities regarding phase measurement from thick biological samples. The LQPIM optical system has been developed using standard optical components. The optical imaging method has
combines Zernike’s PCM approach and a phase shifting module (PSM) to enable
phase modulation between the scattered and non-scattered optical image fields. In both
setups, the phase shift is simple to control via a piezoelectric (PZT) driven high
precision linear stage holding a reference mirror in the back focal plane of LQPIM
system. In practice, most commercial condensers position the illumination annulus at
an intermediate numerical aperture. The use of a mirror system with twin concentric
mirrors will limit the NA of the system due to leakage of light in the space between
concentric mirrors and hence worsen the lateral resolution. This approach has an
advantage of common path interferometric optics, simple in design with less optical
components and most importantly, the twin-machined concentric mirrors are
significantly cheaper than the specialised components, e.g. an SLM used in other
quantitative phase measuring microscopes.
To overcome the difficulty associated with bench-top LQPIM optics based on twin
machined concentric mirrors a second approach was also developed by placing LCAs
in the arms of a Michelson interferometer based PSM. The optimised LCAs, efficiently
separates, reshapes and minimises the cross-talk between the scattered and
non-scattered image light fields at the Fourier plane and hence, renders a high contrast
interference image at CCD camera. In this case, good phase resolution was acheived
by mimicking the precise physical size of the annular ring and the phase plate available
in condenser and objective lens of a commercial PCM. The PSM available in both
LQPIM optical approaches provide a flexibility to implement any number and
magnitude of phase steps and hence, the phase map of the objects can be reconstructed
efficiently using any PSA reported in the literature.
Assessment of LQPIM system by utilising optical and biological samples as a proof of concept. The PSAs simulated and evaluated for making phase measurements from thin and thick optical samples are demonstrated experimentally using LQPIM
system. Based on the captured number of phase-shifted interference intensity frames
at CCD camera, 2D and 3D phase maps of an NBS 1963A Test chart were obtained as
well as from epidermis cells of Allium cepa. The phase maps enable the microscope
performance to be evaluated in term of the spatial resolution and noise in phase
measurement. The assessment was done under broadband green light illumination
from a light emitting diode (LED) and a narrowband laser. Interestingly, an LED
(≤ 8 nm), broadband (FWHM - 42 nm) and speckle noise free illumination compared
to a narrowband laser illumination (i.e. 0.521 nm). The comparative assessment of
phase noise and phase resolution by various PSAs was also performed and an example
data from the biological samples are reported.
1.4
Thesis direction
The thesis has been structured in six Chapters (1-6). Chapter 1 gives brief information on
contrast generation using fluorescent labels in microscopy sample preparation to study
structural organisation inside biological cells and their potential benefits and drawbacks. It
also explains (in brief) imaging cells without stains, i.e. label-free imaging to see the same
structural features without perturbations in the cellular environment. A motivation and the
original contributions in phase imaging microscopy were presented.
An introduction to phase imaging microscopy methods is presented in Chapter 2. The
advancement in the optics, camera sensor technology, and measurement techniques are
described leading to the development and implementation of phase imaging methods. The
phase images provide valuable insight about transparent cellular and subcellular dynamics of
the live cells. The optical path difference encoded in the phase images can be retrieved using
PSAs to address the requirements for quantitative data from biological specimens.
Furthermore, the limitations associated with each imaging method were also outlined in their
respective section description. The chapter also gives an information about the principle used
in phase shift interferometry to encode and retrieve phase experimentally.
In Chapter 3, an impact of biological objects on the illuminating wavefront is presented. To
show the impact mathematical models are developed and a description of models is presented.
An optimal solution for imaging optically thin (≤ 250 nm) and thick (≥ 1250 nm) cellular and
sub-cellular biological structures of interest is also discussed. The simulations were performed
to identify the best solutions for imaging phase objects as a function of bandwidth (1 - 250
nm), central wavelength (450 - 650 nm) and a suitable PSA. Chapter 3 also presents an
optimum PSA for imaging both optically thin for example a monolayer of cells and thick
biological samples, for example multilayer of cells such as 3D cell colonies.
In Chapter 4, the working principle behind the flexible LQPIM system and its implementation
using standard and low-cost optical components are described. The system is capable of
biological samples. Using the LQPIM optics, phase-shifted interference intensity images, as
needed by a PSA, were captured to produce wrapped and then unwrapped phase distributions
from objects in the sample to confirm the expected performance predicted from the simulation
experiments (Chapter 3). Two LQPIM optical system are described for imaging phase objects.
In both cases, a custom inverted microscope was coupled with a PSM to encode a predefined
sequence of phase steps into the non-scattered image field with respect to scattered image field
before rendering an interference image at CCD camera. The first LQPIM optical approach
was developed based on twin concentric mirrors in a common path arrangement (Section
4.5.2) and the second module uses a non-common path optics by employing laser-cut apertures
in the PSM to mimic the phase plate and annular ring inside a phase imaging microscope
(Section 5.2). LCAs applied in the arms of a Michelson interferometer produces good contrast
interference intensity image by minimising the cross-talk between the scattered and
non-scattered image light fields in the Fourier plane. Thus, there is an opportunity to deliver mostly ‘halo artefact’ free images [49].
In Chapter 5, the optimisation of physical size of the LCAs to mask precisely the phase plate
and annular ring is outlined. The assessment of LQPIM system to measure the phase and
render quantitative phase maps from optical samples, for example the NBS 1963A Test chart,
glass beads and epidermis cells of Allium cepa will also be presented. The phase resolution
will be quantified and the ability to measure large optical path differences is presented by
means of measuring glass beads (diameter, 10 - 30 µm). The assessment of LQPIM system
was performed under broadband green LED (FWHM – 42 nm), a very broadband LED
(FWHM – 250 nm) and a narrowband (FWHM – 1 nm), for example a green laser source.
In the concluding Chapter 6, the contributions linked with developed flexible LQPIM system
are presented in the context of existing QPI methods. Future research prospects and discussion
of future research is outlined. Since, the LQPIM is a flexible system, it can be potentially
transformative with multiple opportunities for users in the field of cell biology and biomedical
Chapter 2.
P
HASE IMAGING
MICROSCOPY
The developments in light microscopy optics over the last 75 years have revolutionised the
understanding of cellular and subcellular structural organisation of tissues and cells.
Dark-field microscopy was the only method used for many years to visualise transparent biological
objects by generating contrast a. The extraction of the structural features and cellular dynamics
from unaltered live biological samples was very challenging before the introduction of PCM
by Zernike in 1935. Furthermore, a holography microscopy method [50] was proposed based
on phase altering information exploited by Zernike. The ideas of phase and amplitude allowed
researchers to image thin transparent biological objects precisely to elucidate cellular and
sub-cellular structural dynamics qualitatively. However, methods that are more robust are needed
to record fast moving cellular and sub-cellular events and processes in real-time for
quantitative analysis.
In 1955, Francis Smith introduced DIC microscopy a label-free imaging method for
examining transparent biological specimens [51]. The technique was further refined by
George Nomarski to produce aberration-free high-resolution phase images by converting
phase variations into contrast through the principle of interferometry [13], [52]. The label-free
imaging methods have been developed in past years to image biological structures that do not
a https://www.microscopyu.com/techniques/phase-contrast/introduction-to-phase-contrast-microscopy.
absorb illuminating light significantly, hence, remain transparent under ordinary microscope,
for example bright field microscopy. The imaging methods have been improved in their
optical setups to image transparent biological samples with more contrast by altering the
intensity of the illumination light beyond that which occurs due to absorption. The cellular
and sub-cellular structures can be considered as phase objects that primarily alters the phase
of the illuminating wavefront. When illumination light is projected onto a biological specimen
refraction, diffraction and scattering occur due to the spatial variations in thickness and
refractive index between the surrounding fluid and the cellular and sub-cellular structures [52].
The spatial variations can advance or retard the phase of the illuminating light passing through
them.
Phase altering objects can be imaged with specialised optics by converting phase variations into intensity variations, for example as in the case of PCM. The phase change [Δ𝜑(𝑥, 𝑦)] by
cellular structures can be characterised by a phase function which is directly proportional to
the optical path length difference (𝑂𝑃𝐷) or the optical thickness of the objects in the specimen. The 𝑂𝑃𝐷 function depends on the spatial variation in refractive index across the objects [𝑛𝑜(𝑥, 𝑦, 𝑧)] in the sample with respect to the background [𝑛𝑏(𝑥, 𝑦, 𝑧)] and variable thickness 𝑡(𝑥, 𝑦) along the optical axis as per Eq. (2.1) and Eq. (2.2).
2
( , )x y OPD x y( , )
(2.1)
( , ) 0
( , ) ( , , ) ( , , ) 2
t x y
o b
OPD x y n x y z n x y z dz
(2.2)where Δ𝜑(𝑥, 𝑦) is the phase change and λ is the wavelength of an illumination source. The
spatial variations in refractive index, thickness across the specimen and high frequency objects
produces high contrast interference image. However, the contrast quality can be affected by
non-uniform illumination, the structures available in the sample, their morphological features
and how the light enters and moreover, leaves the cellular and sub-cellular structures.
In general, the biological specimens can generate two types of contrast, for example,
exogenous (outer appearance) and endogenous (inner appearance) and both can be exploited
by optical microscopy methods. The external appearance of the biological structure or a
specific organelle can be exploited by tagging a fluorphore molecule to it, for example a GFP
tagged molecule produces an exogenous contrast [53]. The British scientist Sir George G.
fluorophore at longer wavelengths than that of the excitation and since then the developments
in optical components and instrumentation lead to advancement in fluorescence microscopy
methods because of the significant contrast obtained. Furthermore, the discovery of GFP has
enabled researchers to image the cellular and sub-cellular structures precisely [5]. The
genetically modified GFP tagged cells are allowed to express GFP naturally with the defined
cellular structure to convert exogenous contrast to intrinsic contrast. There are several
applications in biological science where fluorescence microscopy has been applied to study
the cellular structural organisation and mechanics using exogenous contrast. Epi-fluorescent
methods became very popular because of the high contrast available - typically using a
specific wavelength of illumination tuned to the absorption of a fluorophore label present or
added to the sample b. The light emitted by the fluorophore at a longer wavelength requires
colour filters to efficiently separate from the illumination and hence, giving a high contrast
image of fluorophore labelled objects. The remarkable achievements in fluorescence
microscopy due to the discovery of molecule-specific fluorescent markers still have several
well-known disadvantages, for example photo-bleaching, photo-toxicity to healthy cells, high
cost of fluorescent dye and the necessity of excitation, beamsplitter and emission filters to
isolate the fluorescent signals (typically £1.5-2k per filter set plus fluorophore and sample
preparation time). Additional information can be obtained beyond that available from widely
used epi-fluorescent microscopy methods such as confocal, multiphoton and stimulated
emission depletion microscopy [54]. Furthermore, due to the above-mentioned potential
disadvantages of labelling molecules the label-free methods can be a preferred choice to
render observations of cellular physiology in the native environment.
In label-free imaging, no special preparation of the sample is needed and the contrast achieved
may be either extrinsic or intrinsic. The intrinsic contrast is a natural property of the biological
cellular and subcellular structures due to small variation in spatial parameters, for example
index of refraction and thickness. The living cells holding cellular and sub-cellular structures
are optically translucent and dense with discrete spatial properties. The small spatial variations
reduces speed of illuminating light waves passing through them compared to the light passing
through the surrounding medium. The difference in speed makes a bend in the uniform
b https://www.microscopyu.com/techniques/fluorescence/introduction-to-fluorescence-microscopy. Accessed
wavefront that illuminates the objects in the sample. The change or delay in the speed of
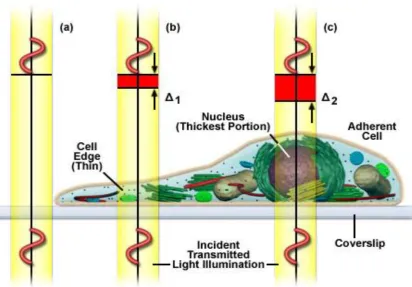
[image:33.595.117.530.117.404.2]illuminating wavefront corresponds to a change in phase (Figure 2.1).
Figure 2.1 Phase-contrast imaging of semi-transparent thin object c
Figure 2.1a, no significant delay can be seen in light waves passing through the surrounding
aqueous medium and the glass coverslip. However, a small delay can be seen when the wave
passes through the aqueous medium surrounding the cell, between the cell wall and the
cytoplasm (Figure 2.1b). Furthermore, a significant delay in light wave can be seen when it
passes the thick part of the cell where the nucleus is present due to differences in the index of
refraction (Figure 2.1c).
To exploit an intrinsic contrast generated by the translucent biological specimen remains a
significant challenge in the field of light microscopy. Phase contrast techniques provide good
contrast image utilising an interference phenomenon of two waves [55] passing through the
specimen and meeting at image plane. Zernike developed PCM in 1930s by utilising
two-wave interference phenomenon. In PCM, the contrast is generated by scattered and
scattered decomposed image light fields from the sample after inducing a relative phase shift
of quarter wavelength and matching their relative amplitude at the image plane [8] (Figure 2.2
and Figure 2.3). The use of a quarter-wave retardation between two waves generates a
mid-range intensity where sample induces a phase change to produce brighter or darker regions
depending on value of index of refraction via interference at the image plane (Figure 2.3). In
the case of bight field microscopy, the above image structure details would be faint and not
very clear so not suitable for qualitative or quantitative inspection. The phase contrast image thus obtained is a “diffraction limited, nonlinear and qualitative interference intensity image”,
therefore, quantitative phase information cannot be retrieved directly. PCM has enabled high
contrast imaging of weakly scattering biological specimens without need of labelling. The
internal cellular and sub-cellular objects produces scattered image light field carries structural
detail in it’s amplitude and phase. The varying refractive index property of biological
structures has been utilised by several researchers to measure phase delay, thickness of objects
by converting phase data into thickness, dry mass and volumetric measurements [21], [37],
[38], [56]–[58] by the implementation of pioneering ideas of Abbe, Zernike and Gabor. Some
[image:34.595.103.541.408.651.2]of the QPI methods are reviewed in Section 2.1.
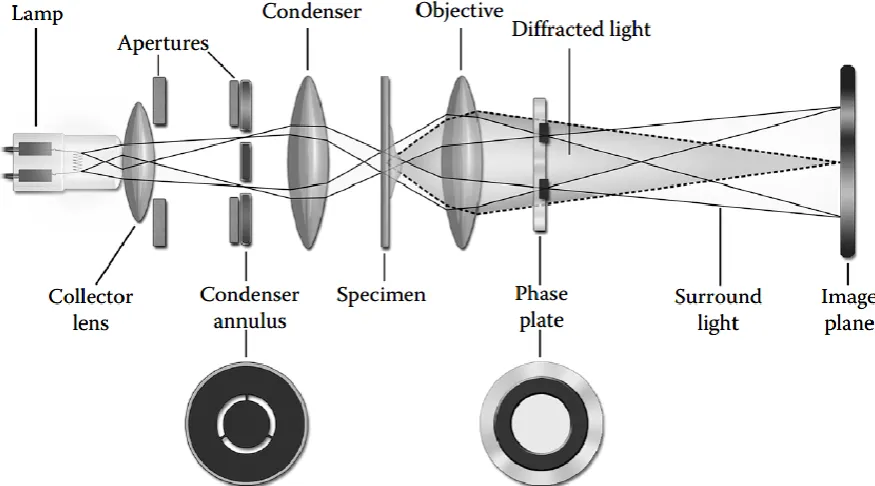
Figure 2.2 Optical train for phase contrast imaging d.
d https://www.microscopyu.com/techniques/phase-contrast/introduction-to-phase-contrast-microscopy.
Figure 2.3 HeLa cells cultured on a glass coverslip imaged via a PCM e.
2.1
Quantitative phase imaging
The QPI of the fast moving and changing cellular and sub-cellular objects can be of great
importance to study the dynamics of cellular behaviour, effect of drugs and toxins, structural
translocations, and to enlighten several biological questions regarding the cell cycle. Recently,
researchers have combined PCM with QPI with an aim to apply this technique for quantitative,
non-invasive and in-vivo studies of blood cells, HeLa cells and many more [14], [59], [60].
QPI method utilising Zernike’s PCM concept and Gabor’s holography approach are capable
of rendering phase maps from the weakly scattering objects [16]. Full-field imaging
techniques can provide a benefit of good spatial-temporal sensitivity to image biological
samples. The interferometric measurements can provide an opportunity to render both
quantitative and qualitative information from biological structures. The local thickness and
refractive index of transparent structures both affect the OPD and can be measured
dynamically using QPI techniques [61]; with thickness data obtained when there is
independent information on the refractive index of the biological entity under examination.
However, these techniques are not sufficient to image multilayer cell cultures that induce
larger scale optical path difference [62], for example 3D colonies. The CPI-based QPI
techniques have shown superior stability for long-term phase measurements over the field of
view without the need of faster scanning [14], [15], [63]. QPI schemes described in the
literature are constrained to the assumption of a planar reference wave [64] which limits an
accuracy at the operational field of view. Several QPI methods specifically for microscopy
have been developed in recent years. Some of them are presented below.
2.1.1
Digital holographic phase microscopy
In 1948, the understanding of phase information enabled development of holographic
microscopy [50]. Since then, the advancements in existing techniques have provided a suitable
approach to quantify phase maps precisely [22], [41], [65]. Cuche et al. introduced digital
holographic microscopy (DHM) for the first time in 1999. The intensity images recorded by
DHM can be converted into holograms (the outcome of phase and amplitude reconstructions)
of the objects using the Fresnel method to reconstruct the phase map from the sample [66],
[67]. An advancement in charge-coupled devices (CCDs) camera and high-speed computers
have enabled researchers to quickly record the necessary images to reconstruct holograms
[68]. DHM has been successfully applied in biological sample analysis with 2° - 4° phase
accuracy compared to optical coherence tomography [22] (will be reviewed in Section 2.3).
The stray reflections from optical components, noise hosted by optical setup and dust on the
sample slide can limit the achievable resolution. In general the reference and the object beams
follow separate paths, therefore, can be affected by mechanical and temperature fluctuations
and are susceptible to fringe order ambiguities due to air perturbations. Researchers have also
tried off-axis configuration for DHM but failed to produce the best lateral resolution due to
an angle between the reference and the object beams.
2.1.2
QPI methods based on off-axis optics
In this case, the reference beam is commonly tilted with a known off-axis angle and can be
combined with object beam using a Michelson interferometer at the Fourier plane to form a
phase-shifted interference image. The final quantitative phase map can be recovered from the
recorded single intensity interference pattern using a Hilbert transform [69] or the Fourier
domain demodulation [68]. Furthermore, an off-axis QPI method with laser illumination
through a single mode fibre has also been demonstrated with full spatial coherence known as
generate multiple diffraction orders at the image plane of the microscope. The spatial
separation of 0th (low pass filtered) and first-order diffraction (non-filtered) was done in the
Fourier domain via a pinhole or an SLM to achieve a common path optics. The two beams are
combined to form an interference image that may be used to render a phase map from objects.
The temporal resolution can be maximised due to use of a single interference image, but, the
spatial resolution can often be limited by an off-axis angle and there are limitations on the
slope of the object phase variation so as not to violate an assumption of increasing phase across
the interferogram. It is particularly problematic in recovering phase maps from high frequency
spatial phase objects, such as, the edges of cells where the phase gradients are very high
(Chapter 3, Section 3.2).
2.1.3
QPI methods based on common-path optics
In the optical arrangement where the reference and the object beams travel the same path to
form an interference image at the image plane is known as common-path optics. Fourier phase
microscopy (FPM) is an example of common-path optics for the application of phase shifting
to PCM [14]. In FPM, the reference image field was projected onto an SLM to create a
sequential set of phase shifted interference images at CCD camera. The recorded images can
be utlised to reconstruct phase maps of the cells to study membrane growth and fluctuations
at nanometre scale with high temporal sensitivity and stability [70]. Most of the QPI methods
including FPM use temporally coherent illumination (i.e. a narrowband laser) and hence, the
speckle noise degrades contrast quality of the image [71]. However, CPI enables cancellation
of noise and mechanical vibrations from the optics and hence, better for long-term monitoring
of a biological samples. Common path configurations can be combined with either phase
stepping or for single image acquisition by using a grating or an SLM under a suitable optical
design [40]. Recently, a common path DPM with phase shifting using an SLM has been
implemented to achieve good lateral resolution [15]. However, the average field cannot be
optimised due to the fixed size of a pinhole in the centre of the SLM that generates the
reference beam. The quantitative phase map can be reconstructed based on the scattered and
non-scattered image fields that restrict the alignment of DPM optics with reasonable accuracy.
This approach is not considered appropriate for this project due to the high cost of the
components required, the complexity and time needed for the phase reconstruction algorithms
and the compromise required with a fixed central pinhole. The single shot acquisition and
common-path capability provides stable phase measurement and was most commonly applied
(2010), and has been exploited to render blood cell membrane dynamics and mechanics at
scale [72].
2.1.4
QPI methods based on white light illumination
The microscopy methods with narrow-band (laser-like) illumination suffer from significant
levels of speckle noise, which limits both the lateral image resolution and the ability to recover
phase maps around the edges of the cells due to large steep gradients [67]. Broad bandwidth
illumination can significantly reduce the generation of speckle noise. Therefore, many
research groups have started utilising the broadband illumination to mitigate the speckle noise
from their experiments, but at the same time, this introduces errors in the applied phase shifts
(analogous to phase shift miscalibration errors) which primarily rely on the use of a single
narrowband laser like-source. In recent years, DPM has been updated to use a broadband
(white) light source in a reflection geometry to image biological samples and hence, offers
lower noise compared to narrowband laser sources. Previous versions of DPM do not match
high resolution and noise to contrast ratio due to the speckle generated by high temporal
coherence of the laser illumination [15]. Furthermore, these methods well suffers from speckle
noise and the reduced sensitivity in phase map reconstruction from transparent biological
objects. The common path optical setups using white-light illumination has enabled
researchers to achieve stable phase measurements from biological samples [26], [30]. For
example SLIM developed by Wang et al. in 2011 has gained much attention due to the
well-known advantage of common path optics and the use of white light illumination (WLI) to
study the dynamics of label-free biological samples [29]. In previous works [14], [21], [73],
[74] the phase resolution performance of a QPI has been re-scaled from units of radians into
wavelength (nm) by applying a scaling factor of λ/(2π) where the wavelength chosen
corresponds to the centroid of the illumination spectra. This convention is adopted throughout
this thesis. SLIM produced a phase resolution (scaled into nm) of 0.3 nm spatially and 0.03
nm temporally using a short-coherence illumination source that produces speckle-free
imaging. However, in the context of microscopy, the spatial resolution of SLIM is limited by
diffraction and aberrations [75] because it can’t take an advantage of the full numerical
aperture of the condenser lens due to a much smaller size of illumination annular ring. Only
12.5 frames per second acquisition speed has been possible to record dynamics of fast moving
biological objects [76], [77] limited by the hardware available in those experiments.
The use of WLI has improved the spatial sensitivity of SLIM [29] and off-axis based
distribution with a lower space-bandwidth product due to the requirements of Hilbert
transform phase analysis and hence, can only preserve the resolution at the expense of field
of view [71]. White-light diffraction tomography (WDT), a label-free tomography method to
image live cells, suitable to incorporate as an addition to conventional microscopy setups can
only examine single cells up to 20 µm thick [30] and an optical path differences ≤ 240 nm.
Furthermore, in the context of tomography method, the penetration depth is smaller and it
should be possible to go much deeper into scattering tissues. Until today, none of the
quantitative phase label-free microscopy methods are available to study organotypic cell
cultures, where penetration depth or long optical path measurements are of critical interest.
2.1.5
Phase shifting mechanism applied to PCM based QPI methods
A number of phase-shifting mechanisms have been exploited in PCM based QPI methods
using several optical components, for example a wave plate, rotating polarisers, PZT and an
SLM. Typically, a standard Michelson interferometer can be used in the back focal plane of
the microscope for spatial separation between the scattered and non-scattered image light
fields and a pre-defined phase shift is introduced using any of the above-mentioned optical
components. In most cases, the phase shifts are introduced sequentially to generate a temporal
series of interference images from which phase variation induced by objects can be extracted
by applying a trigonometric relationship. The method is simple in design with improved
spatial resolution; however, if the phase-shifted images are generated using a grating then a
difficulty arises in registering the different images onto a common set of pixel coordinates in
order to calculate the wrapped phase. The phase sensitivity may be controlled by matching
the relative power of the scattered and non-scattered beams to provide a reasonable signal to
noise ratio [79]. Despite the simple design and good sensitivity, the acquisition speed is
limited, as multiple frames are needed per interference image. Furthermore, use of laser
illumination optics introduce speckle noise and non-common path optics provides sensitivity
to spatial and temporal variations. Air turbulence and mechanical vibrations can perturb the
phase shift introduced in this manner can be mitigated by providing a shielding box to cover
the interferometer optics [80] or adopting common path optics as discussed in Section 2.1.3.
Speckle noise can also be largely eliminated by use of WLI [43].
2.2
Phase imaging optics for dynamic events
In standard interferometer based microscopy methods, the acquisition speed of the imaging