© 2019, IRJET | Impact Factor value: 7.211 | ISO 9001:2008 Certified Journal
| Page 6609
“ANALYSIS, MODELLING AND SIMULATION OF SUBSURFACE DAMS AND
THEIR ROLE IN POTABLE WATER SUPPLY”
S B Ankesh
1, Bhaswari G S
2, Dani Vinayak
3, Harish S
4, K R Anusha
51
Assistant Professor, Department Of Civil Engineering, Dr. Ambedkar Institute Of Technology, Banglore, India
2 3 4 5B E Students Department Of Civil Engineering, Dr. Ambedkar Institute Of Technology, Banglore, India
---***---
Abstract:- Subsurface dams are groundwater dams, which are structures that intercept or obstruct the natural flow of groundwater and provide storage for water underground. A subsurface dam intercepts or obstructs the flow of an aquifer and reduces the variation of the level of the groundwater table upstream of the dam. It is built entirely under the ground. MODFLOW is the U.S. Geological Survey modular finite-difference flow model, which is a computer code that solves the groundwater flow equation. The program is used by hydrogeologists to simulate the flow of groundwater through aquifers. A mixture of 20% Bentonite – 75% Sand – 5% Cement gives a permeability of 2.98x10⁻⁶ cm/s and is found to be ideal for construction of subsurface dam across Penneru river. Without the use of cement, the mixture of 25% Bentonite – 75% Sand has a permeability of 2.98x10⁻⁷ cm/s. The Model Muse Analysis indicates that by the construction of subsurface dam, the volume of water that can be extracted has increased by 20 times. Before the construction of dam by digging a well the water demand (considering 135 liters per capita per day) of about 7400 people can be met. After the construction of subsurface dam, the number of people that will be benefitted has increased to 10370. The upstream ground water table has risen by about 4m. Thus, per day 3000 more people will be benefited with the water extracted from the well for all 45 days.
Key words: Subsurface dam, MODFLOW, Bentonite, Model muse, Permeability etc.
1.INTRODUCTION
Water is a transparent, tasteless, odorless, and nearly colorless chemical substance that is the main constituent of Earth's streams, lakes, and oceans, and the fluids of most living organisms. Its chemical formula is H2O, meaning that each of its molecules contains one oxygen and two hydrogen atoms that are connected by covalent bonds. It occurs in nature as snow, glaciers, ice packs and icebergs, clouds, fog, dew, aquifers, and atmospheric humidity. Water covers 71% of the Earth's surface. It is vital for all known forms of life. On Earth, 96.5% of the planet's crust water is found in seas and oceans, 1.7% in groundwater, 1.7% in glaciers and the ice caps of Antarctica and Greenland, a small fraction in other large water bodies, and 0.001% in the air as vapour, clouds (formed of ice and liquid water suspended in air), and precipitation. Only 2.5% of this water is fresh water, and 98.8% of that water
is in ice (excepting ice in clouds) and groundwater. Less than 0.3% of all freshwater is in rivers, lakes, and the atmosphere, and an even smaller amount of the Earth's freshwater (0.003%) is contained within biological bodies and manufactured products.
Safe drinking water is essential to humans and other life forms even though it provides no calories or organic nutrients. Access to safe drinking water has improved over the last decades in almost every part of the world, but approximately one billion people still lack access to safe water and over 2.5 billion lack access to adequate sanitation. However, some observers have estimated that by 2025 more than half of the world population will be facing water-based vulnerability. A report, issued in November 2009, suggests that by 2030, in some developing regions of the world, water demand will exceed supply by 50%.
1.1 SUB-SURFACE DAMS
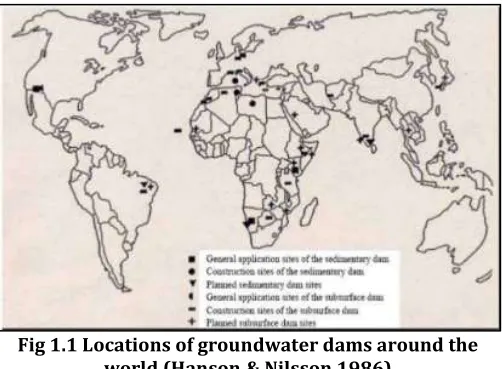
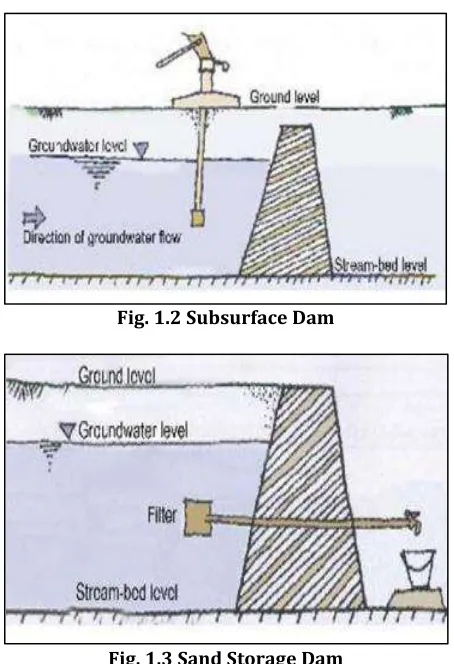
[image:1.596.308.559.579.764.2]A subsurface dam is a system to store groundwater by a “cut-off wall” (dam body) set up across a groundwater channel. Subsurface dams are groundwater dams, which are structures that intercept or obstruct the natural flow of groundwater and provide storage for water underground. They have been used in several parts of the world, notably India, Africa and Brazil. They are used in areas where flows of groundwater vary considerably during the course of the year, from very high flows following rain to negligible flows during the dry season.
They are mainly of two types: • Subsurface Dams
[image:2.596.306.559.99.232.2]• Sand Storage Dams
Fig. 1.2 Subsurface Dam
Fig. 1.3 Sand Storage Dam
[image:2.596.50.277.117.449.2]A groundwater dam can also be a combination of these two types. When constructing a subsurface dam in a river bed, one can increase the storage volume by letting the dam wall rise over the surface, thus causing additional accumulation of sediments. Similarly, when a sand storage dam is constructed it is necessary to excavate a trench in the sand bed in order to reach bedrock, which can be used to create a subsurface dam too.
Fig 1.4 Statistics of Subsurface Dams Constructed from 1960 to 2010
The best sites for construction of groundwater dams are those where the soil consists of sands and gravel, with rock or an impermeable layer at a few meter’s depth. Ideally, the dam should be built there where rainwater from a
large catchment area flows through a narrow passage.
Fig 1.5 Ideal site for construction of Subsurface Dams
1.2 BENTONITE – SAND – CEMENT MIXTURE
Sand-Bentonite or Sand-Cement or Sand-Bentonite-Cement mixtures are generally used as liner material or barrier material in hydraulic and waste containment. The low hydraulic conductivity of the mixture is the main property that is being utilized in these applications. Usually the amount of Bentonite and cement used in these mixtures will be less compared to the amount of sand. The main reason for using Bentonite and cement for this purpose is its easy availability. Also the cost of these materials is very less compared to other materials that can be used for the same purpose which will result in reduction in overall construction costs.
1.3 OBJECTIVE AND THE SCOPE OF THE STUDY
Main Objective:
To study the use of Sub-Surface Dams in improving the Groundwater availability so as to ensure potable water supply to the dependent localities by Simulation and Numerical Modelling using MODFLOW and construction of a physical Model using the results.
Specific Objectives:
• To study the reports of the existing subsurface dams in various countries and their effect on local groundwater scenario.
• To collect soil samples and test for geotechnical parameters such as moisture content, porosity, void ratio, field density etc.
• To analyze the material to be used in construction of Subsurface Dam.
• To construct a numerical model using U.S. Geological Survey Software MODFLOW to depict the effect of construction of proposed Subsurface Dam.
• To find the groundwater table variation before and after the construction of proposed subsurface dam.
• To determine the volume of water that can be extracted from the ground by digging a well after the construction of subsurface dam.
• To construct a Perspex sheet model using the soil samples
Kenya, 500 Brazil, 500
India, 5
[image:2.596.38.289.571.696.2]collected and build a model subsurface dam to depict the effect of the dam
1.4 STUDY AREA
1.4.1 CHIKBALLAPUR DISTRICT:
Chikaballapur district is the eastern gateway to Karnataka. It formed by bifurcating old Kolar district in to Chikballapur and Kolar districts. It is land locked district and hard rock terrain of Karnataka in the maiden (plain) region and covers an area of 4208 sq.km.
1.4.2 LOCATION:
Chikballapur district lies between North latitude 13˚ 13’ 04” to 13˚ 58’29” and East Longitude 77˚ 21’ 52” to 78˚ 12’ 31”. It is bounded by Bangalore and Tumkur districts on the west, Ananthpur district of Andhra Pradesh on the north, Chittoor district on the east and by Kolar district on the south. Administratively the district is divided into 6 taluks, 26 hoblies, 151 gram- panchayats and 1321 villages. The population as per the 2011census is 12.54 lakhs and the density of population is 298 per sq.km.
1.4.3 PREMONSOON WATER LEVEL (2011):
[image:3.596.316.554.203.377.2]Out of 32 NHS wells, the water level data is available for only 10 stations. the May 2011 pre monsoon depth to water level varies from 1.80 mts (Thondebhav, Gouribidnur taluk) to 11.35mts (southern part of Chickballapur taluk). A generalized water level map of pre monsoon is given as Fig- 1.6. In general, major part of the district comes under 2-10 m bgl. depth to water level. The water level recorded in Piezometer stations which represent semi confined aquifer, depth to water levels range between 8-26 m
Fig 1.6 Pre Monsoon Water Level
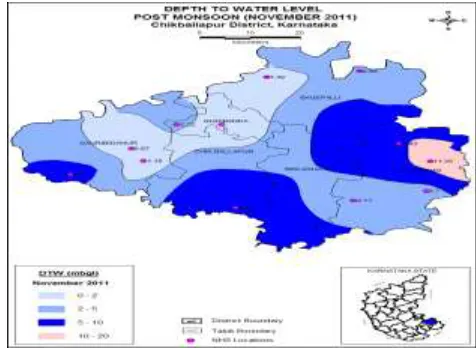
1.4.4 POST MONSOON DEPTH TO WATER LEVEL (2011):
Post monsoon Depth to water level in NHS dug wells ranges from 0.87 mts (Thondebhav, Gouribidnur taluk) to 13.35 mts (Irgampalli, Chintamai taluk) . A generalized water level map of postmonsoon is given as Fig -1.7. In general major part of the district comes under 0-10 m range and small parts in Chintamani taluk show Depth to water level between 10-20 m.
Fig 1.7 Pre Monsoon Water Level
2. LITERATURE REVIEW
2.1. STUDIES ON CONSTRUCTION & PERFORMANCE OF SUBSURFACE DAMS
In this section of literature review, the focus is on studies conducted on various subsurface dams around the world – their construction, performance, environmental impact and capability of solving water scarcity problems.
2.1.1 Ground Water Dams for Rural-Water Supplies in Developing Countries (Goran Hanson and Ake Nilsson)
2.1.2 Sub-Surface Dams: a simple, safe and affordable technology for pastoralists(A manual on SubSurface Dams construction based on an experience of Veterinaires Sans Frontieres in Turkana District (Kenya) September 2006)
Soil and water conservation is a high priority in the drier areas of sub-Saharan Africa. Storage of water from the rainy season to the dry season, or even from wet years to dry years is highly important. Groundwater dams, which store water under the ground, can store sufficient quantities of water for livestock and minor irrigation as well as for domestic use. If sited and built properly, dams can give an appropriate answer to the water need. Unfortunately there are also many examples of groundwater dams which have not been successful due to insufficient technical and social assessment and design. Lack of appropriate investigation for identifying suitable sites to construct the underground dyke often leads to subsurface lateral loss of water. By building an underground dam in the bed of a dry river, rain and groundwater is filtered, collected and stored underground. Apart from a technical and social assessment phase, technical and social design of SSD has to be done very carefully. Community participation and awareness creation (empowerment) are essential to the success of the intervention. This manual builds on the experience with subsurface dams of Vétérinaires sans Frontières in the Turkana-District in the North West of Kenya, explaining all phases from the initial assessment to the design of the dams based on the own lessons learnt with this specific technique.
2.1.3 Underground Dams – A Tool for Sustainable Development and Management of Groundwater Resources (H. Onder and M. Yilmaz) (European Water 11/12:3-4, 2005)
In this study, underground dams are briefly described, detailed information regarding the design and construction aspects is provided, and various types of dam wall are discussed. The use and usefulness of the underground dams as a means of sustainable development and their performance in the management of groundwater resources are analysed with the help of two example studies. In the first example a hypothetical idealized aquifer is considered, while in the second one, a real aquifer having relatively reasonable field data is selected. For the Performance evaluation and for the impact of underground dams on the groundwater behavior, numerical simulation is used. For that purpose, a well-known computer code, MODFLOW of U.S.G.S is utilized.
2.1.4 Construction of Subsurface Dams and these Impact on the Environment (Satoshi Ishida, Motoi Kotoku, Eiichi Abe, M.A.Fazal, Takeo Tsuchihara & Masayuki Imaizumi) (RMZ – Materials and Geoenvironment, Vol.50, No.1, pp-149-152, 2003)
In Japan the Miyakojima national irrigation project consisting of two subsurface dams which store 20,000,000m3 of groundwater in a limestone aquifer and draw up 50,000m3 per day through 147 tube wells, was completed in 2001. This paper examines the arrangement of the pumping wells and evaluates influence of the subsurface dams on nitrogen contamination.
2.1.5 Evaluation of Selected Site Location for Subsurface Dam Construction within Isayi Watershed Using GIS and RS Garmiyan Area, Kurdistan Region (Salahaldin S. Ali, Foad A. Umary, Sarkawt G. Salar, Nadhir Al-Ansari4, Sven Knutsson) (Journal of Water Resource and Protection, 2014, 6, 972-987)
Garmiyan area suffers from many water problems such as poor rainfall rate, water shortage, aridity and absence of groundwater in many places. Hence the subsurface dam is the best solution due to many advantages such as low cost of construction, least maintenance, low evaporation, no contamination, utilization of the land over the dam and better storage. The objective of this study is to evaluate the suitability of the selected site location for subsurface dam construction, to serve as strategic water supply storage, to solute the aridity and water shortage in this area of arid to semiarid climate in Isayi watershed within the stream deposits. Geographic information systems (GIS) and remote sensing through satellite images and Digital Elevation Model (DEM) interpretation and analysis have facilitated the investigation with more accuracy. ArcGIS helped in construction of thematic maps of the studied area. The geologic, structural, geomorphologic, hydrologic and hydro geologic characteristics with GPR survey show the suitability of the selected site location for construction of subsurface dam. According to the standard water quality for domestic, irrigation and livestock the water quality of all water samples are within the recommended range and the best time to be chosen, for construction of the subsurface dam, is during the autumn season from September to November.
2.1.6 Ground Water Dams for Rural-Water Supplies in Developing Countries (Goran Hanson and Ake Nilsson)
3. MATERIALS AND METHODOLOGY
3.1 MATERIALS:
3.1.1 BENTONITE: Bentonite is an absorbent aluminium phyllosilicate clay consisting mostly of montmorillonite. It was named by Wilbur C. Knight in 1898 after the Cretaceous Benton Shale near Rock River, Wyoming
3.2 METHODOLOGY:
3.2.1 DETERMINATION OF SPECIFIC GRAVITY OF SOIL SOLIDS BY PYCNOMETER METHOD:
AIM:
To determine the specific gravity of soil solids by Pycnometer bottle method.
Specific gravity is the ratio of the mass of unit volume of soil at a stated temperature to the mass of the same volume of gas-free distilled water at a stated temperature.
3.2.2 DETERMINATION OF WATER CONTENT OF SOIL SOLIDS BY OVEN DRYING METHOD:
AIM:
To determine the water content of soil solids by Oven Drying method.
The water content (w) of a soil sample is equal to the mass of water divided by the mass of solids.
3.2.3 DETERMINATION OF WATER CONTENT OF SOIL SOLIDS BY PYCNOMETER METHOD:
AIM:
To determine the water content of soil solids by Pycnometer bottle Method.
To determine water content by this method, the value of G should have been determined prior.
3.2.4 DETERMINATION OF IN-SITU DENSITY BY CORE CUTTER METHOD
AIM:
To determine the field density or unit weight of soil by Core cutter method.
Field density is used in calculating the stress in the soil due to its overburden pressure. It is needed in estimating the bearing capacity of soil foundation system, settlement of footing, earth pressures behind the retaining walls and embankments. Stability of natural slopes, dams, embankments and cuts is checked with the help of density of soil. It is the density that controls the field compaction of soils.
3.2.5 DETERMINATION OF IN-SITU DENSITY BY SAND REPLACEMENT METHOD:
AIM:
To determine in-situ density of natural or compacted soil using Sand replacement method.
The in-situ density of natural soil is needed for the determination of bearing capacity of soils, for the purpose of stability analysis of slopes, for the determination of pressures on underlying strata for the calculation of settlement and the design of underground structures. Moreover, dry density values are relevant both of embankment design as well as pavement design.
3.2.6 DETERMINATION OF PARTICLE SIZE DISTRIBUTION BY SIEVING (GRAIN SIZE ANALYSIS):
AIM:
To determine the particle size distribution by sieving (Grain size analysis) and to determine the fineness modulus, effective size and uniformilty coefficient.
3.2.7 DETERMINATION OF LIQUID LIMIT OF FINE SOIL:
AIM:
To determine the liquid limit of fine soil by using Casagrande Apparatus
When water is added to dry soil, it changes its state of consistency from hard to soft. We can define liquid limit as the minimum water content at which the soil is still in the liquid state, but has a small shearing strength against flow.
3.2.8 DETERMINATION OF LIQUID LIMIT BY SATIC CONE PENETROMETER
AIM:
To determine Liquid Limit by Static Cone Penetrometer The Liquid Limit is the moisture content at which the soil passes from the plastic to the liquid state as determined by the Cone Liquid Limit test
3.2.9 DETERMINATION OF PLASTIC LIMIT OF THE SOIL:
AIM:
To determine plastic limit of the soil.
The plastic limit of fine-grained soil is the water content of the soil below which it ceases to be plastic. It begins to crumble when rolled into threads of 3mm dia.
3.2.10 DETERMINATION OF SHRINKAGE LIMIT:
AIM:
To determine the shrinkage limit of the soil.
The value of shrinkage limit is used for understanding the swelling and shrinkage properties of cohesive soils.
3.2.11 DETERMINATION OF MAXIMUM DRY DENSITY AND OPTIMUM MOISTURE CONTENT BY STANDARD PROCTOR COMPACTION METHOD
AIM:
3.2.12 DETERMINATION OF PERMEABLITY OF A SOIL SAMPLE BY CONSTANT- HEAD METHOD:
AIM:
To determine the permeability of soil by constant-head method.
The rate of flow under laminar flow conditions through a unit cross sectional are of porous medium under unit hydraulic gradient is defined as coefficient of permeability.
3.3 MODFLOW:
MODFLOW is the U.S. Geological Survey modular finite-difference flow model, which is a computer code that solve the groundwater flow equation. The program is used by hydrogeologists to simulate the flow of groundwater through aquifers. The source code is free public domain software, written primarily in Fortron, and can compile and run on Microsoft Windows or UNIX-LIKE operating systems.
Since its original development in the early 1980s, the USGS has made four major releases, and is now considered to be the de facto standard code for aquifer simulation. There are several actively developed commercial and non-commercial graphical user interfaces for MODFLOW. MODFLOW was constructed in what was in 1980's called a modular design. This means it has many of the attributes of what came to be called object-oriented programming. For example, capabilities (called "packages") that simulate subsidence or lakes or streams, can easily be turned on and off and the execution time and storage requirements of those packages go away entirely. If a programmer wants to change something in MODFLOW, the clean organization makes it easy. Indeed, this kind of innovation is exactly what was anticipated when MODFLOW was designed.
[image:6.596.307.565.75.291.2]The USGS throughout the 1970s had developed several hundred models, written in different dialects of FORTRAN. At the time, it was common practice to rewrite a new model to fit the need of a new groundwater scenario. The concept for MODFLOW was originally designed in 1981 to provide a common modular groundwater model, which could be compiled on multiple platforms without major (or any) modification, and can read and write common formats. Different aspects of the groundwater system would be handled using the modules, similar to the idea of a "component stereo system".
[image:6.596.304.563.324.532.2]Fig 3.1 MODFLOW Simulation
fig 3 .2 3 Dimensional Grid
4. RESULTS
GEOTECHNICAL PARAMETERS:
Table 4.1
SL.No. In-sittu Parameter Result
1 Water content 22.94%
2 Bulk density 1.878g/cc
3 Dry density 1.527g/cc
4 Void ratio 0.478
5 Porosity 0.915
6 Degree of saturation 1.083 7 Saturated unit weight 1.851g/cc 8 Submerged unit weight 0.857g/cc 9 Specific gravity 2.258
11 Plastic limit 30.79% 12 Shrinkage limit 14.33% 13 Maximum dry density 1.93g/cc 14 Optimum moisture content 28.78% 15 Permeability 2.298x10⁻³ms
4.2 MODFLOW SIMULATIONS RESULTS:
4.2.1 Case -1:
In case - 1, water table variation in the river in its natural condition (river is dry) is obtained by steady state analysis. There is no subsurface dam constructed across the river bed. The only external factor influencing the river system is recharge. The input parameters used in the model is given in table 4.2.
Table 4.2 Length of river bed
(m)
800
Width of the river bed (m)
400
Depth of the river bed (m)
10
Permeability of the soil (m/sec)
2.298x10⁻³
Recharge (cm/sec) 2.037x10⁻⁶
Upstream total head (m)
6
[image:7.596.303.568.221.423.2]Downstream total 2
Fig 4.2 Water Table Variation Along The River Bed For Case – 1
The recharge value is considered as 85% of total rainfall, when the remaining 15% is accounted for evapotranspiration and other losses. For the entire river
section considered, same permeability value as given in table 5.5. The upstream and downstream boundaries are given as constant head boundary package with the total head values given in table 5.5. Water table variation is plotted along the river bed for the no dam and no well case and it is shown in fig 4.2.
4.2.2 Case -2:
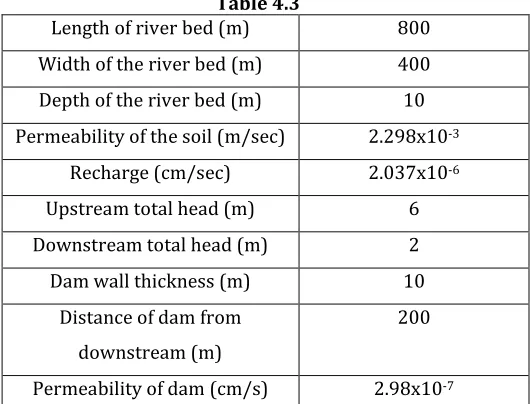
In this case dam wall is added to the natural condition of the river bed with the input parameter given in table 4.3.
Table 4.3
Length of river bed (m) 800 Width of the river bed (m) 400 Depth of the river bed (m) 10 Permeability of the soil (m/sec) 2.298x10⁻³
Recharge (cm/sec) 2.037x10⁻⁶ Upstream total head (m) 6 Downstream total head (m) 2 Dam wall thickness (m) 10
Distance of dam from downstream (m)
200
Permeability of dam (cm/s) 2.98x10⁻⁷
A dam wall of length 220m, thickness 10m is provided for the entire 10m depth of the river bed. The hydraulic conductivity of the dam is the main parameter that effects the water table variation. The permeability of subsurface dam is given as the permeability of the mixture with 25% Bentonite and 75% sand obtained from laboratory experiments. The recharge value and the boundary conditions are same as that of the case 1. The ground water table variation along the river bed is plotted fig 4.3.
Fig 4.3 Water Table Variation Along The River Bed For Case – 2
The comparison of water table position before and after the construction of dam, with the recharge value and boundary conditions remaining the same is given in fig 4.4.
0 2 4 6 8
0 200 400 600 800
H
ea
d (
m
)
Distance along the river bed (m)
Water Table Elevation
0 2 4 6 8
0 200 400 600 800
H
ea
d (
m
)
Distance along river bed (m)
[image:7.596.40.319.307.714.2]Fig 4.4 Comparison Of Water Table Elevation With And Without The Dam
From the fig 4.4 it is evident that after the construction of subsurface dam, the water table in the upstream side has raised by about 4m near the dam and even upto 1.5 km the rise of water table is found to be significant in fig 5.3 it can be seen that at the downstream side vary close to the dam (upto 100 m) there is small drop in the water table position by about 0.5 m and it becomes negligible gradually.
4.2.3 Case -3:
For the case 1, i.e., the natural condition of the river a well was added to get the case 3. This case shows how much water can be extracted by digging a well in the river. The input parameters for this case are given in the table 4.4.
Table 4.4
Length of river bed (m) 800
Length of river bed (m) 800
Width of the river bed (m) 400
Depth of the river bed (m) 10
Permeability of the soil (m/sec)
2.298x10⁻³
Recharge (cm/sec) 2.037x10⁻⁶
Upstream total head (m) 6
Downstream total head (m) 2
Position of well from downstream (m)
(500,200)
400
Width of the river bed (m)
Specific storage (m-1) 0.001
Discharge from the well (m3/day)
1000
Depth of the river bed (m) 10 Permeability of the soil (m/sec) 2.298x1
0-3 Recharge (cm/sec) 2.037x1
0-6 Upstream total head (m) 6 Downstream total head (m) 2 Position of the well from downstream (500,20
0)
To find the maximum quantity of water that can be extracted from the well, many trials were done with varying amount of discharge under steady state condition. The maximum discharge that can be obtained from the well without dropping the water level at the well location below downstream water level was the criteria used. Thus the maximum water that can be extracted from the well was obtained as 1000m3 per day.
94
4.2.4 Case -4:
In this case a well is added to case – 2. All input parameters are used are given in the table 4.5.
Table 4.5
Length of river bed (m) 800 Width of the river bed (m) 400 Depth of the river bed (m) 10
Permeability of the soil (m/sec)
2.298x10⁻³
Recharge (cm/sec) 2.037x10⁻⁶ Upstream total head (m) 6 Downstream total head (m) 2
Position of well from downstream (m)
(500,200)
Dam wall thickness (m) 10 Distance of a dam from
downstream (m)
200
Permeability of dam (cm/s) 2.98x10⁻⁷
0 2 4 6 8
0 200 400 600 800
H
ea
d (
m
)
Distance along river bed (m)
Water Table Elevation
The method used for this case is same as that of case 3. The only difference is the presence of subsurface dam. By trial and error maximum discharge value obtained for river bed with dam case is 1400 m3/day. So by construction of a subsurface dam using sand bentonite mixture discharge value from the well increased by 400 m3/day.
4.2.5 Case -5:
[image:9.596.36.285.252.549.2]A transient analysis was conducted to determine the time of pumping from the well when subsurface dam is not present. The input parameter of the model are given in the table 4.6.
Table 4.6
Fig. 4.5 Head Vs Time At Control Point For Case – 5
Location of well is chosen as the control point. Where there was no well and dam, the head at the control point is 3.35m. The value of head (output of case 1 is used as the initial head for the case 5. By unsteady analysis for discharge of 1000 m3/day from the well, by approximately 3 days, steady state was reached i.e., after 3 days the decrease in head becomes negligible. Figure 4.5 shows the decrease in head value with time.
4.2.6 Case 6:
To find the number of days required for the recuperating the pumped water, a transient analysis was conducted with output of case 3 as initial head. For this purpose, the wells were deactivated. All other input parameters used are given in table 4.7
Table 4.7
Length of river bed (m) 800
Width of the river bed (m) 400
Depth of the river bed (m) 10
Permeability of the soil (m/sec)
2.298x10⁻³
Recharge (cm/sec) 2.037x10⁻⁶
Upstream total head (m) 6
Downstream total head (m) 2
Specific storage (m-1) 0.001
Fig. 4.6 Head Vs Time At Control Point For Case – 6
The initial head for the analysis was 2.25m at the control point (where well was present) and by unsteady analysis the number of days required for refilling was obtained as 10 days. After 10 days, the increase in head was found negligible and results is given in fig. 4.6
4.2.7 Case 7
This case represents the unsteady analysis of or finding time of pumping when subsurface dam is present. The input parameters to the model are given in table 4.8.
Table 4.8
Length of river bed (m) 800 Width of the river bed (m) 400 Depth of the river bed (m) 10
Permeability of the soil 2.298x10⁻³ Recharge (cm/sec) 2.037x10⁻⁶
0 1 2 3 4 5 6
0 20 40 60 80 100
H
ea
d (
m
)
Time (hrs)
Without Dam
0 1 2 3 4 5 6
0 2 4 6 8 10 12
H
ea
d (
m
)
Upstream total head (m) 6 Downstream total head (m) 2
Position of well from downstream (m)
(500,200)
Dam wall thickness (m) 10 Distance of a dam from
downstream (m)
200
Permeability of dam (cm/s) 2.98x10⁻⁷ Position of well from
downstream
(500,100)
Discharge from well (m3/day) 1400 Specific storage (m-1) 0.001
Fig. 4.7 Head Vs Time At Control Point For Case -7
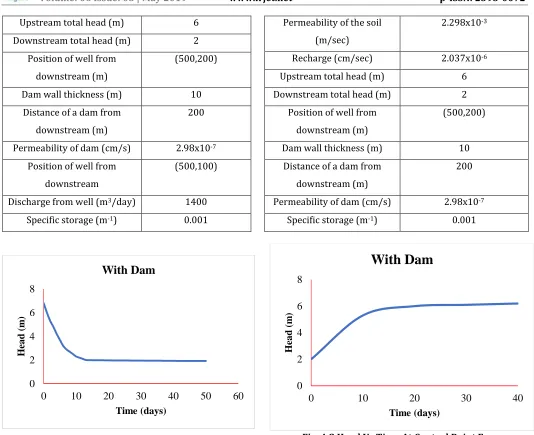
Location of well is chosen as a control point. When there is no well, the head at the control point is 6.55m. This value of head (output of case 2) is used as the initial head for case 7. For discharge of 1400 m3/day from the well, approximately after 45 days, steady state was reached i.e., after 45 days the decrease in head become negligible. Fig. 4.7 shows the decrease in head value with time.
4.2.8 Case 8:
To find the number of days required for recuperating the pumped water, transient analysis was conducted with output case 4 as initial head. For this purpose, the wells were deactivated. All other input parameters used are given in table 4.9
Table 4.9
Length of river bed (m) 800 Width of the river bed (m) 400 Depth of the river bed (m) 10
Permeability of the soil (m/sec)
2.298x10⁻³
Recharge (cm/sec) 2.037x10⁻⁶ Upstream total head (m) 6 Downstream total head (m) 2
Position of well from downstream (m)
(500,200)
Dam wall thickness (m) 10 Distance of a dam from
downstream (m)
200
[image:10.596.34.568.60.495.2]Permeability of dam (cm/s) 2.98x10⁻⁷ Specific storage (m-1) 0.001
Fig. 4.8 Head Vs Time At Control Point For Case – 8
The initial head for the analysis was 2.2 m (output of case 4) at the control point (were well is present) by unsteady analysis the number of days required for refilling was obtained as 30 days. After 30 days, the increase in head was found negligible and the result is given in figure 4.8.
4.2.9 SUMMARY:
A summary of the Model Muse analysis of Penneru before and after the construction of subsurface dam in Table 4.10. By the construction of subsurface dam, the volume of water that can be extracted has increased by 20 times. Before the construction of dam by digging a well the water demand (considering 135 litres per capita per day) of about 7400 people can be met. After the construction of subsurface dam, the number of people that will be benefitted has increased to 10370.
Table 4.10 Summary of Model Muse Analysis
Without dam With dam Maximum
discharge from 1000 1400
0 2 4 6 8
0 10 20 30 40 50 60
H
ea
d (
m
)
Time (days)
With Dam
0 2 4 6 8
0 10 20 30 40
H
ea
d (
m
)
well (m3/day) Number of days
of pumping 3 45
Number of days required for
refilling
10 30
Volume of water
extracted (m3) 3000 63000
5. CONCLUSION
A subsurface dam is a cutoff wall constructed across a river, below the river bed level. A dam constructed this way, stores ground water by restricting its flow to downstream side. Thus the loss of infiltrating rainwater by its entry into the ocean can be prevented without obstructing the surface flow of river. This stored ground water will be an additional source of water for irrigation and drinking purpose. Thus construction of subsurface dam will save humanity to a great extend from its water scarcity problems. The study was conducted to find the effectiveness of using subsurface dams as a water source. The conclusion drawn from the study are listed below: 1) Based on model generated using MODFLOW for Penneru river, after construction of subsurface dam:
• The upstream ground water table has risen by about 4m. • The amount of water that can be extracted from a well in the upstream side has increased by 400m3/day.
• Also the duration of water extracted from the well has increased and the time required for refiling the water has reduced.
• The volume of water than can be extracted has increased by 20 times.
• Thus, per day 3000 more people will be benefited with the water extracted for all 45 days.
2) Suitability of sand-bentonite-cement mixture for construction of subsurface dams:
• Addition of Bentonite only or Bentonite along with cement will make the in-situ soil impermeable
• With 5% cement - 20%bentonite, permeability value reduced to 2.98x10⁻⁶ cm/s and with 25% Bentonite, permeability of soil is reduced to 2.98x10⁻⁷ cm/s
• Thus the mixture containing 5% cement - 20% Bentonite - 75% sand and 25% Bentonite – 75% sand can be recommended for construction of cut-off wall for subsurface dams.
REFERENCES:
1) Brazil, Kenya: Subsurface Dams to Augment Groundwater Storage in Basement Terrain for Human Subsistence (Stephen Foster & Albert Tuinhof) (THE WORLD BANK).
2) Bilsel et.al. (2012).
3) Construction of Subsurface Dams and these Impact on the Environment (Satoshi Ishida, Motoi Kotoku, Eiichi Abe, M.A.Fazal, Takeo Tsuchihara & Masayuki Imaizumi) (RMZ –
Materials and Geoenvironment, Vol.50, No.1, pp-149-152, 2003).
4) Construction of Subsurface Dams for Sustainable Water Management in the Mandavi and Ganganeru River Basins, YSR District, Andhra Pradesh, India (Routu Balaram, S. Ramanaiah and R. Jagadiswara Rao) (Earth Science India – July, 2013).
5) Evaluation of Selected Site Location for Subsurface Dam Construction within Isayi Watershed Using GIS and RS Garmiyan Area, Kurdistan Region (Salahaldin S. Ali, Foad A. Al-Umary, Sarkawt G. Salar, Nadhir Al-Ansari4, Sven Knutsson) (Journal of Water Resource and Protection, 2014, 6, 972-987).
6) Experimental Investigation of Compacted Sand-Bentonite Mixtures (Roberta Proia, Paolo Croce, Giuseppe Modoni) (Procedia Engineering 158 (2016) 51-56). 7) Ghazi, A. F. (2015). Engineering characteristics of compacted sand-bentonite mixtures.
8) Ground Water Dams for Rural-Water Supplies in Developing Countries (Goran Hanson and Ake Nilsson). 9) Groundwater Information Booklet, Bangalore Rural District, Karnataka (South Western Region, Bangalore, March 2013) – Govt. of India, Ministry of Water Resources, Central Ground Water Board.
10) Sharma and Kozicki (1988).
11) Sub-Surface Dams: a simple, safe and affordable technology for pastoralists (A manual on SubSurface Dams construction based on an experience of Vétérinaires Sans Frontières in Turkana District (Kenya) September 2006). 12) Subsurface dams to harvest rainwater— a case study of the Swarnamukhi River basin, Southern India (N. Janardhana Raju · T. V. K. Reddy · P. Munirathnam). (Hydrogeology Journal (2006) 14: 526–531).