Abstract—This study is focusing on the behavior of fluid flow and particle flow. The boundary of the study is concentrated more the behavior of particle flow inside semi ellipse shape lid driven cavity (benchmark for shallow cavity) using Stream function-Vorticity approach Navier-Stokes equation and validation of flow based on experiment analysis of particle flow in semi ellipse shear cavity. The height to length aspect ratios of 1:2 semi ellipse cavity were simulated using flow conditions (range of Reynolds numbers of 100 to 2500). The initial condition of the particle remains at rest at bottom wall of the lid driven cavity. The results obtain for semi ellipse lid driven cavity illustrate that the silk particle rotates in a swirling motion in the lid driven cavities and correlates with the computational method calculated.
Index Terms— DNS, Experiment, Non-uniform, Semi-Ellipse Lid Driven Cavity
I. INTRODUCTION
IDdriven cavity flows have been studied for a long time because of their broad range of applications such as in natural, industrial for short dwell coaters and metal ribbons production and biomechanical regions [1-3]. Throughout the years, many research in lid driven cavity has been conducted either by using numerical or experimental methods to view the flow. Since the improvement in technology such as in software and hardware were successful, vast solving technique of numerical codes were develop for lid driven cavity flow to map the fluid flow topologies and vortices formations in computational domain. One of the pioneer for experimentation on lid driven cavity were conducted by J.R Koseff and R.L.Streets [4] early in 1984 by using particle streak and dye emission technique to observe the flow in lid driven cavity of length to wide ratio of 3:1 for rectangular lid driven cavity which later improved to particle tracking
Manuscript received Dec 08, 2014; revised Feb 01, 2015. This work was supported in part Universiti Malaysia Pahang, Pekan. Study on the Behavior of Particles in High Reynolds Number in Semi Ellipse Lid Driven Cavity.
M.Y.M. Hafizi was with the Universiti Malaysia Pahang, CO 26600 Malaysia (Phone: 609-424-6264; fax: 604-424-6222; e-mail: hafizi@ ump.edu.my).
M.S. Idris is with Universiti Malaysia Pahang, CO 26600 Malaysia. He is now with the Faculty of Mechanical Engineering, Universiti Malaysia Pahang, Pekan, CO 26600 Malaysia (e-mail: [email protected]).
N.M.M. Ammar is with Universiti Malaysia Pahang, CO 26600 Malaysia. He is now with the Faculty of Mechanical Engineering, Universiti Malaysia Pahang, Pekan, CO 26600 Malaysia (e-mail: [email protected]).
system or particle imaging system or both. As for Numerical technique, U. Ghia et al., [5] explored the findings by applying the Navier Stokes with multi grid method to visualize the flow. Many numerical techniques later on were applied by other researchers in lid driven study to improve its accuracy through velocity profile. Such researchers were T.P chiang et al.,[6] using finite volume method, Ercan Ertuk,[7] M.S.Idris and N.M.M. Ammar [8] using Direct Numerical Simulation, Cheng and Hung [9] using Lattice Boltzmann Method to study vortex formation and other researcher as well to simulate and calculate complex with discrete equations.
As part of research improvement to determine the accuracy of a numerical scheme, various researches were conducted in different lid driven cavity geometries [1]. Some carried out experiments [1] and numerical techniques in semi ellipse and semi-circle geometries as benchmark for shallow pond cavity [8, 14] and other also contributed to triangular cavities [7, 9] and larger vertical depth rectangular cavity for deep cavity.
Experiment and Numerical schemes on particles flow was then carried on as part of the industry application: powder technology application fluidized beds, coal combustion, dust explosions, particles in rotating moving tanks and many others. One of the first researchers to carry out particle flow behavior were by P. Kosinski et al.,[10] and S.J Tsrong et al.,[11,17]. Analysis of Particle-Particle interaction was performed using Eularian-Lagrangian approach. Qualitative results was obtained, and concluded that particle interactions influence the dust cloud behavior. Numerical study using Lagrangian-Lagrangian approach was also conducted. Result obtain was more discrete toward one particle movement only. [12]. Some researcher was also piloted toward the behavior of denser Particle in lid cavity [15], particle laden behavior of equal density [16] and also compare the behavior of different density of a particle [12] to determine the particle fluid interactions in the cavity.
Yet, still there are such gaps for more research to improve on particle behavior in shallow lid driven cavity. This paper will focuses more on analyzing the physics of the particle behavior and particle tracking in the semi ellipse shape lid driven cavity by using various Reynolds number through experiment and numerical method. This study will also focus more on the location of the primary and secondary vortex as well as the stream function value for different Reynolds numbers. The Driven Cavity flow has
Study on the Behavior of Particles in High
Reynolds Number in Semi Ellipse Lid Driven
Cavity
M.Y.M. Hafizi, M.S. Idris, and N.M.M. Ammar
well defined boundary conditions and it is apparently straightforward to use this configuration for benchmarking of numerical and experimental studies of fluid flows. This experiment will solve flow and particle behavior in different length to width ratio of shallow ellipse cavity and act as a benchmark case for the purpose of validating particle flows and particle tracking in shallow cavity. This experiment used several boundary conditions such as lid driven cavity size, control of parameter, lid driven cavity shape as well as particle behavior.
II. GOVERNING EQUATIONS
The numerical technique of flow analysis was conducted with emphasis on the stream function Vorticity approach. For this research, there are several main equations with a few auxiliary equations. These main equations were the Vorticity transport equation (1) and the Vorticity equation in terms of stream function (2). These equations were in dimensionless form and all parameters are independent.
2 2
2 2
1
U V
T X Y Re X Y
Ω Ω Ω Ω Ω (1)
2 2
2 2
X Y
Ω (2)
The particle motion using Eulerian-Lagrangian (E-L) approach will be treated as points where
2
) (u v v u A C f
f dT
dv
m p Drag D p
(3)
m is the particle mass, u and v is the particle velocity and fp
is the force acting on the particle.
III. BOUNDARYDISCRETISATION
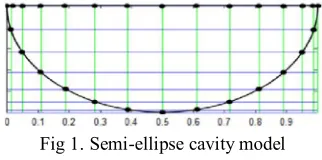
[image:2.612.350.511.49.129.2]The boundary of a semi-ellipse cavity was crucial, especially at the bottom part with a grid 14 × 7, as shown in Fig 1. When the grid spacing of an actual 128 × 128 grid was to be presented as the cavity model, the special spacing arrangement was difficult to display. For the model of a semi-elliptic cavity the mesh was unique, whereas the grid spacing was different for each grid sizes. The spacing needed to be implemented to facilitate the curved shape of the bottom cavity, which adopts the curvature of an isosceles triangle cavity. According to Fig. 1, the length of the lid, L (top boundary) is maintained at unity, whilst the cavity height (H) changes for the various shallow aspect ratios (H/L or AR) of 1:2. Hence, the irregular spacing of the grid should compensate for the non-uniform equation for the derivatives terms.
Fig 1. Semi-ellipse cavity model
IV. EXPERIMENTAL SETUP
A. Design of Experiment
Experiment was performed as shown in Fig 2. The inner cavity has a transparent rigid walls and a moving lid on the top side. The moving lid was obtained by placing on the open top face of the cavity conveyor belt system, driven by a variable speed motor. The semi ellipse itself placed inside a special holder rig. The outer tank was filled with distilled water up to a level slightly above the conveyor belt lid. The cavity which was semi ellipse lid driven cavity has length to width ratio of 1:2. The span wise aspect ratio equals to two for semi ellipse shape. Lid driven cavities was made of Acrylic material in order to provide more clear visualization of the particle flow. The lid driven cavity rig was made of aluminum profile and held smoothly between the lid driven cavity structure. The roller experimental setup was done as similar in N.M.M Ammar et al., [13] and S.J Tsorng et al (2005 and 2007) [11, 17] experimental setup. The roller is situated between the inner parts of lid driven cavity. The water tank which have dimension of 46 cm height x 46 cm wide x 93 cm long container which have thickness of 1 cm were used for water flow cavities.
Lighting were set up using LED lamp with a low frequency to avoid blur image during capturing the images and the environment lighting are made dimmer so that the camera can focus clearly on the lid driven cavity. LED 1 was place horizontally below the water tank and the other 2 LEDs were directed towards the center of the water tank. The test rig were developed using standard aluminum which have 40 x 40 mm square. The aluminum frame are assemble without machining process due to the aluminum frame assembly process that involve the use of nut and bolt which tighten the structure to the aluminum profile. The design frame reduced work time, workload for the assembly, and damage to the aluminum profile structures. The manufacturing cost was not cheap, as the aluminum profile was very expensive. Furthermore by using twice the amount of nuts and bolts on a single aluminum profile assembly also increased the cost.
holder was set on the edge of the cylindrical shaft allowing the plastic conveyor to rotate smoothly. The holder of the conveyor was a stainless steel threaded studs with length of 15.6 mm and a pitch diameter of 1.75 mm. The motor regulator to decreases and increase the speed of the conveyor was placed at the end of the shaft. The motor regulator was supported by aluminum profile drilled with M14 drill at both side. The aluminum profile was 25cm length and the drill 3cm from the drill diameter to the end of the 25cm length of aluminum profile. This was done to ensure the motor does not produce and vibration during the experimental process. Although there may have very small frequencies of vibration occurred. The cylindrical shaft used was a hollow cylinder with an outer diameter of 40.0 mm and has a thickness of 2mm. The length of each shaft was 30 mm long. The thickness of the hollow cylinder is reduce by an average of 1.7mm thickness and to a wide of 14mm to allow a bearing with a diameter of 39.688cm to be fitted into the hollow cylinder.
Fig 2. Experimental setup
The motor generates about 1500rpm which drive the conveyer belt. The diameter of the motor pulley was 15 cm and the diameter of pulley that connects to the conveyer was 20 cm. The controller are situated on the below right corner attached to the test rig with the controller box. The controller can control the motor with the minimum applicable speed of 40 mm /s and to a maximum 220 mm /s speed can control the speed.
V. EXPERIMENTAL RESULT
A. Experimental Result
The experiment to validate the numerical scheme was performed for semi-ellipse shape lid driven cavity with an aspect ratio of 1:2. In each case the Reynolds number of the flow was set to 100, 1500 and 2000 to observe the particle flow in the lid driven cavity. The experiment was conducted from zero second until the flow become steady state. The time taken for each flow to register as steady flow was between 13 to 15 seconds.
B. Experiment Result for Various Reynolds Numbers
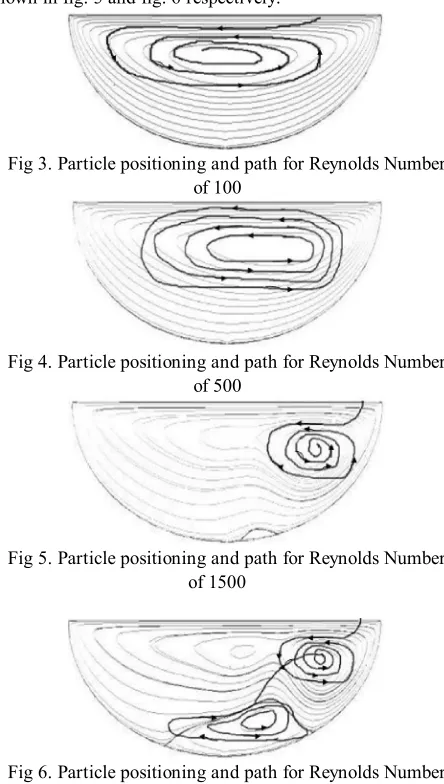
In order to determine the particle tracking in the semi-ellipse shape lid driven cavity, experiment was conducted with the aspect ratio of 1:2 first by using Reynolds Number of 100. Fig 3 below display the time of the experiment from
t=0 second to t=15 second in terms of streamline pattern. As the motor rotate the conveyer belt, the particle started to flow into a circular shape. At the beginning the circular shape was tightly confined at the upstream section of the semi ellipse cavity, but then gradually moves downwards to the center of the cavity for Reynolds number of 100 as shown on the fig. 3 below. However for Reynolds number of 500 the center of the primary vortex changes from the center of the cavity to the left of the cavity. It can be seen that from fig. 4, throughout these expanding circular shape streamline flow, the particle remain near the center of the semi ellipse cavity. Upon reaching certain parameter, the particle finally move outwards towards the right side wall of the cavity. It can be observed that the secondary vortex start to form at the Reynolds number of 1500 and 2000 as shown in fig. 5 and fig. 6 respectively.
Fig 3. Particle positioning and path for Reynolds Number of 100
Fig 4. Particle positioning and path for Reynolds Number of 500
[image:3.612.318.540.234.626.2]Fig 5. Particle positioning and path for Reynolds Number of 1500
Fig 6. Particle positioning and path for Reynolds Number of 2000
VI. NUMERICAL RESULT
A. Result for 1:2 Aspect Ratio
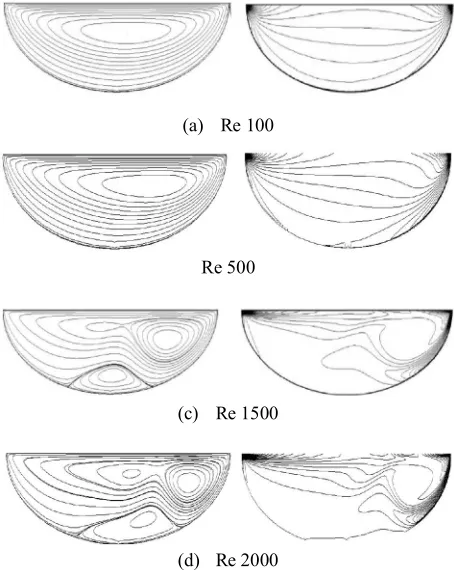
[image:3.612.77.309.285.396.2]the experiment ratio. The initial condition was set be at steady state. Fig 7 below demonstrates the streamlines pattern and the Vorticity contour from Reynolds Number of 100 to 2000. This aspect ratio resembled the depth of a semi-ellipse cavity ratio to length of lid. For Re < 1000, the secondary vortex was absent, which leaves the primary vortex alone. Nevertheless, the center of the primary vortex changes from the center of the cavity to the right of the cavity as the Reynolds number increases.
(a) Re 100
Re 500
(c) Re 1500
(d) Re 2000
Fig 7. Streamline pattern and Vorticity contour for semi ellipse with aspect ratio of 1:2 for various Reynolds numbers.
[image:4.612.311.546.85.182.2]The illustration for location of the primary and secondary vortex is shown below in Table I using stream function value. The primary vortex center location for aspect ratios of 1:2 explained huge changes as the horizontal axis value moved to the left of the cavity as the Reynolds number increases. For the stream function value, the value seems to maintain at -0.029. However the magnitude of the stream function starts to decrease from -0.0324 to -0.0309 for Reynolds number of 1500 and 2000 due to the appearance of the secondary vortex at the bottom of the cavity.
Table I. The primary and secondary vortex center locations and stream function values for aspect ratio of 1:2 with
various Reynolds numbers
B. Comparison with Different Semi Ellipse Shape Cavity Aspect Ratios
In order to compare the effect of Aspect ratio with the increase of Reynolds number, one can determine by visualizing the location the primary center vortex location and the formation of the secondary vortex. From table II, qualitative analysis determines that different aspect ratios give different center location for different Reynolds numbers that were used. These conditions also apply in turbulent as well in laminar model. The primary vortex center location for aspect ratios of 1:2 shows huge changes as the horizontal axis value moved to the right side of the cavity as the Reynolds number increases. This condition was obvious for Reynolds number of 1500 and 2000. As for Reynolds number 100 and 500, there were small changes to the vortex location. Thus, the higher the Reynolds number, the more chance for the particle to change its direction and adjust the particle behavior in the shallow lid driven cavity.
Table II. The primary vortex center locations for Aspect ratio of 1:2, 1:3 and 1:4 with various Reynolds numbers
Re
Aspect Ratio
1:2 1:3 1:4
100 (0.5471,0.1382) (0.5855,-0.2288)
(0.5490,0.0842)
500 (0.6986,0.1382) (0.7138,-0.1200)
(0.7357,0.0842)
1500 (0.7810,0.1382) (0.7357,-0.1200)
(0.7674,0.0900)
2000 (0.8187,0.1382) (0.7571,-0.1200)
(0.7879,0.0842)
C. Transition flow in semi ellipse shape for aspect ratio of 1:2
In order to understand the complex configurations of a lid-driven cavity flow in for semi ellipse shape clearly, the schematic description of the main patterns in this system for Reynolds number 1500 and 2000 is shown in Fig 8 and Fig 9 respectively. In a simple way, these solutions can be divided into two categories. The first categories include flow at the initial condition and second category is the flow
Re Primary vortex center location
Stream function value Ѱ
Secondary vortex center
location
Stream function value Ѱ
100 (0.5471,0.1382)
-0.0294 -
-500 (0.6986,0.1382) -0.0292 -
-1500 (0.7810,0.1382) -0.0324 (0.6091,0.0164 )
0.00009 2
2000 (0.8187,0.1382) -0.0309 (0.6395,0.0631 )
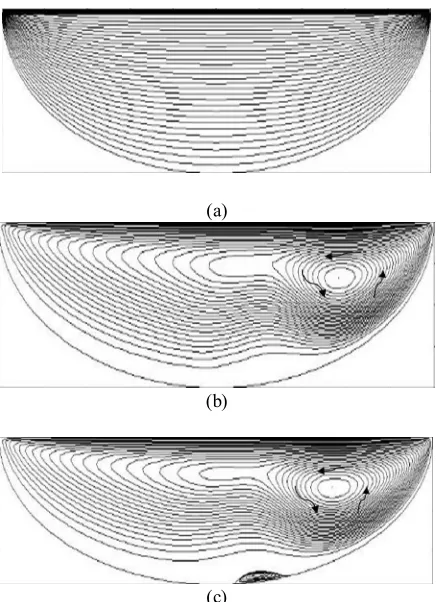
[image:4.612.70.297.172.457.2] [image:4.612.310.541.466.600.2]before it comes to the steady state. The observation of primary eddies and secondary eddies were calculated for 1,500,000 iterations. From the Fig 8 below we can see that primary vortex start to form after 10000 iterations. The primary vortex starts to form at the center and move to the right side of the cavity. As the iteration continues we can see that size of the primary vortex increase. The iteration stops after 15 hours where the primary vortex fully formed at the right side of the cavity in steady state. Further simulation was done to see the changes form in the cavity when using higher Reynolds number.
(a)
(b)
(c)
Fig.8 (a), (b) and (c) Streamline pattern for semi ellipse with aspect ratio of 1:2 in transition state for Re 1500
From the Fig 9 below, the formation of secondary vortex appear only after the 100000 iteration when the system had run for about five hours. The primary vortex starts to form at the right side of the cavity. When the iteration had reach 1500000 for more than eight hours the secondary vortex start to develop at the bottom center of the cavity. As the iteration continues we can see that size of the secondary vortex increase. This phenomenon is mostly due to the occurrence of the secondary vortex rotation, which rotates counter to the primary vortex rotating direction. Thus in this case the secondary vortex acts as an obstacle to the primary vortex.
(a)
(b)
(c)
Fig. 9 (a), (b) and (c) Streamline pattern for semi ellipse with aspect ratio of 1:2 in transition state for Re 2000
VII. CONCLUSION
[image:5.612.319.541.44.380.2] [image:5.612.79.297.187.488.2]ACKNOWLEDGMENT
The authors would like to thank Universiti Malaysia Pahang for providing all the utility and equipment towards the completion of this project.
REFERENCES
[1] C.Migeon., A. Texier and G. Pineau, 2000. “Effects of Lid-Driven Cavity Shape on the Flow Establishment Phase” Journal of Fluids and Structures (2000) 14: 469-488.
[2] C. Migeon, 2002. “Details on the start-up development of the Taylor-Gortler-like vortices inside a square-section lid-driven cavity for 1,000 < Re < 3,200” Experiments in Fluids 33 : 594–602.
[3] N. G. Triantafillopoulos and C. K. Aidun, "Relationship between flow instability in short-dwell ponds and cross directional coat weight nonuniformities,"reprinted from Tappi Journal, vol. 73, No. 6, pp. 127-136, Jun. 1990
[4] J.R. Koseff, R.L. Street, 1984. “The Lid-Driven Cavity Flow: A Synthesis of Qualitative and Quantitative Observations” Journal of Fluid 390/ Vol. 106, DECEMBER 1984
[5] U. Ghia, K. N. Ghia, and C. T. Shin, 1982,”High-Re Solutions for Incompressible Flow Using the Navier-Stokes Equations and a Multigrid Method” Journal of Computational Physics 48: 387-411 (1982).
[6] T.P. Chiang, W.H. Sheuand Robert R. Hwang, 1998 “Effect Of Reynolds Number On The Eddy Structure In A Lid-Driven Cavity “International Journal For Numerical Methods In Fluids, VOL. 26,: 557–579 (1998).
[7] Ercan Erturk and Orhan Gokcol, 2007. “Fine Grid Numerical Solutions of Triangular Cavity Flow” The European Physical Journal – Applied Physics
[8] M. S. Idris, “Steady State Vortex Structure Of Lid Driven Flow Inside Shallow Semi Ellipse Cavity”, Journal of Mechanical Engineering and Sciences, 2, 206-216, (2012).
[9] M. Cheng, K.C. Hung, Vortex structure of steady flow in a rectangular cavity, Computers & Fluids 35 (2006) 1046–1062.
[10] P. Kosinski, A. Kosinska, A.C. Hoffmann “Simulation on Solid Particles Behaviour in a Driven Cavity Flow” Journal of Powder Technology 191: 327-339 (2009)
[11] S. J. Tsorng, H. Capart, J. S. Lai D. L. Young 2007, “Behavior of macroscopic rigid spheres in lid-driven cavity flow” International Journal of Multiphase Flow 34 (2008): 76–101.
[12] N.M.M Ammar, C.S.N. Azwadi, M.S Idris, Particle Movement in Shear cavity Flow In Different Stokes Number Using Lattice Botlzmann Method. International Meeting of Advanced in Thermofluids, Melaka, Malaysia, October 3-4 2011.
[13] N.M.M Ammar, N. Ali , M.S. Idris and A. N. Oumer ,Numerical and Qualitative Analysis of a Single Particle Behavior in a Shear Driven Flow in Equilateral Triangular Cavity. Applied Mechanics and Materials Vols. 465-466 (2014) pp 557-561
[14] Haitice Mercan and Kunt Atalık, 2008. “Vortex formation in lid-driven arc-shape cavity flow at high Reynolds numbers” European Journal of Mechanics B/Fluids 28: 61–71.
[15] M. Guala, A.Liberzon, K. Hoyer, A.Tsinoberand W. Kinzelbach, 2008 “Experimental study on clustering of large particles in homogeneous Turbulent flow” Journal of Turbulence
Vol. 9, No. 34, 2008, 1–20.
[16] X. Chen, L. Debo, K. Luo “Direct Numerical Simulation of Three Dimensional Particle laden plane mixing layer considering inter-particle collisions” Journal of Chemical Engineering Science 66, 6232-6243 (2011)