On Forensics Investigation Models
Eso Dieko, Alese Boniface K., Thompson Aderonke F. and Iyare Otasowie
Abstract- In any court case, the technical expert’s evidence is open to legal challenge and such challenges, irrespective of the outcome, might delay the process of litigation. Hence, it is pertinent that the investigator and expert pre-empt any delay by making the report as comprehensive and complete as possible. The investigator can thus follow a digital forensic process model to aid the digital investigation. The challenge therefore in digital forensics is to find and discover forensically interesting, suspicious or useful patterns within often very large data sets. Consequently, this paper presents a dynamic, adaptive clustering model to arrange unstructured documents into content-based homogeneous groups. The document clustering framework, based on kernel k-means which relies on Radial Basis Function (RBF) has demonstrated can profitably support intelligence and security activities in identifying, tracking, extracting, classifying and discovering patterns, so that the outcomes can generate alert notifications accordingly. Also, the method can generate consistent structures for information access and retrieval.
Index Terms- Forensic, investigation, Radial Basis Function
I INTRODUCTION
he goal of digital forensics is to perform a structured investigation of materials found in digital devices, often in relation to computer crimes and to determine the identity of the criminals. [1] defines forensic as a characteristic of evidence that satisfies its suitability and ability to persuade based upon proof (or high statistical confidence) in public discussion or debate and for admission as fact in courts of judicature. Digital forensics therefore is the use of scientifically derived and proven methods towards the preservation, collection, validation, identification, analysis, interpretation and presentation of digital evidence derived from digital sources for the purpose of facilitating and furthering the reconstruction of events found to be criminal or aiding to anticipate the unauthorized actions shown to be disruptive to planned operations [2].
Manuscript received March 20, 2014; revised April 3, 2014.
Eso Dieko. is with Department Computer Science, Federal University of Technology, Akure, Nigeria. Phone: +2348034819325 Email:
Alese Boniface Kayode. is with the Department Computer Science, Federal University of Technology, Akure, Nigeria. Phone:
+2348034540465. Email: [email protected]
Thompson Aderonke Favour-Bethy is with the Department Computer Science, Federal University of Technology, Akure, Nigeria. Phone:
+2348034540465. Email: [email protected]
Iyare Otasowie. is with the Department Computer Science, Federal University of Technology, Akure, Nigeria. Phone: +2347033513174.
Email: [email protected]
One vital element of digital forensics is the credibility of the digital evidence. Forensic imaging is becoming more diverse. The areas in which imaging is being used include fingerprints, footwear and tire impressions, ballistics, tool marks, accident scenes, crime scene reconstruction, documentation of wounds or injuries, surveillance videos, and many others. Anyone can snap a picture or record an event with a digital camera and produce an image rather easily using the available software. Being able to analyse contents of digital devices especially images, whether they depict accurately what they are intended to portray is a whole different responsibility. A number of complex tools must be used to analyse an image and testify that it has not been tampered with or the image distorted in a way that can skew the interpretation of the image. The expert must then be able to explain the basis for selecting the tools used, the order in which they were used and why the judge or jury should believe that these tools were the best and most appropriate to use in the analysis in question. The use of digital evidence has accrued in the past few decades as courts have allowed the use of digital artefacts such as e-mails, digital photographs, ATM transaction logs, word processing, documents, deleted files, instant message histories, files saved from accounting programs, spreadsheets, internet browser histories, databases, the contents of computer memory, computer backups, computer printouts, Global Positioning System tracks, logs from a hotel’s electronic door locks, digital video and audio files.
Mobile devices such as, cell phones and Personal Digital Assistance (PDAs) or smart phones have increasing computational power which afforded their countless uses; with that, greater potential for their misuse. For instance, some mobile devices are optimized for data acquisition such as credit card scanning and scientific measurements (e.g., voltage, temperature, acceleration). This flexibility has ramifications beyond the manufacturer’s intentions, as mobile devices have not only been used to steal credit cards but also to trigger bombs [3].
II FORENSIC CHALLENGES
A number of challenges must be addressed in the process of developing a framework for digital forensics analysis.
A Evidence Selection
bank does not leave its vault unguarded and high-ranking public officials in the United States; as it is custom in other countries also, are provided with Secret Service protection since they are likely targets of attack.
Extant legislation already provides relevant guidelines. The publicly-traded companies for instance need information flow controls to comply with the Sarbanes-Oxley Act [4]. Also, healthcare providers need data privacy protection to comply with the Health Insurance Portability and Accountability Act (HIPAA) [5] and financial service firms and educational institutions have to safeguard personal information to comply with the Gramm-Leach-Bliley Act [6].
B Forensic Analysis
Every crime leaves fragments of evidence. It is up to an investigator to piece the fragments together and create a hypothesis of what transpired. In so doing, the investigator must process the evidence and draw conclusions about the likelihood that the hypothesis is correct. For the operations to be considered forensically sound, at the very least, they must be reproducible by the opposing counsel’s experts. Consequently, a framework for analysing evidence and reasoning about evidence must be agreed upon by all parties. An operation is accepted as invertible, its input and output can be compared and checked for consistency. Any inconsistency can serve as grounds for having evidence discarded. In contrast, if an operation is not deemed to be invertible and the output is unimpeachable, then the absence of consistency between an input and output would not be grounds for eliminating the input from consideration as evidence.
Operations must be repeatable in order to meet the Daubert standard for scientific evidence. A digital forensic system must be designed to allow efficient distinctions to be made about which evidentiary properties are satisfied. For example, if a piece of evidence was derived using randomness, user input or network data, its legal admissibility will differ from the content that can be completely recomputed when persistent files are used as inputs.
C Chain of Custody
When a piece of evidence is to be presented in a court, the chain of custody of the evidence must be established to guarantee that it has not been tampered with. The process makes two assumptions that do not hold by default in the virtual world. The first is that the evidence was not altered from the time it was created to the time it was collected. In a world where data is rapidly combined to produce new content, it is likely that the data found during an investigation would have undergone editing operations before it was collected as evidence. The second erroneous assumption is that a piece of evidence was created by a single individual. A virtual object is much more likely to have multiple co-authors. Note that a co-author is a principal who owns one of the processes that operated on any of the data used to create the object in question.
In principle, these issues can be addressed by designing software functionality that transparently annotates data with the details of its provenance. If the metadata generated is imbued with non-repudiate authenticity guarantees, it can serve as forensic evidence to establish a chain of custody. A
policy verification engine can be used to infer the set of co-authors of a piece of data by inspecting a set of metadata provided as an input.
D Formal Framework
The utilization of a formal framework with an explicitly defined logic has a number of advantages over ad hoc analysis of digital evidence.
i Standardization
The set of laws that govern forensic evidence handling and inference can be codified in the rules of the logic. The variations and precedents of each legal domain, such as a state or county, can be added as a set of augmenting axioms and rules. In particular, such standardization allows the prosecution and the defence to determine before trial what conclusions will likely be drawn by expert witnesses in court. Further, the significance of a digital artefact can be tested by checking which conclusions are dependent upon it. Thus, standardization may decrease the time to arrive at an agreement in court about which conclusions can be drawn given a body of digital evidence.
ii Automation
A framework that is completely defined by a formal logic can serve as a technical specification for implementing a forensic inference engine in software. In the physical world, the number of pieces of evidence introduced in court may be limited. In contrast, the number of pieces of digital evidence that may need to be utilized to draw a high-level conclusion may be significantly larger. In either case, as the number of elements that must be assembled to draw a conclusion increases, the effort to construct a sound inference grows exponentially. Automating the process will become necessary to ensure that the cost of using a body of digital evidence remains affordable in cases where the plaintiff or the defendant has a limited budget.
iii Soundness
Automating the process of generating non-repudiate digital artefacts in software is likely to generate large bodies of digital evidence usable in a court of law. If the evidence must be manually assembled into a chain of inference, the likelihood of erroneous conclusions could be significant. All the pieces of evidence must be arranged into a plausible timeline, requiring numerous alternative orderings to be evaluated. Further, certain conclusions can be ruled out because the supporting evidence may be contradictory, such as being predicated on a person in two loca- tions at a time. Manually verifying complex properties is likely to introduce errors that may be too subtle to identify without investing substantial resources. Automating the forensic inference process with an explicit formally defined framework guards against the introduction of such errors and ensures that the conclusions are sound.
iv Completeness
inference system to justify setting aside an argument on the grounds that it does not follow from the evidence.
Given a set of elements corresponding to the digital evidence and a decisive logic, an automated theorem that proves can generate a sequence of all possible theorems, each corresponding to a conclusion for which a proof is available. A lawyer can examine the theorems (after filtering using suitable constraints if there are too many to inspect) to see if any of them either corroborate a hypothesis or to search for new hypotheses not previously considered. Having exhausted the set of theorems produced, the lawyer will be assured of not missing any possible line of argument using the available evidence. [7]
III EXISTING MODELS
A The PIDESC Model
Many authors highlighted by Shahzad et al [8] have discussed several vulnerabilities and methods to forge integrity of collected and archived digital evidence. Message digests alone are not enough to ensure integrity, as one can forge them. The essence and hence, the core of the protecting digital evidence integrity by using smart cards (PIDESC) model is the use of smart cards technology for keeping or maintaining and using digital credentials securely while conducting forensic examination.
[image:3.595.42.288.487.628.2]The fundamental security assumption in the model is that the loss of smart card will not go undetected. First, it is really hard for an adversary to steal digital credentials from a smart card without stealing the card itself. Moreover, if someone succeeds in stealing a card without being noticed then its absence should be felt by its legitimate user soon enough. The legitimate user can then revoke the keys inside the lost card thus rendering the card useless for any future use
Table 1: Current practices Analysis and PIDESC model
From the evaluation Table 1, the PIDESC model provides better integrity protection as compared with digital hashes and signatures. The experiments and the analysis carried out also showed that there is almost no increase in time complexity of the computational requirements (for generating digital signature on 128 bits of SHA1 output) compared to current practices (that is the time required to generate digital hash for 8 and 2 GB USB drives).
With a very modest additional cost, the PIDESC model can provide better protection to the integrity of digital evidence along with an additional non- repudiation service, and thus better conformity to the Requests for Comments
(RFC) 3227 [9] and International Organization on Computer Evidence (IOCE’s) guidelines [10].This indicates that it is: (a) Easy for an examiner to operate the tool because of automation.
(b) Less prone to human errors. (c) Provides precise results.
(d) Fairly open to reviews for consistency, precision and accuracy, which will result in trustworthy digital evidences. There are also additional benefits, or some extra information while generating digital signature such as when, where and who interacted with the digital evidence. This makes repudiation harder and attribution easier.
B The Semantic Model
Statistical procedures such as discriminant and regression analysis are traditionally used for information extraction and data analysis in digital investigations. The study of the extracted information may help facilitate the task of report writing, evidence communication and presentation more efficiently and effectively.
Management of digital evidence begins with data acquisition, identifying a selective strategy for data acquisition is not the stated purpose for the digital evidence management problem. RFC 3227 [11] and IOCE’s guidelines [12] describe the procedures of forensic examination with emphasis on gathering and preserving digital evidence.
Extraction of knowledge from raw textual data is done by first processing pure text to obtain groups of documents with similar content. The core clustering strategy employed here exploits a kernel-based version of the conventional k-means algorithm. The present implementation relies on a Radial Basis Function (RBF) kernel-based mapping.
Semantic model presents results from digital investigative tools are explained utilising DIALOG ontology. The hierarchical vocabulary provides context to the findings and allows the semantics and meaning of the results to be explicitly encoded. The Digital Forensic Absolute Semantic Similarity Value (DFASSV) is a novel approach of using the web to measure semantic similarity between two terms in the digital forensic domain, hence the adoption of DFASSV
C Knowledge Base Representation
The text mining method described uses a conventional content-based similarity metric and a behavioural similarity criterion. This information extraction (IE) model is designed to pre-process digital text documents and to organize the information according to a given structure that can be directly interpreted by a machine learning system.
In the system, D = {Du; u = 1, ..., nD} denote the corpus holding the collection of documents. The set T = {tj; j = 1, …, nT} denote the vocabulary, which is the collection of terms that occur at least one time in D after the pre-processing steps of each document DϵD. A pair of vectors; vꞌ and vꞌꞌ, represent a document by a classical vector model. vꞌ(D) addresses the content description of the document D
and vꞌꞌ(D) addresses the behavioural and style features analysis of document D.
D Hybrid Distance and Clustering
Vector vꞌ(D), can be viewed as the conventional nT – dimensional vector that associates each term t ϵT with the
Digital Hash Only Digital Hash with Symmetri
c
Encryption Digital Hash with Asymmetri c Encryption Digital Signature with Smar
t
Cards
Upfront Cost + + + + + + + +
Operational Cost
+ + + + + + + +
Time + + + + + +
Integrity Protection
+ + + + + + + + + +
Non – Repudiation
normalized frequency, tf, of that term in the document D. Therefore, the k-th element of the vector vꞌ(D) is defined as:
vꞌk, u = tfk, u ∑ t l, u (1)
Where tfk, u is the frequency of the k-th term in document Du.
E Kernel k – Means
The conventional k-means paradigm supports an unsupervised grouping process which partitions the set of samples, D = {Du; u = 1, ..., nD}, into a set of Z clusters or blobs, Cj (j = 1,…, Z). In practice, a membership vector is defined which indexes the partitioning of input patterns over the K clusters as mu = j ⇔Du ∈ Cj, otherwise mu 0; u = 1, …, nD. It is also useful to define a membership function uj (Du, Cj), that defines the membership of the u-th document to the j-th cluster: uj = 1 if mu j, and 0 otherwise. Hence, the number of members of a cluster is expressed as
N j = ∑ δuj ; j = 1,…, Z ; (2) and the cluster centroid is given by:
W j = ∑ uj ; j = 1,…, Z; (3) where Xu is any vector-based representation of document Du.
The kernel based version of the algorithm is based on the assumption that a function, ∅, can map any element, D, into a corresponding position, ∅(D), in a possibly infinite dimensional Hilbert space. The mapping function defines the actual ‘kernel’, which is formulated as the expression to compute the inner product;
K (Du, Dv) = Ku v = (Du). (Dv) def = u . v . (4)
[image:4.595.51.291.409.592.2]IV SYSTEM DESIGN AND IMPLEMENTATION
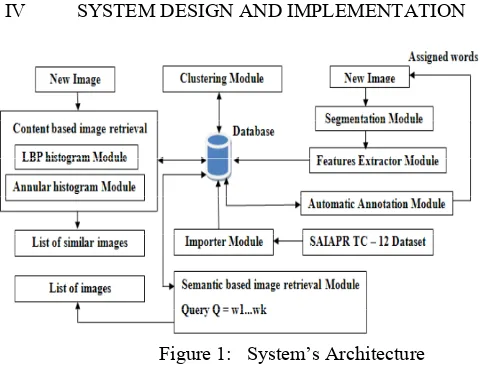
Figure 1: System’s Architecture
A System Overview
The annotation process implemented in this system is based on Cross Media Relevance Model (CMRM). Using a set of annotated images, the system learns the joint distribution of the blobs and words. The blobs are clusters of image regions obtained using the weighted K-means algorithm. Having the set of blobs, each image from the test set is represented using a discrete sequence of blob identifiers. The distribution is used to generate a set of words for a new image.
Each new image is segmented using a segmentation algorithm which integrates pixels into a grid-graph. The usage of the hexagonal structure improves the time complexity of the methods used and the quality of the segmentation results. Mihai G., et al [13] designed a similar
annotation system to handle the annotation task for images retrieved from two distinct sets: a set of images from medical domain and a set of images from nature. The approach can be extended in a similar way for other sets. For this reason, the digital forensic ontology, DIALOG can be created as a custom ontology to form one of the distinct sets. The segmented and annotated SAIAPR TC-12 [14] benchmark was used for the evaluation of automatic image annotation method and for studying their impact on multimedia information retrieval.
Easy computation and a broad applicability for a wide range of images are two main advantages colour histograms offer when used for content based image retrieval. The main drawback is that histograms capture only global colour distributions of the images and there is a lack of information about the spatial relationship among images’ colours. It is highly possible that two images with similar colour histograms have a very different spatial appearance causing false positives. Therefore, considering the spatial information is necessary and beneficial, since the content of images is indexed in a limited way using only colour histograms. This combination has led to effective techniques for content-based image retrieval tasks based on the new spatial colour histogram.. The content based image retrieval system supports Query-By-Example. The system is designed and implemented on the Microsoft Windows XP Home edition using Microsoft Visual Basic 6.0. As for the database, Microsoft SQL Server 2000 is used. This system also supports recent versions of Microsoft Visual Basic and Microsoft SQL Server.
B System’s Architecture
The system’s architecture presented in Figure 1 contains 9 modules:
a) Importer module – This module is used to extract the existing information in the SAIAPR TC-12 dataset. Having available segmentation’s mask for each image’s region this module detects the pixels that belong to that region. By parsing the content of the features.txt file, the module extracts a list of feature vectors that are stored in the database. These feature vectors are clustered by the Clustering module for obtaining a list of blobs.
b) Segmentation module – This module is using the segmentation algorithm to obtain a list of regions from each new image.
c) Features extractor module - This module is using the regions detected by the Segmentation module. For each segmented region, a feature vector is computed that contains visual information of the region such as area, boundary/area, width and height of the region, average and standard deviation in x and y, convexity, average, standard deviation. All feature vectors obtain are stored in the database in order to be accessible for other modules.
computed and a list of words that were assigned to the test images that have that blob in their representation.
e) Automatic annotation module - For each region belonging to a new image, it is assigned the blob which is closest to it in the cluster space. The assigned blob has the minimum value of the Euclidean distance computed between the median feature vector of that blob and the feature vector of the region. In this way the new image will be represented by a set of blobs identifiers. Having the set of blobs and for each blob having a list of words, it is possible to determine a list of potential words that can be assigned to the image. What needs to be established is which words better describe the image content. This can be made using formulas (3.19) and (3.20) of the Cross Media Relevance Model. The probability of each word to be assigned to the image is computed and after that, the set of words having a probability greater than a threshold value will be used to annotate the image. The DFASSV implementation can also be integrated into the annotation process or can serve as a separate module to determine the most relevant and appropriate terminologies to use most especially when building a specific ontology (such as DIALOG) using the custom approach.
f) Annular histogram Module – This is used to compute the annular histogram and the distribution density vector. As described earlier, for this type of histogram the HSV space dimensions were split: H- 8 bins, V- 4 bins and C - 4 bins obtaining in this way a histogram of 8x4x4 = 128 bins. The first step in this module computes the histogram using the information extracted from the image. After the process completes for each histogram bin, it computes the distribution density vector having a dimension of 16. These vectors are concatenated to obtain a single density vector having a dimension of 128×16 = 2048 that is stored in the database.
g) LBP histogram Module - This module computes a histogram of rotational invariant local binary patterns. For this system, it used a histogram of patterns having 37 bins (36 bins for the rotation invariants and one bin for the rest of the patterns) and a method based on NBS distance for computing the pattern code: the NBS distance is computed between the colour components of the centre pixel and the colour components of a neighbour pixel; if the distance is greater than 3 (remarkably different colours) then we have 1, otherwise 0. This way the binary representation of the pattern and the number associated with the pattern using a transformation from base 2 in base 10 is obtained. The histogram of patterns is normalized. The resulted content is stored in the database.
h) Content based image retrieval - this module computes a distance D having two components:
D1 – the Euclidian distance between the density vector of the analysed image and a density vector corresponding to an image already processed.
D2 - a distance equal with 1 – HI, where HI is the histogram intersection between the histogram of patterns of the analysed image and the histogram of patterns corresponding to an image already processed. The value of D is obtained as:
D = Sqrt (D12 + D22) (5)
where D2 = 1 – HI
For each input image it is returned a list of similar images having the value of the distance D smaller than a threshold value which is configurable.
i) Semantic based image retrieval – This module is using the two types of semantic based image retrieval provided by CMRM against a query Q = w1...wk. The result is a list of n images containing objects described by the words w1... wk.
V RESULTS INTERPRETATION
A The Reuters Database Benchmark
In this study, for simulating an investigational context, a standard benchmark for content-based document management, the Reuters database provided the experimental domain for the RBF kernel-based mapping for clustering framework. The database includes 21,578 documents, which appeared on the Reuters newswire in 1987. One or more topics derived from economic subject categories have been associated by human indexing to each document; eventually, 135 different topics were used. In this work, the experimental session involved a corpus DR including 8267 documents out of the 21,578 originally provided by the database. The corpus DR was obtained by adopting the criterion used in [15]. First, all the documents with multiple topics were discarded. Then, only the documents associated to topics having at least 18 occurrences were included in DR. As a result, 32 topics were
represented in the corpus.
In the following experiments, the performances of the clustering framework have been evaluated by using the purity parameter. Let Nk denote the number of elements
lying in a cluster Ck and let Nmk be the number of elements
of the class Imin the cluster Ck. Then, the purity pur(k) of
the cluster Ckis defined as follows:
pur(k) = max (Nm k) . (6)
Accordingly, the overall purity of the clustering results is defined as follows:
purity = ∑ . pur(k) , (7) where N is the total number of element. The purity parameter has been preferred to other measures of performance (e.g. the F-measures) since it is the most accepted measure for machine learning classification problems [16].
The clustering performance of the proposed methodology was evaluated by analysing the result obtained with three different experiments: the documents in the corpus DR were partitioned by using a flat clustering
paradigm and three different settings for the parameter ∝, which, as per (3.5), the relative contribution of ∆ (f) and ∆ (b) in the document distance measure. The values used in the experiments were ∝ = 0.3, ∝ = 0.7 and ∝ = 0.5; thus, a couple of experiments were characterized by a strong preponderance of one of the two components, while in the third experiment, ∆ (f) and ∆ (b) evenly contribute to the eventual distance measure.
the overall purity, purityOV, of the clustering result;
the lowest purity value pur(k) over the Z clusters;
the highest purity value pur(k) over the Z clusters;
the number of elements (i.e. documents) associated to the smallest cluster.
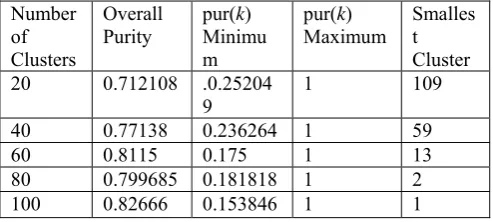
[image:6.595.46.293.203.314.2]Analogously, Tables 3 and 4 report the results obtained with ∝= 0.5 and ∝= 0.7, respectively.
Table 2: Clustering performances obtained on Reuters-21578 with ∝ 0.3
Number of Clusters
Overall
Purity pur(Minimuk) m
pur(k)
Maximum Smallest Cluster
20 0.712108 .0.25204
9
1 109
40 0.77138 0.236264 1 59
60 0.8115 0.175 1 13
80 0.799685 0.181818 1 2
[image:6.595.46.296.345.447.2]100 0.82666 0.153846 1 1
Table 3: Clustering performances obtained on Reuters – 21578 with ∝ = 0.5
Number of Clusters
Overall Purity
pur(k) Minimum
pur(k) Maximum
Smallest Cluster
20 0.696383 0.148148 1 59
40 0.77138 0.236264 1 4
60 0.809121 0.181818 1 1
80 0.817467 0.158333 1 1
100 0.817467 0.139241 1 2
Table 4: Clustering performances obtained on Reuters – 21578 with ∝ = 0.7
Number of Clusters
Overall Purity
pur(k) Minimum
pur(k) Maximum
Smallest Cluster
20 0.690577 0.145719 1 13
40 0.742833 0.172638 1 6
60 0.798718 0.18 1 5
80 0.809483 0.189655 1 2
100 0.802589 0.141732 1 4
Table 5: Semantic Similarity Ratings of Digital Forensic Terms Based on DFASSV
According to Table 5, a part of the experimental findings is presented using the digital forensics domain terminologies. The selected terms are terms mostly used in discussions that involve the digital forensic investigation process and also in the accreditation of digital forensics laboratories. The terms ‘Digital evidence’ and ‘Electronic evidence’, for example, with a similarity measure of 0.059217 indicates that they can be used interchangeable without causing confusion to the stakeholders. On the other hand a semantic similarity measure far from 0 would mean that the two terms are not closely related in meaning and therefore, one cannot replace the other. For example the terms ‘Digital forensics’ and ‘Digital and multimedia evidence’ with a similarity value of 2.324592 means they cannot be used interchangeable.
There is no knowledge however, of other experiments of this kind in the digital forensic domain that can be used as a baseline to judge the performance of DFASSV. Using the results in this table, a random interview was conducted to a few digital forensics researchers and their understanding of these terms seemed to agree with the results of the proposed DFASSV method. This is therefore a novel approach of using the Web search engine to determine the semantic similarity of terms in digital forensics.
B System’s Evaluation
[image:6.595.39.561.486.779.2]In order to evaluate the annotation system, a testing set of 400 images was used that were manually annotated and not included in the training set used for the CMRM model. This set was segmented using the original segmentation algorithm described above and a list of words having the joint probability greater than a threshold value was assigned to each image. Then the number of relevant words automatically assigned by the annotation system was compared against the number of relevant words manually assigned by computing a recall value. Using this approach for each image, a statistical evaluation having the following structure was obtained:
Table 6: RWAA versus WMA
f(x) f(y)
Digital evidence Electronic evidence 0.059217 Digital forensics Digital evidence 0.431534 Digital forensics Electronic evidence 0.490752 Electronic
evidence Digital and multimedia evidence 1.833840 Digital evidence Digital and multimedia
evidence 1.893057
Digital evidence Digital and multimedia
evidence 2.324592
Attacker Adversary 0.357051
Cracker Attacker 0.361608
Index Image Relev
ant
words autom
ati
cal
l
y assigned (RWAA) Words manua
lly
assigned (WMA) Reca
ll =
RWAA /WMA
0 sky-blue,
After computing the recall value for each image, a medium recall value equal to 0.73 was obtained. The values of the smoothing parameters determined after experiments for the Cross Media Relevance Model were α = 0.1 and β = 0.9.
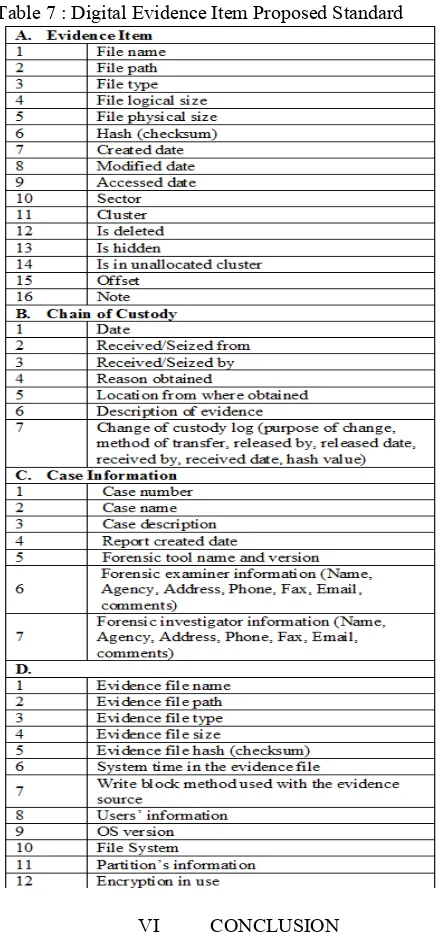
[image:7.595.307.528.64.534.2]C Standard for Reporting Digital Evidence Items When an investigator uses different forensic tools, he/she may face difficulties in integrating evidence items from software-generated reports into the official investigation report (Figure 2) that could be presented to attorneys or clients.
Figure 2: Digital Investigation Report
Therefore; the importance of defining a standard, open format for digital evidence provenance, both for description and comparison of particular pieces of evidence, as well as for tool interoperability and validation cannot be over emphasized [17].
[18] surveyed and analysed the reporting function of computer forensic software tools, which are: FTK .v1.71, ProDiscover .v5.5 and Encase .v6 to formulate the data requirements for digital evidence items. Based on the findings, and the views of the digital forensics community, an XML Schema for a proposed XML standard format for reporting digital evidence items in computer forensic tools was defined. This XML standard could be used to facilitate the merger of digital evidence items into a single report by digital forensics practitioners when utilizing multiple computer forensic tools.
The proposed standard for digital evidence items includes data about the case, the evidence source, evidence item, and chain of custody. As a result, the defined XML schema for digital evidence items was created in such a way it can be extended to incorporate other data objects if an investigator has to include information, which is considered a new data object for digital evidence items. XML schema were generated for the standard defined in Table 7.
[image:7.595.46.296.209.393.2]In this work, this standard is implemented to combine reports generated from the digital forensic tools used into an official investigation report.
Table 7 : Digital Evidence Item Proposed Standard
VI CONCLUSION
REFERENCES
[1] Eoghan C.: Digital Evidence and Computer Crime. Academic Press, San Diego, CA, second edition, 2004. [2] Gary L., P.:. A Road Map for Digital Forensic Research.
Technical Report DTR-T0010-01, DFRWS. Report for the First Digital Forensic Research Workshop (DFRWS). 2001 [3] Wilson, C.: Improvised Explosive Devices (IEDs) in Iraq:
Effects and Counter Measures. In: Congressional Research Service Report for Congress. Available from
http://www.history.navy.mil/library/online/ied.htm
[4] U.S. Government, Sarbanes-Oxley Act, Public Law 107–204, 107th Congress, United States Statutes at Large, vol. 116(1), pp. 745–810, 2003.
[5] U.S. Government, Health Insurance Portability and Accountability Act, Public Law 104–191, United States Statutes at Large, vol. 110(3), pp. 1936–2103, 1997.
[6] U.S. Government, Gramm-Leach-Bliley Act, Public Law 106–102, 106th Congress, United States Statutes at Large, vol. 113(2), pp.1338–1481, 2000.
[7] Ashish G., Florent K., and Natarjan S. (2009): System Support For ForensicInference. Advances in Digital Forensics V, IFIP AICT 306, pp. 301–316, 2009.
[8] P. Duygulu, K. Barnard, N. de Freitas, D. Forsyth, Object recognition as machine translation: Learning a lexicon for a fixed image vocabulary. In Seventh European Conf. on Computer Vision, pp. 97–112, 2002.
[9] Jeon J., Lavrenko V., R. Manmatha, Automatic Image Annotation and Retrieval using Cross-Media Relevance Models. In: Proceedings of the 26th Intl. ACM SIGIR Conf., pp. 119–126, 2003.
[10] Shahzad S., and Oliver P.: Protecting Digital Evidence Integrity by Using Smart Cards. Baggili (Ed.): ICDF2C 2010, LNICST 53, pp. 110–119, 2011. © Institute for Computer Sciences, Social Informatics and Telecommunications Engineering 2011.
[11] Brezinski D., Killalea T.: RFC3227: Guidelines for Evidence Collection and Archiving. RFC Editor United States (2002). [12] International Organization on Computer Evidence (IOCE),
Guidelines for best practice in the forensic examination of digital technology, Orlando (2002).
[13] Gabriel M., Liana S., Dumitru D. B., and Marius B.: Custom Ontologies for an Automated Image Annotation System. A. König et al. (Eds.): KES 2011, Part I, LNAI 6881, pp.505-515, 2011. © Springer-Verlag Berlin Heidelberge 2011 [14] H. Jair Escalante, C. A. Hernández, J. A. Gonzalez, A.
López-López, M. Montes, E. F. Morales, L. Enrique Sucar, L. Villaseñor and M. Grubinger, The segmented and annotated IAPR TC-12 benchmark, Computer Vision and Image Understanding, Volume 114, Issue 4, pp. 419-428, 2010
[15] Cai. D., He X., Han J.: Document Clustering Using Locality Preserving Indexing. IEEE Transaction on knowledge and data engineering 17, 1624–1637 (2005)
[16] Manning, C.D., Raghavan, P., Schütze, H.: Introduction to Information Retrieval. Cambridge University Press, Cambridge (2008)
[17] Levine, B., Liberatore, M.: DEX: Digital evidence provenance supporting reproducibility and comparison. Digital Investigation 6, S48–S56 (2009)