http://wrap.warwick.ac.uk/
Original citation:
Lindsay, Geoff and Strand, Steve. (2013) Evaluation of the national roll-out of parenting
programmes across England : the parenting early intervention programme (PEIP). BMC
Public Health, Volume 13 (Number 1). Article number 972.
Permanent WRAP url:
http://wrap.warwick.ac.uk/59114
Copyright and reuse:
The Warwick Research Archive Portal (WRAP) makes this work of researchers of the
University of Warwick available open access under the following conditions.
This article is made available under the Creative Commons Attribution- 2.0 Unported
(CC BY 2.0) license and may be reused according to the conditions of the license. For
more details see
http://creativecommons.org/licenses/by/2.0/
A note on versions:
The version presented in WRAP is the published version, or, version of record, and may
be cited as it appears here.
R E S E A R C H A R T I C L E
Open Access
Evaluation of the national roll-out of parenting
programmes across England: the parenting early
intervention programme (PEIP)
Geoff Lindsay
1*and Steve Strand
2Abstract
Background:Evidence based parenting programmes can improve parenting skills and the behaviour of children exhibiting, or at risk of developing, antisocial behaviour. In order to develop a public policy for delivering these programmes it is necessary not only to demonstrate their efficacy through rigorous trials but also to determine that they can be rolled out on a large scale. The aim of the present study was to evaluate the UK government funded national implementation of its Parenting Early Intervention Programme, a national roll-out of parenting
programmes for parents of children 8–13 years in all 152 local authorities (LAs) across England. Building upon our study of the Pathfinder (2006–08) implemented in 18 LAs. To the best of our knowledge this is the first
comparative study of a national roll-out of parenting programmes and the first study of parents of children 8–13 years.
Methods:The UK government funded English LAs to implement one or more of five evidence based programmes (later increased to eight): Triple P, Incredible Years, Strengthening Families Strengthening Communities, Families and Schools Together (FAST), and the Strengthening Families Programme (10–14). Parents completed measures of parenting style (laxness and over-reactivity), and mental well-being, and also child behaviour at three time points: pre- and post-course and again one year later.
Results:6143 parents from 43 LAs were included in the study of whom 3325 provided post-test data and 1035 parents provided data at one-year follow up. There were significant improvements for each programme, with effect sizes (Cohen’sd) for the combined sample of 0.72 parenting laxness, 0.85 parenting over-reactivity, 0.79 parent mental well-being, and 0.45 for child conduct problems. These improvements were largely maintained one year later. All four programmes for which we had sufficient data for comparison were effective. There were generally larger effects on both parent and child measures for Triple P, but not all between programme comparisons were significant. Results for the targeted group of parents of children 8–13 years were very similar.
Conclusions:Evidence-based parenting programmes can be rolled out effectively in community settings on a national scale. This study also demonstrates the impact of research on shaping government policy.
Keywords:Parenting programme, Evidence based practice, Effectiveness trial, National roll-out, Triple P, Incredible years, Strengthening families strengthening communities, FAST, Strengthening families programme 10-14
* Correspondence:[email protected] 1
Centre for Educational Development, Appraisal and Research (CEDAR), University of Warwick, Kirby Corner Road, Coventry CV4 7AL, UK Full list of author information is available at the end of the article
Background
The implementation of parenting programmes has be-come an important part of the support provided by pub-lic health and education services to assist parents in bringing up their children. Evidence based parenting programmes provide a well-established means of in-creasing the prevalence of nurturing environments for children, both to promote positive behaviours and to prevent the development of behavioural, emotional and social difficulties (BESD) [1]. In terms of public policy, the issues include whether to support the implementa-tion of parenting programmes and, if so, by what means. In particular, a key policy decision concerns whether to target specific groups at risk or to implement a universal intervention aimed to bring benefits to the whole popula-tion. The present paper examines the UK Government’s national implementation of a targeted initiative of national support for evidence based parenting programmes for children with, or at risk of developing, BESD, the Parent-ing Early Intervention Programme (PEIP). The PEIP was implemented in all 152 local authorities (LAs) throughout England (2008–11). The paper builds on our earlier report of the evaluation of the Pathfinder implemented in 18 LAs (2006–08) [2].
Evidence based practice is dependent upon several fac-tors: i) that interventions are effective; ii) that a policy has been approved for implementation on a specified scale: local, regional or national; iii) that there are sys-tems for ensuring that practitioners and policy makers concerned with implementation have the necessary skills and knowledge to interpret the evidence, and have ne-cessary implementation skills; iv) a supportive context to host the implementation; v) recognition by policy ma-kers of the potential benefits of addressing the iden-tified problem balanced against cost and competing priorities; vi) the political will to implement this specific intervention, providing appropriate resources and support.
There is now a substantial evidence base for the effi-cacy of parenting programmes to address children’s BESD, which pose a substantial challenge to individual parents [3] and society as a whole [4]. Reviews have been conducted of specific programmes, such as the meta-analysis by Nowak and Heinrichs [5] of Triple P and sys-tematic reviews of a range of parenting programmes [6-10]. Organisations have also developed criteria for de-termining which parenting programmes meet acceptable evidence standards for recommendation to practitioners, including the United Nations Office on Drugs and Crime (UNODC) [11] and the National Academy of Par-enting Research in England [12].
In order that a public policy of implementing evidence based parenting programmes can be delivered suc-cessfully, several stages of development and evidence
creation are necessary. First, the parenting programme must be based on sound theoretical underpinnings for which there is an existing evidence base [11]. Second, a programme must be created based on these theoretical principles and that evidence base, together with an ef-fective framework for implementation. The latter should include systems of ensuring access to the target popula-tion, effective recruitment and retention. Third, initial studies will test out developments that will lead to the trial version of the programme. Fourth, an efficacy trial that meets accepted quality standards, for example those of the Society of Prevention Research [13], will be required to establish that the programme produces im-provements in the target behaviours: improved parenting skills and improved child behaviour as the primary ob-jectives. Other secondary impacts, such as improve-ments in parental mental well-being or reduction in depression, may also be included [14]. Furthermore, effi-cacy trials will be required to demonstrate that short term improvements from pre- to post-course are maintained over longer periods of time.
Fifth, independent efficacy studies are advised in order to demonstrate generalisability of effects beyond trials run by the programme originator. These are important as there is evidence that independent trials show much smaller, or even no effects, compared with trials by the originator [15]. Sixth, programme implementation must be examined by efficacy trials in real world, community settings through efficacy trials. Finally, there is benefit in studying whether the improvements shown in the effi-cacy trials, whether research- or community-based, are maintained when implementation is scaled up: an effect-ivenesstrial. At this point the intensity of commitment, oversight and support provided by the originator and any dedicated research team, as in earlier levels of this process, is much reduced. Also, many more staff must be recruited and trained, and a larger organisation to manage and support the implementation is necessary. Nevertheless, this research and development phase is crucial to ensure that effects are maintained when the programme is implemented on the scale necessary for public health and education policy.
in public policy settings and limited evidence of its suc-cess [18]. Kothari and Armstrong argue for the import-ance of collaboration within and across organisations.
One important strategy to enhance knowledge transfer of evidence-based programmes is the delivery of training of the parenting group facilitators by the programme staff, either by the programme developers or by staff trained by the programme team. Some established par-enting programmes, as used in the present study, have developed rigorous training systems which they deliver to organisations wanting to use their programmes. In addition, the programmes are manualised to have stand-ard course design, content and procedures. Teaching and learning materials are also provided, including DVDs to provide examples for discussion and to support teaching parents, and parent homework materials to support consolidation of learning.
Scaling up may be implemented in different ways. For example, local agencies may determine to implement a parenting programme, or a superordinate agency may take a policy decision which is then implemented at local level. Olds [19] provides an example of the former. Following positive evidence of the Nurse-Family Partner-ship programme, Olds and colleagues set up the National Center for Children, Families and Communi-ties, with the purpose of supporting the development with fidelity of implementation of the programme in new communities, with fidelity. Many evidence-based parenting programmes provide comparable approaches, limiting the implementation of the programme to those who have undergone specified training. In each case the programme organisations have put a high value on scientific integrity, with methods to optimise training (and hence determine which practitioners are able to im-plement the programme) and the fidelity of imim-plementa- implementa-tion. The PEIP was implemented following a policy driven decision at national level by the UK Govern-ment’s Department for Children, Schools and Families (DCSF) for England, now the Department for Education (DfE), to fund parenting programmes in all English LAs and to use the programmes’ personnel to implement training of group facilitators.
The DCSF developed its implementation of parenting programmes as part of a broader policy agenda seeking to address behavioural difficulties including delinquency in young people: The Respect Action Plan [20]. A three stage development took place, although this comprehen-sive sequential approach was not set out at the start. First, a review of the literature on parenting programmes was commissioned [9]. On the basis of this review the DCSF undertook an initial implementation of parenting programmes over 2 years in 18 of England’s 152 LAs: the Parenting Early Intervention Pathfinder. Funding of £7.6 million was allocated for LAs’ to develop an
organisational infrastructure, to fund training of facilita-tors and to run parenting groups. Three parenting programmes were selected, on the basis of the review by Moran et al. [9]. Funding was provided for 18 LAs, six to implement each of the three programmes.
Our evaluation of the Pathfinder indicated that the three programmes had all been implemented effectively [2]. We also provided evidence for the process factors that were important in supporting successful implemen-tation [21]. On the basis of this evidence, the UK gov-ernment decided to increase the scale and fund all English higher tier LAs. The DCSF also decided to fund an evaluation of this national roll-out of evidence-based parenting programmes, in order to examine whether the effectiveness, demonstrated by the Pathfinder in 18 LAs, would be maintained when the delivery was scaled up to implement parenting programmes in all 152 LAs in England.
Aims
The overall evaluation comprised a study of effectiveness of the parenting programmes and also a study of the process factors influencing the success of the implemen-tation of the PEIP. This paper addresses the first pur-pose. The study reported here had four aims:
1. To evaluate whether the positive impacts of parenting programmes demonstrated in efficacy trials are replicated when the programmes are rolled out on a national scale.
2. To examine whether the positive benefits of the parenting programmes are sustained one year later. 3. To examine the relative effectiveness of the
parenting programmes used in the national roll-out, in both the short term and one year later.
4. To examine the effects specifically for parents of children 8–13 years, and for their children.
Methods Design
The Department for Children, Schools and Families (DCSF), later the Department for Education (DfE), allocated funding to all English LAs in three waves. The 18 LAs involved in the Pathfinder continued to receive funding (Wave 1). Wave 2 comprised 23 LAs whose funding began in 2008. The remaining 111 LAs started to receive their funding in 2009. In all cases funding contin-ued until 31st March 2011. Sums allocated were deter-mined by the DCSF and varied, for example, by size of LA population. Allocations in 2009–10 ranged from £25,000 to £260,000 per LA, with a total budget of £25.8 million.
These were accredited following reviews undertaken by the National Academy of Parenting Practitioners (NAPP). Initially, five programmes were accredited. These com-prised the three implemented during the Pathfinder: Triple P [22], Incredible Years [23] and Strengthening Families Strengthening Communities (SFSC) [24] together with Families and Schools Together (FAST)[25] and Strengthening Families 10–14 (SFP 10–14) [26].
Each LA determined how to implement PEIP, including the infrastructure set up to manage and support the par-enting courses they provided. Training of group facilitators was organised nationally by NAPP, with training places purchased from the accredited parenting programme pro-vider, but each LA determined the selection of staff to be trained. As with the Pathfinder, the government required LAs to target parents of 8–13 year old children exhibiting or at risk of developing behavioural difficulties.
Local authorities had substantial autonomy as part of government policy and this was increased over the period of the PEIP. They were free to select any one or more of the five accredited parenting programmes to implement; this number later increased to eight follow-ing evaluation of further programmes by NAPP.
Initially, LAs were required to provide data to the DfE on the numbers of parents enrolled on PEIP-funded par-enting courses. This policy was not maintained, however, as a consequence of which there are no official data on the numbers of parents across all LAs in England who received parenting programmes through PEIP.
The programmes
Five parenting programmes were used throughout Waves 2 and 3 of the PEIP, the focus of the present paper: the three originally used in Wave 1 (the Path-finder): Triple P (n=3171 parents, 51.6% of all parents in Waves 2 and 3); Strengthening Families Strengthening Communities (SFSC) (n = 868, 14.1%), and the Incred-ible Years (n = 782, 12.7%); together with two pro-grammes introduced in Waves 2 and 3: Strengthening Families Programme 10–14 (SFP 10–14) (n= 969, 15.8% of all parents in Waves 2 and 3) and Families and Schools Together (FAST), (n = 104, 1.7%). Together these five programmes accounted for 95.1% of all par-ents (n= 5894 in Waves 2 and 3). Later in Wave 2, three other programmes were judged by NAPP to have met the criteria for inclusion: Parent Power (n= 104, 1.7% of all parents in Waves 2 and 3; STOP (n= 102, 1.7%), and Parents Plus, (n= 102, 1.7%) [12].
Evidence for the Pathfinder (Wave 1) programmes has been reviewed in Lindsay, Strand and Davis [2]. Triple P and Incredible Years have been judged by the United Nations Office on Drugs and Crime [11] to be the parent-ing programmes with the best levels of scientific evidence, rated first and second respectively. FAST and SFP 10–14
are also rated in the UNODC list of the top 23 parenting programmes, 11th and 16th respectively. The other four programmes are not included in the UNODC list but were reviewed and approved by NAPP, see [12] for evidence.
All programmes are manualised with detailed training programmes for group facilitators and specification for supervision of facilitators after they begin to lead groups (see [2] for more details). Triple P (Level 4 was evaluated in the present study) comprised five two-hour face-to-face sessions and three on the telephone (11.5 h); SFSC com-prised 12 three-hour group sessions (36 h); Incredible Years, 17 two-hour sessions (34 h); SFP 10–14, 7 two-hour sessions (14 h) plus 4 optional booster sessions 6–12 months after the initial programme; and FAST comprised 8 two-and-a-half hour sessions (20 h), with recommended follow-up monthly booster sessions (2.5 to 4 h) led by par-ents who have completed this programme. The five main programmes therefore, differed in length and both SFP 10–14 and FAST included families, not just parents, and were always school-based, whereas the other programmes were held in a variety of community and health settings. All programmes ran weekly except for holiday periods. FAST may run for up to about 40 parents, arranged in family groups within the class whereas the other four programmes aimed for classes of about 10.
Participants
Local authorities
The data reported here are drawn from the Parenting Early Intervention Programme (PEIP: 2008–11); data from the Pathfinder are described by Lindsay et al. [2] but included here for reference, as appropriate. A sample of 47 LAs was selected from the 152 English LAs. All 23 Wave 2 LAs were included, a sample of 24 Wave 3 LAs were selected to ensure that the total sample was representative of the range of LAs in England with respect to size, urban and rural, ethnicity, and levels of social disadvantage. Four LAs did not engage sufficiently with the study to provide data, resulting in a total sample of 43 LAs. These four LAs had difficulty in setting up and implementing the PEIP, in terms of creating an appropriate organisational infrastructure and, as a result, had problems implementing a programme of parenting classes.
Parents
The parents (N= 6143: 85.4% female, 14.6% male) were recruited locally by a range of methods. Some LAs created new or developed existing services to organise parenting classes in collaboration with the parenting programme providers. Other LAs commissioned organisations, includ-ing those in the voluntary and community sector, to take on this role.
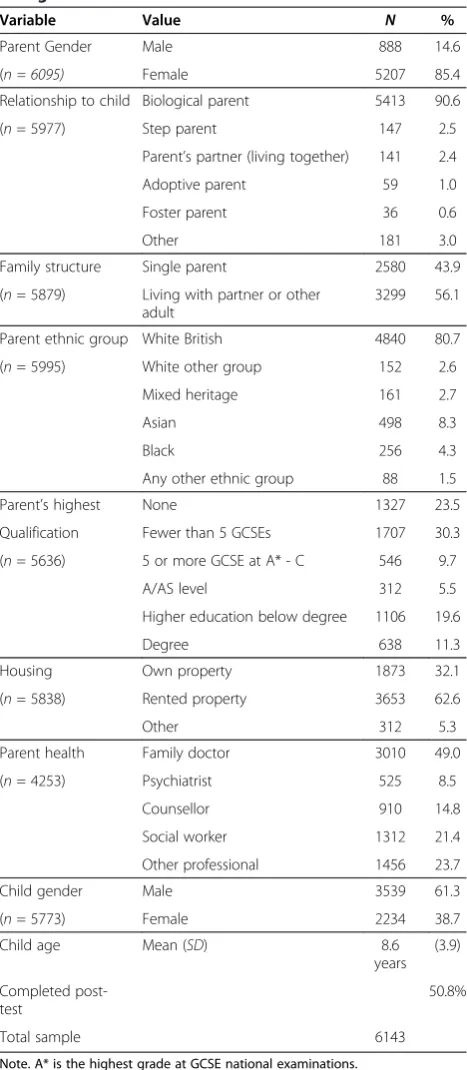
class for the total sample in Waves 2 and 3. The majority of parents (90.6%) were biological parents, predominantly White British (80.7%). There was a substantial minority of Asian heritage (8.3%), with similar proportions whose heri-tage was Pakistani (3.0%), Indian (2.2%) or Bangladeshi (2.2%). Most parents were socially disadvantaged: 53.8%
had left school at the end of compulsory education in England (16 years) with fewer than five passes in the Gen-eral Certificate of Secondary Education (30.3%) or no quali-fications at all (23.5%). However, it is also of interest that a third had attended higher education: 11.3% had a university degree and a further 19.6% had higher education qualifi-cations below a degree level, indicating the heterogeneity among the overall sample of parents attending the paren-ting classes.
A high proportion (43.9%) was living as single parents and 62.6% were living in rented accommodation. There was also a high level of engagement with health and social services (69.2%), most commonly with the family doctor (49.0%) but also a social worker (21.4%), counsellor (14.8%), psychologist (8.5%), or other professional (23.7%) which included psychologists, community workers, health visitors, teachers, family support workers, occupational therapists, police, and child behaviour support teams.
Children
Each parent was asked to select the child whose behav-ioural, emotional and social development gave them most concern to be the target child for the purpose of the study.
The majority of the target children were boys (61.3%) compared to 38.7% girls. The mean age was 8 years 6 months (SD = 3 years 9 months). Only about half (53.8%) were in the target age for PEIP with 37.2% aged 7 years or less but only 9.1% aged 14 years or more.
Almost half (48.9%) of the children were eligible for a free school meal (FSM) compared to national average of 16% [27], further demonstrating the high proportion of socioeconomically disadvantaged families in the sample. Furthermore, a large proportion of the children had a statement of special educational needs (11.5% compared with 2.7% nationally [28] and almost a third (31.7%) were receiving additional educational support, including: one-to-one additional support at school, anger manage-ment, booster classes, counselling, home tutoring, and focussed educational support for dyslexia and other learning difficulties. Additional support was provided by teaching assistants, learning mentors and nurture classes or groups.
Waves 2 and 3 compared with Wave 1
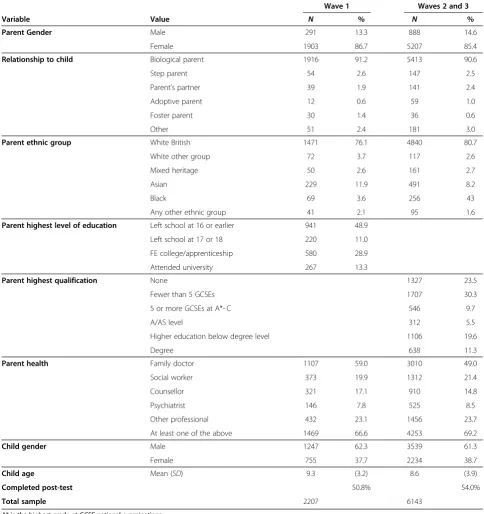
[image:6.595.57.291.108.644.2]Comparison of the present Waves 2 and 3 sample with the Wave 1 (Pathfinder) sample indicates that the demo-graphic profile was very similar for both parents and tar-get children on the measures that were common in both studies (Table 2). The relative proportions for female partic-ipants (Wave 1, 86.7%; Waves 2 and 3, 85.4%) and relation-ship with the child (e.g. 91.2% vs 90.6% biological parent) and the proportion of boys (Wave 1: 62.3%; Waves 2 and 3: 61.3%) were highly similar. The measure of educational ex-perience was changed for the present study so data are not
Table 1 Descriptive statistics for parent and child background measures for Waves 2 and 3
Variable Value N %
Parent Gender Male 888 14.6
(n = 6095) Female 5207 85.4
Relationship to child Biological parent 5413 90.6
(n= 5977) Step parent 147 2.5
Parent’s partner (living together) 141 2.4
Adoptive parent 59 1.0
Foster parent 36 0.6
Other 181 3.0
Family structure Single parent 2580 43.9
(n= 5879) Living with partner or other adult
3299 56.1
Parent ethnic group White British 4840 80.7
(n= 5995) White other group 152 2.6
Mixed heritage 161 2.7
Asian 498 8.3
Black 256 4.3
Any other ethnic group 88 1.5
Parent’s highest None 1327 23.5
Qualification Fewer than 5 GCSEs 1707 30.3
(n= 5636) 5 or more GCSE at A* - C 546 9.7
A/AS level 312 5.5
Higher education below degree 1106 19.6
Degree 638 11.3
Housing Own property 1873 32.1
(n= 5838) Rented property 3653 62.6
Other 312 5.3
Parent health Family doctor 3010 49.0
(n= 4253) Psychiatrist 525 8.5
Counsellor 910 14.8
Social worker 1312 21.4
Other professional 1456 23.7
Child gender Male 3539 61.3
(n= 5773) Female 2234 38.7
Child age Mean (SD) 8.6
years (3.9)
Completed post-test
50.8%
Total sample 6143
directly comparable; however in each case about half of the parents had either left school by the age of 16 years or earl-ier (Wave 1: 48.9%) or had passed fewer than 5 GCSEs at grades A* - C (Waves 2 and 3: 53.8%). The percentage of parents who had sought help from a professional over the previous 6 months was similar in Wave 1 (66.6%) and Waves 2 and 3 (64.2%). There was a small difference with
[image:7.595.55.540.101.616.2]ethnicity, with 80.7% White British parents in Wave 2/3 (close to the national average from the 2011 census of 80.5%) versus a slight under-representation of White British parents (76.1%) in Wave 1. The only difference of real note was that the mean age of the children for Waves 2 and 3 was slightly lower (8.6 years) compared with 9.3 years in Wave 1.
Table 2 Descriptive statistics for parental and child background measures for Wave 1 compared with Waves 2 and 3
Wave 1 Waves 2 and 3
Variable Value N % N %
Parent Gender Male 291 13.3 888 14.6
Female 1903 86.7 5207 85.4
Relationship to child Biological parent 1916 91.2 5413 90.6
Step parent 54 2.6 147 2.5
Parent’s partner 39 1.9 141 2.4
Adoptive parent 12 0.6 59 1.0
Foster parent 30 1.4 36 0.6
Other 51 2.4 181 3.0
Parent ethnic group White British 1471 76.1 4840 80.7
White other group 72 3.7 117 2.6
Mixed heritage 50 2.6 161 2.7
Asian 229 11.9 491 8.2
Black 69 3.6 256 43
Any other ethnic group 41 2.1 95 1.6
Parent highest level of education Left school at 16 or earlier 941 48.9
Left school at 17 or 18 220 11.0
FE college/apprenticeship 580 28.9
Attended university 267 13.3
Parent highest qualification None 1327 23.5
Fewer than 5 GCSEs 1707 30.3
5 or more GCSEs at A*- C 546 9.7
A/AS level 312 5.5
Higher education below degree level 1106 19.6
Degree 638 11.3
Parent health Family doctor 1107 59.0 3010 49.0
Social worker 373 19.9 1312 21.4
Counsellor 321 17.1 910 14.8
Psychiatrist 146 7.8 525 8.5
Other professional 432 23.1 1456 23.7
At least one of the above 1469 66.6 4253 69.2
Child gender Male 1247 62.3 3539 61.3
Female 755 37.7 2234 38.7
Child age Mean (SD) 9.3 (3.2) 8.6 (3.9)
Completed post-test 50.8% 54.0%
Total sample 2207 6143
Intervention
Each programme was manualised and the facilitators leading the classes were trained in the administration of that specific programme by the parenting programme providers themselves. In some cases, LAs trained facili-tators in more than one programme in order to provide a range of parenting programmes for parents to access. Twenty LAs implemented a single programme, 11 ran two programmes, 10 ran three programmes, and two ran four or more. Where an LA ran multiple pro-grammes it was usual for one to predominate. Also, some LAs had trained some facilitators prior to PEIP. The DfE did not require LAs to record the numbers of facilitators trained, but as part of the current study we surveyed facilitators running the classes, a total of 1277 (89.4% female, 10.6% male) in the 43 LAs. The largest percentage (37.1%) was aged 40–49 years, although there were also 24.3% aged 30–39 and 21.7% aged 50–59. Facilitators had a range of professional backgrounds including education, nursery qualification, social work, health and community or therapy.
The LA senior staff managing the PEIP, or their coun-terparts where implementation was carried out by another organisation commissioned for this purpose, provided support, supervision and follow up checks on the fidelity of programme implementation. This was supplemented by the usual follow up by programme staff, to optimise fidelity of implementation and the development of facilita-tors’skills. The parenting programmes were delivered in a range of community settings, representative of the loca-tions usually used for these programmes, including schools, health settings, community centres, and voluntary bodies’premises.
The parenting classes were implemented according to the approach of each programme. This was generally de-livered to groups of about 10 parents, except for the FAST programme which is designed to engage larger numbers of parents attending each course. The facilita-tors ran the courses in accord with that programme’s manual. This included watching DVDs to stimulate cussion of particular teaching points. Role play and dis-cussion sessions were also used. The FAST programme also comprised additional approaches including parents making a meal for others in their group within the larger class. Personal support materials were provided and homework was also carried out.
Outcome measures
The measures used were generally identical to those used in Wave 1 (Pathfinder): the Parenting Scale-Adolescent [29], the Warwick-Edinburgh Mental Well-being Scale [30] and the Strengths and Difficulties Questionnaire (SDQ) [31]. The only difference was the reduction in number of measures of parenting from four to two: by
omitting the Being a Parent scale [32] which measures Satisfaction with being a parent and Parenting Efficacy, in order to reduce the demands on parents. All measures had originally been selected to measure domains where improvements might be expected following parents’ at-tendance at any of the parenting programmes accredited for the PEIP.
Parenting style
The Parenting Scale – Adolescent [29] is a shortened form of a 30 item scale of the same name [33] compris-ing 13 items, each scored on a 7 point scale. It com-prises two subscales each of six items, Laxness and Over-reactivity (each with a range of 6 – 42), together with a single item, Monitoring, which are aggregated to produce a Total Score (range 13–91). Both scales had good reliability (internal consistency) with Cronbach’s alpha .78 for Laxness and .74 for Over-reactivity. High scores indicate less effective parenting styles.
Parent mental well-being
Parent mental well–being is a protective factor for child outcomes. The Warwick-Edinburgh Mental Well-Being Scale (WEMWBS) [30] provides a measure of mental well-being as parents started their group and again on completion. It comprises 14 items scored from 1 (none of the time) to 5 (all of the time). High scores represent greater mental well-being. Reliability (internal consistency) was high (Cronbach’s alpha .93). The national median score is 51 (Inter-quartile range 45–56).
Child behaviour
Parents rated the behaviour of their target child on the Strengths and Difficulties Questionnaire (SDQ) [31]. The SDQ comprises four scales representing different problem domains: Emotional Symptoms, Conduct Prob-lems, Hyperactivity, and Peer Problems. These four scales are summed to produce a Total Difficulties scale. In addition, a Prosocial scale measures positive behav-iours and an Impact scale measures the extent of the im-pact of the child’s behavioural difficulties on the family, school and wider community. Each scale comprises five items scored on a 3 point scale (0 = not true, 1 = some-what true, 2 = certainly true, range 0–10). Total Diffi-culties range is 0 – 40 with high scores representing greater difficulties; for the Prosocial scale low scores rep-resent greater difficulties.
Procedure
Parents completed the questionnaires which were then returned to the research team for analysis, during or just prior to the first session (pre- course) and again during the last session of their parenting programme (post-course). One year after completing their programme, parents that had completed the post-course naire (N = 3325) were sent the same three question-naires by post, together with a reply paid envelope in order to examine the persistence of any improvements made between the p and post- test measures. If no re-sponse was received from a parent within a month, a second, reminder letter was sent.
Ethical approval
Ethical approval was given by the University of Warwick Humanities and Social Sciences Research Ethics Com-mittee (Ref: Eth App 45/07-08). Parents were provided with information about the study and gave informed consent for their involvement. They were informed that all data would be anonymised and that they were free to withdraw at any time and have their data removed.
Analysis
Of the 6143 parents who completed pre-course booklets, 3325 (53.5%) returned post course booklets. Results were very similar across the programmes: 52.2% Triple P, 56.8% Incredible Years, 54.1% SFSC, and 58.3% for SFP 10–14. Facilitators were asked to report on the reason for parent non-completion of post- course booklets. For 16% of parents the facilitator provided a reason for non-completion by the parent, which included (a) the parent did not complete the course or only completed a limited number of sessions (12%); (b) the parent completed the course but declined to complete the booklets (1%) or (c) the parent did not complete the booklet for some other reason (2%) (e.g. transferred to another group, moved away from the area, parent ill health, sick child, or gained employment). For a large proportion of parents (32%) there was no facilitator’s report from the group, so reasons for non-completion are not known. However this reflects issues of administrative error and non-response at the group rather than individual level, since of the 860 PEIP groups that were run there were 181 groups where no post-course booklets at all and no fa-cilitator form was returned. This suggests a substantial proportion of the non-response is due to administrative issues at the group level rather than parent drop-out.
A key issue revolves around whether those who responded to the post-course questionnaire differ sys-tematically from those who did not respond. There were some differences between post-course non-responders and responders in demographic characteristics. Those who did not respond at post-course were more likely to
be socio-economically disadvantaged than responders: specifically they were more likely to have no educational qualifications (28% vs. 20%, p < .001); less likely to own their own property (28% vs. 35%, p < .001), more likely to have a child entitled to a free school meal (FSM 52% vs. 47%,p < .001), and more likely to be from single par-ent families (47% vs. 42%, p< .001). There were no sig-nificant differences in terms of parent gender or ethnicity; or in terms of child age, gender or SEN. How-ever it is differences in pre-course scores that are most salient to the comparison. The pre-course scores for those who did not respond at post-course (‘pre-course only’) were compared with those who did respond (‘pre & post course’). There were only two significant differences (p<.01) indicating those who did not respond at post-course were more likely to have lower mental well-being and higher par-enting laxness scores at the start of the course than those who did respond. However given the sample size of over 6,000, statistical significance is a poor guide since small or even trivial differences are likely to be statistically significant. Evaluation of effect size indicates difference between re-sponders vs. non-rere-sponders were minimal; for example even the largest difference, that for mental well-being score, was less than one score point on a measure with a SD of over 10 points. In sum there is little evidence that non-responders at post-course differed substantially from those that did respond in terms of pre-course scores.
Consequently the analysis focuses on parents with complete data, calculating change scores (post-test score minus pre-course score) for all scales to give measures of improvement. When making comparisons between programmes ANOVA was employed to control for dif-ferences between programmes in demographic variables. This method is preferable to an Intention to Treat (ITT) analysis when there is a substantial loss of participants with post-test scores (for a discussion of the rationale for ANOVA rather than ANCOVA: see Lindsay et al., 2011, p6) [2]. Furthermore, as the percentages of parents with both pre- and post-test scores were so similar across programmes, there is no reason to expect that an ITT analysis would change the estimates of relative programme effects: an ITT analysis would downgrade the effect scores to a similar extent owing to the loss of participants.
Results
Outcomes in Waves 2 and 3
Parents
different programmes used in Waves 2 and 3. Finally, we present the results for children aged 8-13 years.
There were substantial improvements on all parent measures: p < .001 in all cases (Table 3). When they started their programme, parents’ mental well-being was low. Approximately 75% of PEIP parents scored below the national median: PEIP median 43 (inter-quartile range 36 to 51), national median 51 (inter-quartile range 45–56).
Table 3 presents the mean and standard deviation of each measure and the effect size (Cohen’sd) or pre-post comparison, where 0.2 is a small effect, 0.5 a medium ef-fect and 0.8 a large efef-fect. There was a substantial im-provement in mental well-being; pre-course M = 43.5 (SD= 10.8), post-courseM = 51.6 (SD= 9.5), d= 0.79. There were substantial reductions in all measures of par-enting style: Laxnessd=−0.72; Over-reactivity,d=−0.85; and Total Score,d=−0.91. These improvements indicate medium to large effects and suggest that after attending a parenting programme parents were less likely to give in inappropriately to their child or overreact when their child displayed behaviour difficulties.
Child behaviour
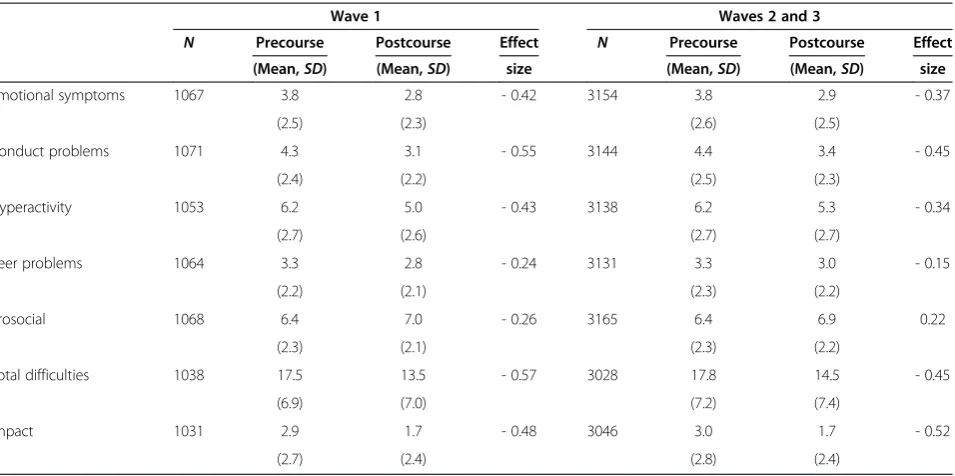
At the start of their programme a high proportion of par-ents rated their child’s behaviour in the clinical range on the SDQ, compared with the norm of about 10 per cent on each measure: Conduct Problems, 62.2%; Total Difficulties, 56.7%; and Impact, 61.2%. Overall, there were consistent, statistically highly significant (p < .001) improvements as indicated by reduction in mean scores, except for the Pro-social scale which has a reverse scoring: increase in score indicates improvement. The overall level of improvement, as indicated by the effect sizes, was lower than for the par-ent measures. Close examination indicates that the largest improvements were in Conduct Problems (d = −0.45), Total Difficulties (d=−0.45) and Impact (d=−0.52)–see Table 4. By contrast, improvements in the Peer Problems
measure, although also highly significant (p< .001) had a small effect size (d=−0.15).
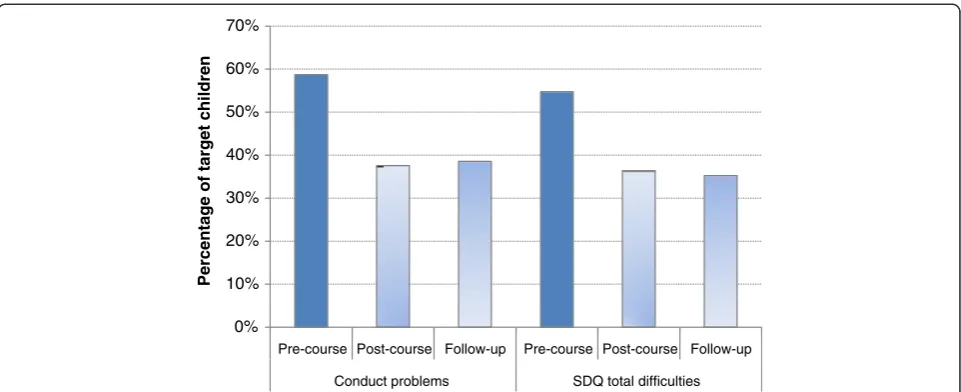
The SDQ also has norms to categorise children’s scores according to a 3 category system: 10% abnormal, 10% bor-derline and 80% normal [32]. The percentage of children rated by their parents as having clinically significant (‘abnormal’) difficulties reduced by a third: Conduct Problems decreased from 61% to 41%, Total Difficulties from 57% to 38% and Impact decreased even more, from 62% to 36%.
Comparison of Waves 2 and 3 with Wave 1 (Pathfinder) As indicated in Table 1, the demographic profiles were very similar for Wave 1 compared with Waves 2 and 3. The outcomes for Waves 2 and 3 from 43 LAs were also very similar to those of the Wave 1 LAs, for both par-ents’and children’s scores on all measures, with respect to means (SDs) and effect sizes. For example, mean par-ent Mpar-ental Well-Being improved from 43.5 to 50.6 Wave 1 compared with an improvement from 43.5 to 51.6 for Waves 2 and 3; effect sizes were also similar: 0.71 and 0.79 respectively (Table 3). Mean Parenting Scale scores decreased (indicating less laxness and over-reactivity) from 47.4 to 37.1 (Laxness) and from 46.6 to 35.7 for Over-reactivity with effect sizes−0.91 in each case.
The effect sizes of improvements in parents’ ratings of their children’s behaviour were at a lower level for Waves 2 and 3: Conduct Problems: -0.55 Wave 1, -0.45 Waves 2 and 3; and for Total Difficulties: -0.57 Wave 1, -0.45 Waves 2 and 3 (Table 4). However, Impact showed the opposite trend: Wave 1 effect size −0.48, Waves 2 and 3 effect size−0.52.
One year follow up
[image:10.595.59.538.565.718.2]The response rate to the one year follow up was 1260 (37.9%) of the 3325 parents who were in the sample, comprising 1035 (30.5%) parents that completed book-lets of questionnaires and 225 (6.6%) where the booklet
Table 3 Parenting behaviours: Pre- and post-course means (SDs) and effect sizes of improvements for Wave 1 and for Waves 2 and 3 combined
Wave 1 Waves 2 and 3
N Precourse Postcourse Effect N Precourse Postcourse Effect
(aMean,SD) (aMean,SD) size (aMean,SD) (aMean,SD) size
Mental well-being 1071 43.5 50.6 0.71 3160 43.5 51.6 0.79
(10.4) (9.8) (10.8) (9.5)
Parenting laxness 1040 22.0 17.4 - 0.71 3125 21.3 16.5 - 0.72
(6.6) (6.3) (7.2) (6.5)
Parenting over-reactivity 1032 22.5 17.4 - 0.83 3140 22.5 16.9 - 0.85
(6.4) (6.2) (6.9) (6.4)
Parenting total score 1030 47.4 37.1 - 0.91 3093 46.6 35.7 - 0.91
(11.1) (11.6) (12.1) (11.9)
Note. Effect sizes are Cohen’sd.
a
was returned but indicating that the addressee had moved away. High mobility was an important factor for PEIP parents, with two thirds living in rented accommo-dation compared to about a quarter nationally (see Table 1). The parents for whom we received valid data were drawn from all 43 LAs and comprised parents that had attended one of the four main PEIP programmes: Triple P n = 473 (45.7%); Incredible Years n = 146 (14.1%); SFSCn= 169 (16.3%); and SFP 10–14,n= 176 (17.0%). In addition, 71 parents (6.9%) had attended one of the other four programmes.
A series of one-way repeated measures ANOVAs was conducted to examine the effect of occasion: pre-course, post-course and one year follow-up, based on cases with valid scores at all three time points. Pairwise compari-sons with Bonferroni correction were conducted as post hoc tests. Means (SDs) are presented in Table 5.
Parent outcomes
Mental well-being There was a highly significant ef-fect of occasion: F(2, 1844) = 295.4, p< .001, partial eta squared = .24). Pairwise comparisons of means with Bonferroni correction indicated that parent men-tal well-being at post-course was significantly higher than at the pre-course (p< .001). The mean score at the one year follow-up fell back relative to the imme-diate post-course score (by 2.7 points) but remained significantly higher than at pre-course (by 5.2 points,
p< .001) (see Figure 1a).
Parenting behaviours: laxness and over-reactivity
[image:11.595.62.540.110.348.2]There was also a highly significant effect for both par-enting measures: Laxness, F(2, 1826) = 270.5, p< .001, partial eta squared = .30; Over-reactivity, F(2, 1822) = 367.3,p< .001, partial eta squared = .29. The Parenting total score followed this pattern but with a greater effect size: F(2, 1800) = 448.1,p < .001, partial eta squared = .33. Pairwise comparisons of means with Bonferroni cor-rection indicated significant reductions in the negative parenting behaviours of laxness and over-reactivity at immediate post-course (p < .001). Scores increased
Table 4 Child’s behaviours: Pre- and post-course means (SDs) and effect sizes for Wave 1 and for Waves 2 and 3 combined
Wave 1 Waves 2 and 3
N Precourse Postcourse Effect N Precourse Postcourse Effect
(Mean,SD) (Mean,SD) size (Mean,SD) (Mean,SD) size
Emotional symptoms 1067 3.8 2.8 - 0.42 3154 3.8 2.9 - 0.37
(2.5) (2.3) (2.6) (2.5)
Conduct problems 1071 4.3 3.1 - 0.55 3144 4.4 3.4 - 0.45
(2.4) (2.2) (2.5) (2.3)
Hyperactivity 1053 6.2 5.0 - 0.43 3138 6.2 5.3 - 0.34
(2.7) (2.6) (2.7) (2.7)
Peer problems 1064 3.3 2.8 - 0.24 3131 3.3 3.0 - 0.15
(2.2) (2.1) (2.3) (2.2)
Prosocial 1068 6.4 7.0 - 0.26 3165 6.4 6.9 0.22
(2.3) (2.1) (2.3) (2.2)
Total difficulties 1038 17.5 13.5 - 0.57 3028 17.8 14.5 - 0.45
(6.9) (7.0) (7.2) (7.4)
Impact 1031 2.9 1.7 - 0.48 3046 3.0 1.7 - 0.52
(2.7) (2.4) (2.8) (2.4)
[image:11.595.306.539.558.699.2]Note. Effect sizes are Cohen’sd.
Table 5 Parenting and child measures (M, SD)at pre-course, post-course and one year follow up
Pre-course Post-course Follow up
M SD M SD M SD
Parents
Mental well-being 43.9 10.6 51.8 9.3 49.1 11.3
Parenting laxness 20.5 7.3 15.6 6.1 16.8 6.2
Parenting over-reactivity 22.5 6.8 16.8 6.3 17.9 6.3
Parenting total score 45.7 12.1 34.6 11.3 37.0 11.6
Child
SDQ total difficulties 17.5 7.5 14.2 7.7 14.0 8.2
SDQ conduct problems 4.3 2.5 3.2 2.3 3.3 2.5
slightly at one year follow up, but remained significantly below pre-course levels (p< .001) (see Figure 1b).
Child behaviour A highly significant effect of occasion was found for child SDQ total difficulties:F(2, 1726) = 212.9,
p< .001, partial eta squared = .20; and conduct problemsF
(2,1778) = 157.6,p< .001, partial eta squared = .15). Pairwise comparisons of means with Bonferroni corrections indicated significant reductions in child total difficulties and conduct problems at post-course (p< .001) which were maintained at follow up, with no significant differences between post-course and one year follow up scores. In terms of the classifi-cation of the child’s difficulties in the clinically significant (‘abnormal’) range, the pattern was similar (Figure 2).
Programme differences in patterns of change over time In this section we examine whether there were any statisti-cally significant differences between the programmes with respect to improvements on the parent and child measures. The analyses of programme effectiveness include only the four programmes with substantial numbers of parents which together accounted for 93% of all parents in Waves 2 and 3: Incredible Years; Strengthening Families 10–14
(SF 10–14); Strengthening Families Strengthening Children (SFSC); and Triple P. As the largest programme, Triple P was set as the base programme against which the other programmes were compared.
There were small differences between programmes in the demographic profile of their parents and children in terms of the parent and child background variables. The analyses controlled for these differences by estimating programme effects after accounting for variation associ-ated with all significant parent and child background variables. These models included only those parent and child background variables that were significantly associ-ated with each outcome. The models also included fixed effects for each of the 43 LAs to control for variation be-tween LAs in outcomes.
All four programmes were effective as shown in Table 6. Effect sizes for parenting measures were medium to large: for example, ranging from 0.66 for SFP 10 –14 to 0.83 for Triple P and Incredible Years for mental well-being. The pattern was comparable to that of the total sample with higher effect sizes for the measures of parenting (medium to large) than child behaviour, which were small to medium in size, for all programmes.
40 42 44 46 48 50 52 54
Pre-course Post-course One year follow-up
Mean score with 95% confidence
interval
30 32 34 36 38 40 42 44 46 48
Pre-course Post-course One year follow-up
Mean score with 95% confidence
interval
2.0 2.5 3.0 3.5 4.0 4.5 5.0
Pre-course Post-course One year follow-up
Mean score with 95% confidence interval
12 13 14 15 16 17 18 19
Pre-course Post-course One year follow-up
Mean score with 95% confidence interval
a
b
[image:12.595.60.539.88.413.2]c
d
For parent mental well-being and parenting laxness, SFP 10–14 was less effective than Triple P, but no other differences were statistically significant. For parenting over-reactivity both SFP 10–14 and Incredible Years were less effective than Triple P, but no other differences were statistically significant. With respect to child outcomes, there were no differences between programmes for child total difficulties or for impact. However Triple P was sig-nificantly better than the other three programmes at redu-cing reported child conduct problems.
It is notable however that even after including parent demographics, programme type and LA, theR2for each outcome was never higher than 6.4%a. Therefore while these effects are statistically significant they explain only a small proportion of the change in scores. The majority of variance in change relates to individual differences be-tween parents that are not captured in any of the broad parent or child demographics or structural features such as programme type or LA. Some parents were more re-sponsive than others to PEIP, but this reflects unique features of the parents as individuals.
Children aged 8–13 years
Although the PEIP was aimed at parents of children 8–13 years, a substantial proportion of the children identified by parents as their targeted child were older or younger. We therefore conducted a separate analysis for the 53.8% of parents and children in the target age range. Results were almost identical to those for the total PEIP sample as indi-cated by Tables 7 and 8, as compared with Tables 5 and 6.
Discussion
This study examined the national roll-out of parenting programmes across all 152 local authorities (LAs) in
England, the Parenting Early Intervention Programme (PEIP). To the best of our knowledge this is the first study that has examined the effectiveness of a national roll-out of parenting programmes and has included a comparison of relative effectiveness of four different programmes and a long term follow up. Furthermore, we provide evidence on an under-researched population, namely children aged 8–13 years.
The present study was the last of a 3-stage process devel-oped by the UK Government’s Department for Education in England. A literature review established that there were parenting programmes with evidence of efficacy: two of the three selected for the Pathfinder (Triple P and Incredible Years) had evidence from many randomized controlled tri-als (RCTs) [5,11] including RCTs in England, for example [36]. Strengthening Families Strengthening Communities (SFSC) did not have RCT evidence, but rather evidence from pre- to post-implementation studies. The Pathfinder implemented over two years in 18 LAs demonstrated that these three programmes were all effective, although SFSC showed lower effects than the other two [2].
The present study reports the implementation of evidence-based programmes in all LAs in England and a substantial increase in scale and range, from 18 to all 152 LAs. The evidence shows clearly that the effective-ness demonstrated for the three Pathfinder programmes was maintained and also that a fourth programme, SFP 10–14 achieved similar levels of effectiveness. This applied across all of our measures of parental mental well-being, parenting skills (reducing laxness and over-reactivity); and applied also to child conduct problems, total level of children’s behavioural, emotional and social difficulties, and their impact on the family. Indeed, the effect sizes were very similar in both the present study 0%
10% 20% 30% 40% 50% 60% 70%
Pre-course Post-course Follow-up Pre-course Post-course Follow-up Conduct problems SDQ total difficulties
Per
c
entage of tar
[image:13.595.58.539.88.284.2]get children
Table 6 Improvements in parenting and child behaviour between pre-course and post-course for Incredible Years, Strengthening Families Programme 10-14, Strengthening Families Strengthening Communities, and Triple P
Incredible years SFP 10-4 SFSC Triple P
Variable N Pre-course
Post-course
Effect size
N Pre-course
Post-course
Effect size
N Pre-course
Post-course
Effect size
N Pre-course
Post-course
Effect size
Parent Mental Well-Being 431 43.9 52.1 0.85 539 40.7 47.5 0.69 453 44.0 51.6 0.74 1562 44.1 52.7 0.85
(10.1) (9.3) (10.6) (9.4) (10.9) (9.4) (10.8) (9.3)
Parental laxness 415 20.9 16.0 −0.73 533 22.1 18.2 −0.57 439 20.8 17.1 −0.54 1563 21.5 15.9 −0.83
(6.9) (6.4) (7.3) (6.5) (7.2) (6.6) (7.2) (6.3)
Parental overreactivity 418 22.1 16.9 −0.77 538 24.1 19.3 −0.74 438 21.8 17.4 −0.71 1571 22.4 16.0 −0.96
(7) (6.3) (6.5) (6.4) (6.5) (6.2) (6.9) (6.3)
Parenting total score 407 45.5 35.2 −0.86 529 49.3 40.0 −0.79 432 45.3 36.9 −0.71 1554 46.6 34.1 −1.04
(12) (11.8) (11.8) (11.8) (11.7) (11.7) (12.2) (11.7)
Child Emotional symptoms 424 3.8 2.9 −0.36 547 4.6 3.7 −0.36 437 3.6 2.7 −0.37 1565 3.6 2.7 −0.40
(2.6) (2.5) (2.8) (2.7) (2.6) (2.5) (2.6) (2.4)
Conduct problems 425 4.2 3.2 −0.42 545 5.2 4.2 −0.41 433 4.0 3.3 −0.32 1559 4.4 3.2 −0.54
(2.4) (2.4) (2.5) (2.5) (2.4) (2.3) (2.4) (2.2)
Hyperactivity 424 6.1 5.2 −0.33 547 6.4 5.7 −0.26 427 6.0 5.3 −0.25 1562 6.3 5.2 −0.40
(2.8) (2.8) (2.7) (2.7) (2.7) (2.6) (2.7) (2.6)
Peer problems 420 3.1 2.9 −0.10 545 3.7 3.5 −0.11 427 3.2 2.9 −0.17 1560 3.3 2.9 −0.17
(2.2) (2.1) (2.4) (2.3) (2.2) (2) (2.2) (2.1)
Prosocial scale 427 6.6 6.9 0.17 546 6.4 6.6 0.13 430 6.3 6.8 0.24 1584 6.4 7.0 0.27
(2.1) (2.1) (2.3) (2.3) (2.2) (2.2) (2.3) (2.1)
Impact 413 2.8 1.6 −0.47 531 4.2 2.5 −0.61 426 2.5 1.5 −0.37 1500 2.9 1.4 −0.57
(2.7) (2.3) (2.9) (2.7) (2.8) (2.4) (2.8) (2.3)
SDQ total score 411 17.3 14.1 −0.43 532 20.0 17.1 −0.40 413 16.8 14.0 −0.39 1496 17.6 14.0 −0.51
(7.1) (7.6) (7.2) (7.6) (7.2) (7.3) (7) (7.1)
Note. Effect sizes are in bold to aid clarity.
Strand
BMC
Public
Health
2013,
13
:972
Page
13
of
17
ntral.com/1
and the earlier Pathfinder despite a tripling of the num-ber of parents providing pre- and post- parenting programme comparison data.
Furthermore, levels of improvement over the period of the programmes (pre- to post- test) are comparable to those found in smaller scale studies. For example, the re-sults for child behaviour problems for Triple P in the current study were similar to the range found in the meta-analysis of 55 studies by Nowak and Heinrichs [5] for a within-group design: 0.52 – 0.55 in the present study compared with 0.45–0.57.
The second aim of the study was to examine the lon-ger term effects of parents’attendance at one of the par-enting programmes. One year after completing their parenting courses, parents’ratings indicated that the im-provements made between the pre- and post-course as-sessment were maintained. Across all parent measures there were small reductions at follow up compared to immediate post-course scores although, with respect to the children, reported improvements were maintained completely at follow up. Taken together, the results of short term (pre- to post-course) and one year follow up indicate that the PEIP achieved similar patterns of initial improvement and of maintenance of these improve-ments as found in efficacy trials with these evidence based programmes [36,37]. This was achieved from a roll-out across the whole of England, a very substantial scaling up. The roll-out required the training of at least 1277 facilitators in the 43 LAs to provide the resource to implement the parenting programmes, and imple-mentation in a variety of community settings, organised at local level by each LA.
Furthermore, it is of interest to note that the improve-ments reported by parents following attendance at an evidence based parenting course were very similar to those achieved during the Pathfinder (Wave 1) in 18 LAs, itself a roll-out on a substantial size [2]. The two studies, therefore, indicate both a replication of the ef-fectiveness of the three parenting programmes examined
in the Pathfinder and maintenance of the effects when the scale of delivery was increased substantially.
The third aim was to examine the relative effectiveness of the four programmes for which we had sufficient data. All four were effective with medium to large effect sizes for improvements in parents’mental well-being and par-enting skills, and small to medium effect sizes for SDQ child conduct problems, SDQ total difficulties and SDQ impact. After controlling for differences in demographic background variables and initial scores on the measures, there were generally larger effect sizes for Triple P on parent and child measures, but not all between programme comparisons were significant: SFP 10–14 was less effective than Triple P for parents’mental well-being and parenting laxness; and both SFP 10–14 and Incredible Years were significantly less effective than Triple P for parenting over-reactivity. With respect to child outcomes, Triple P showed significantly greater ef-fects in improving children’s conduct problems than all three other programmes.
These results are similar to those in the Pathfinder in that Triple P generally showed higher effectiveness in that study also. However, in the Pathfinder SFSC was less effective than both Triple P and Incredible Years for both parenting and child measures. Hence, across the two studies there is consistency in demonstrating a gen-eral effectiveness across both parent and child measures for the total sample (all programmes combined) but a generally higher level of effectiveness, though not always statistically significant, for Triple P across the range of parent and child measures.
The results for the group targeted by the PEIP, parents of children aged 8–13 years, were almost identical to those of the complete sample. This indicates that these programmes are suitable for parents of children in this age range as well as those with younger children.
[image:15.595.57.539.112.251.2]The study was rigorous within the parameters of an effectiveness study of a national roll out of the programmes implemented in community settings across
Table 7 Parenting and child measures (Mean,SD) at pre-course, post-course and one year follow-up: Parents of children aged 8–13 years only
Pre-course Post-course Follow-up Sample
Mean SD Mean SD Mean SD N
Parents
Mental well-being 43.9 10.5 51.5 9.6 49.1 11.2 460
Parenting laxness 20.4 7.4 15.9 6.4 17.0 6.2 461
Parenting over-reactivity 23.1 6.7 17.6 6.3 18.3 6.3 460
Parenting total score 46.2 12.0 35.7 11.7 37.7 11.5 455
Child
SDQ total difficulties 18.4 7.6 15.1 7.8 14.9 8.2 456
Table 8 Improvements in parenting and child behaviour between pre-course and post-course for Incredible Years, Strengthening Families 10-14, Strengthening Families Strengthening Communities, and Triple P (children aged 8-13 years)
Age 8–13 only
Incredible years SFP 10-14 SFSC Triple P
Variable N
Pre-course
Post-course
Effect size
N Pre-course
Post-course
Effect size
N Pre-course
Post-course
Effect size
N Pre-course
Post-course
Effect size
Parent Mental Well-Being 200 43.1 50.5 0.75 446 41.1 47.3 0.64 188 44.0 51.6 0.71 634 43.8 52.6 0.88
(10.1) (9.7) (10.2) (9.4) (11.4) (9.8) (10.6) (9.4)
Parental laxness 192 20.8 17.0 −0.54 440 21.8 18.3 −0.52 186 21.5 17.6 −0.60 658 21.3 15.7 −0.79
(7.4) (6.8) (7.3) (6.5) (6.8) (6.3) (7.6) (6.4)
Parental overreactivity 194 22.5 17.9 −0.72 442 24.1 19.7 −0.70 188 23.5 18.8 −0.76 664 23.1 16.2 −1.06
(6.6) (6.3) (6.5) (6.3) (6.1) (6.2) (6.9) (6.1)
Parenting total score 188 46.0 37.3 −0.71 436 49.0 40.3 −0.74 185 47.8 38.9 −0.79 655 47.2 34.3 −1.09
(12.2) (12.3) (11.8) (11.7) (10.9) (11.7) (12.2) (11.5)
Child Emotional symptoms 197 4.3 3.1 −0.45 453 4.6 3.6 −0.37 189 4.3 3.3 −0.39 669 4.1 3.1 −0.40
(2.7) (2.6) (2.7) (2.7) (2.5) (2.6) (2.6) (2.4)
Conduct problems 198 4.4 3.7 −0.30 451 5.2 4.2 −0.39 189 4.4 3.6 −0.32 667 4.7 3.5 −0.53
(2.6) (2.6) (2.5) (2.5) (2.5) (2.4) (2.4) (2.3)
Hyperactivity 198 6.2 5.4 −0.27 453 6.5 5.8 −0.27 187 6.1 5.4 −0.26 672 6.4 5.3 −0.39
(2.9) (2.9) (2.7) (2.7) (2.7) (2.5) (2.7) (2.6)
Peer problems 196 3.4 3.3 −0.05 452 3.7 3.5 −0.11 186 3.6 3.2 −0.18 667 3.5 3.1 −0.15
(2.3) (2.3) (2.5) (2.3) (2.3) (2.2) (2.3) (2.2)
Prosocial scale 200 6.5 6.7 0.10 452 6.4 6.6 0.11 189 6.4 6.9 0.21 672 6.5 7.0 0.24
(2.2) (2.1) (2.3) (2.3) (2.3) (2.2) (2.4) (2.2)
Impact 192 3.3 2.0 −0.49 437 4.2 2.5 −0.60 187 3.2 2.0 −0.44 636 3.5 1.9 −0.62
(2.7) (2.6) (2.8) (2.7) (2.9) (2.6) (2.7) (2.5)
SDQ total score 192 18.4 15.4 −0.38 441 20.1 17.2 −0.40 180 18.4 15.6 −0.38 654 18.6 15.0 −0.51
(7.5) (8.2) (7.4) (7.7) (7.5) (7.5) (7.1) (7.2)
Effect sizes are in bold to aid clarity.
Strand
BMC
Public
Health
2013,
13
:972
Page
15
of
17
ntral.com/1
all 152 English LAs, building upon our earlier study of the 18 LAs in the Pathfinder. There were, however, limi-tations which were essentially the same as the Pathfinder [2]. First, post-course data were available on only about half the original sample. As with the Pathfinder only about half of this loss could be attributed to drop outs, the rest was a result of administrative errors. However, this had a knock on effect on the one year follow up as that only targeted parents with both pre- and post-test data. Second, as a real world study on a national scale, random allocation of LAs to programmes was not pos-sible. Furthermore, government policy had changed sub-sequent to the Pathfinder to allow funding to be used for any of the accredited parenting programmes. Third, LAs varied in their effectiveness of organising their im-plementation. For example, the numbers of parents at-tending a programme varied greatly.
Conclusions
The present study has demonstrated that evidence based parenting programmes can be successfully rolled out on a national scale. The evaluation of programmes when scaled up is important: small scale efficacy trials form a basis for evidence based practice, showing that an intervention can produce positive effects. Community based trials are needed to demonstrate generalisation of effects to ‘real life’ practice. But for public policy determination, effects must also be maintained when scaling up to the level of policy coverage, in this case the whole of England.
Furthermore, the present study and the earlier study of the Pathfinder [2], provide evidence for the impact of re-search in shaping government policy: this developed from a systematic review of the research literature to an evaluated large scale community based trial and eventually to the im-plementation and evaluation of the national roll-out. At each point, policy was based on evidence of effectiveness.
Endnote a
Alternative models such as ANCOVA with the pre-course score entered as a covariate give a higher R2(e.g. 25.8% for parent laxness). However this is because in such models the R2represents the variation in the out-come score (or state) that can be explained, rather than the variation in the change or improvement score. With ANOVA the R2 is a direct measure of the amount of variation in change that can be accounted for.
Competing interests
The authors declare they have no competing interest other than: GL has presented at conferences organised by three of the parenting programmes to report the results of the earlier pathfinder study: Triple P (2 conferences, fee), Incredible Years and FAST.
Authors’contributions
GL led the research (Principal Investigator) and drafted the manuscript; SS was Co-investigator for the study, participated in the design, conducted the
analyses and drafted the Results section. Both authors read and approved the final manuscript.
Authors’information
GL is Director of the Centre for Educational Development, Appraisal and Research (CEDAR) at the University of Warwick, England where he is also Professor of Educational Psychology and Special Needs Education. SS is Professor of Education at the Department for Education, University of Oxford. GL is currently leading the evaluation of the UK’s Department of Education funded CANparent trial of universal parenting classes; SS is a co-investigator and leading on the analysis of quantitative data from the trial.
Acknowledgements
We acknowledge the assistance provided by the many parents and local authority staff that provided or organised the collection of data. We also acknowledge the UK government’s Department for Children Schools and Families (now the Department for Education) which provided funding for the study. The Department gave approval the design of the study but did not engage in or influence the analysis or interpretation of the data, the writing or decision to submit the manuscript.
Author details
1Centre for Educational Development, Appraisal and Research (CEDAR),
University of Warwick, Kirby Corner Road, Coventry CV4 7AL, UK.
2Department for Education, University of Oxford, 15 Norham Gardens, Oxford
OX2 6PY, USA.
Received: 14 February 2013 Accepted: 14 October 2013 Published: 19 October 2013
References
1. Biglan A, Flay BR, Embry DD, Sander IN:The critical role of nurturing environments for promoting human well-being.Amer Psychol2012, 67:257–272.
2. Lindsay G, Strand S, Davis H:A comparison of the effectiveness of three parenting programmes in improving parenting skills, parent mental well-being and children’s behaviour when implemented on a large scale in community settings in 18 English local authorities: the parenting early intervention pathfinder.BMC Public Health2011,11:962.
3. Patterson J, Mockford C, Barlow J, Pyper C, Stewart-Brown S:Need and demand for parenting programmes in general practice.Arch Dis Child 2002,87:468–487.
4. Green H, McGinnity A, Meltzer H, Ford T, Goodman R:The Mental Health of Children and Young People in Great Britain, 2004.Basingstoke:
Palgrave MacMillan; 2005.
5. Nowak C, Heinrichs N:A comprehensive meta-analysis of Triple P—Positive Parenting Program using hierarchical linear modelling: Effectiveness and moderating variable.Clin Child Fam Psychol Rev2008,11:114–144. 6. Barlow J, Coren E:Parenting Programmes for Improving Maternal Psychosocial
Health. Cochrane Review. The Cochrane Library, Issue 4.Oxford: Update Software; 2000.
7. Dretzke J, Davenport C, Frew E, Barlow J, Stewart-Brown S, Bayliss S, Taylor RS, Sandercock J, Hyde C:The clinical effectiveness of different parenting programmes for children with conduct problems: a systematic review of randomized control trials.Child Adol Psychiat Ment Health2009, 3:7. doi:10.1186/1753-2000-3-7.
8. Furlong M, McGilloway S, Bywater T, Hutchings J, Smith SM, Donnelly M: Behavioural and cognitive-behavioural group-based parenting programmes for early-onset conduct problems in children aged 3–12 years.Cochrane Database Syst Rev2012,2, CD008225. doi:10.1002/14651858. CD008225.pub2. 9. Moran P, Ghate D, van der Werwe A:What Works in Parenting Support?
A Review of the International Literature. Research Report 574.London: Department for Education and Skills; 2004.
10. Stewart-Brown SL, Schrader-McMillan A:Parenting for mental health: what does the evidence say we need to do? Report of Workpackage 2 of the DataPrev project.Health Prom Int2011,26:i10–i26. doi:10.1093/heapro/dat056. 11. United Nations Office on Drugs and Crime:Compilation of Evidence-Based
Family Skills Training Programmes.New York: United Nations; 2010. 12. National Academy of Parenting Research:Commissioning Toolkit.http://www.kcl.
13. Society for Prevention Research:Standards of evidence: criteria for efficacy, effectiveness and dissemination.Accessed 16 October 2011
[www.preventionresearch.org/]
14. Webster-Stratton C, Reid M:The Incredible Years parents, teachers and child training series: a multifaceted treatment approach for young children with conduct problems. InEvidence-based Psychotherapies for Children and Adolescents.Edited by Kazdin A, Weisz J. New York: Guilford Press; 2003. 15. Eisner M:No effects in independent prevention trials: can we reject the
cynical view?J Exp Criminol2009,5:163–183. doi:10.1007/s 11292-009-9071-y. 16. La Roca R, Yost J, Dobbins M, Ciliska D, Butt M:The effectiveness of
knowledge transfer strategies used in public health: a systematic review. Impl Sci2012,12:751. doi:10.1186/1471–2458-12-751.
17. Kothari A, Armstrong R:Community-based knowledge translation: unexplored opportunities.Impl Sci2011,6:59. doi:10.1186/1748-5908-6-59. 18. Wilson MG, Lavis JN, Travers R, Rourke SB:Community-based knowledge
transfer and exchange: Helping community-based organisations link research to action.Imp Sci2010,5:33.
19. Olds DL, Hill PL, O’Brien R:Taking preventive intervention to scale: The nurse-family partnership.Cog and Behav Practice2003,10:278–290. 20. Respect Taskforce:Respect action plan.London: Home Office; 2006. 21. Lindsay G, Davis H, Band S, Cullen MA, Cullen S, Strand S, Hasluck C,
Evans R, Stewart-Brown S:Parenting Early Intervention Pathfinder Evaluation Research Report DCSF-RW054.London: Department for Children Schools and Families. https://www.gov.uk/government/publications/parenting-early-intervention-pathfinder-evaluation.
22. Sanders M:The Triple P—Positive Parenting Program: towards an empirically validated multilevel parenting and family support strategy for the prevention of behavior and emotional problems in children. Clin Child Fam Psychol Dev1999,2:71–90.
23. Webster-Stratton C, Reid MJ, Hammond ML:Treating children with early-onset conduct problems: Intervention outcomes for parents, child and teacher training.J Clin Child Adol Psychol2004,33:105–124.
24. Steele M, Marigna M, Tello J, Johnston R:Strengthening Families, Strengthening Communities: an Inclusive Programme. Facilitator Manual. London: Race Equality Unit; 2000.
25. McDonald L, Billingham S, Conrad T, Morgan A, Payton E:Families and schools together (FAST). Integrating community development with clinical strategies.Fam in Soc1997,78:140–155.
26. Molgaard VK, Spoth RL, Redmond C:Competency Training: The Strengthening Families Program–for Parents and Youth 10–14. OJJDP Juvenile Justice Bulletin. Washington DC: United States Department of Justice, Office of Justice Programs, Office of Juvenile Justice and Delinquency Prevention; 2000. 27. Strand S:The limits of social class in explaining ethnic gaps in
educational attainment.B Ed Res J2011,37(2):197–229.
28. Department for Education:Children with Special Educational Needs 20910: An Analysis. DfE 00553–2010.London: Department for Education; 2010. 29. Irvine AB, Biglan A, Smolkowski K, Ary DV:The value of the parenting scale
for measuring the discipline practices of parents of middle school children.Behav Res Ther1999,37:127–142.
30. Tennant R, Fishwick R, Platt S, Joseph S, Stewart-Brown S:Monitoring Positive Mental Health in Scotland: Validating the Affectometer 2 Scale and Developing the Warwick Edinburgh Mental Well-being Scale for the UK.NHS Health Scotland: Edinburgh; 2006.
31. Goodman R:The strengths and difficulties questionnaire: a research note.J Child Psychol Psychiat1997,38:581–586.
32. Johnston C, Mash EJ:A measure of parenting satisfaction and efficacy. J Clin Child Psychol1989,18:167–175.
33. Arnold DH, O’Leary SG, Wolff LS, Acker MM:The parenting scale: a measure of dysfunctional parenting in discipline situations.Psychol Assess 1993,5:137–144.
34. Goodman A, Goodman R:Strengths and difficulties questionnaire as a dimensional measure of child mental health.Amer Acad Child Adol Ment Health2009,48(4):400–403.
35. SDQ:Information for researchers and professionals about the Strengths & Difficulties Questionnaires.Accessed 6 December 2012 [http://www.sdqinfo.com/] 36. Hutchings J, Bywater T, Daley D, Gardner F, Whitaker C, Jones K,et al:
Parenting intervention in Sure Start services for children at risk of developing conduct disorder: pragmatic randomised controlled trial. BMJ2007,334:678.
37. Scott S, Spender Q, Doolan M, Jacobs B, Aspland H:Multicentre controlled trial of parenting groups for childhood antisocial behavior in clinical practice.BMJ2001,323:194–198.
doi:10.1186/1471-2458-13-972
Cite this article as:Lindsay and Strand:Evaluation of the national
roll-out of parenting programmes across England: the parenting early intervention programme (PEIP).BMC Public Health201313:972.
Submit your next manuscript to BioMed Central and take full advantage of:
• Convenient online submission • Thorough peer review
• No space constraints or color figure charges • Immediate publication on acceptance
• Inclusion in PubMed, CAS, Scopus and Google Scholar
• Research which is freely available for redistribution