Interdiffusion of Refractory Elements in Fe-Cr-X (X-Mo, W)
and Fe-Mo-W Ternary Iron Alloys
Koutarou Takeda
1;*1,*2, Kouji Yamashita
1;*1, Yoshinori Murata
1,
Toshiyuki Koyama
2and Masahiko Morinaga
11Department of Materials, Physics and Energy Engineering, Graduate School of Engineering,
Nagoya University, Nagoya 464-8603, Japan
2National Institute for Materials Science, Tsukuba 305-0047, Japan
Interdiffusion coefficients of the refractory elements in Fe-Cr-X (X¼Mo, W) and Fe-Mo-W ternary alloys were measured on the basis of the modified Boltzmann-Matano method for ternary systems. The cross interdiffusion coefficient,DD~Fe
CrWwas positive in Fe-Cr-W ternary
alloy, indicating that W accelerates interdiffusion between Fe and Cr atoms. On the other hand, the cross interdiffusion coefficient,DD~Fe CrMo
was negative in Fe-Cr-Mo ternary alloys, indicating that Mo suppresses interdiffusion between Fe and Cr atoms. In addition, the cross interdiffusion coefficient,DD~Fe
WMowas positive in Fe-Mo-W diffusion system. This result implies that Mo addition accelerates interdiffusion
between Fe and W. [doi:10.2320/matertrans.MBW200706]
(Received October 16, 2007; Accepted December 19, 2007; Published February 6, 2008)
Keywords: interdiffusion coefficient, heat resistant steel, refractory element, molybdenum, tungsten, rhenium
1. Introduction
Refractory elements such as Mo, W and Re are important for high temperature strength of advanced heat resistant high Cr ferritic steels used for power plants etc.1–3)In these steels, it is known that the (Fe, Cr)2(W,Mo) type Laves phase
precipitates together with the M23C6 carbides and the MX
carbonitride.4,5) Since microstructural evolution of these steels is closely related to their long term creep strength at the service temperatures, it is important to understand the microstructural change of them. The microstructural evolu-tion proceeds by atomic diffusion of alloying elements of the steels,6)so that it is needed to elucidate the diffusivity of the
refractory elements in Fe or Fe-Cr alloys.
The aim of this work is to investigate the diffusion behaviour of refractory elements in Fe-Cr-X (X¼W, Mo)
ternary alloys as well as Fe-Mo-W ternary alloy for elucidating the interaction between the refractory elements in iron alloys.
2. Theory
In this study, a modified ternary Boltzmann-Matano method was adopted to evaluate the interdiffusion coeffi-cients.7) This method permits to evaluate them without
determining the Matano plane, and hence the accuracy of the evaluated values can be improved.8)
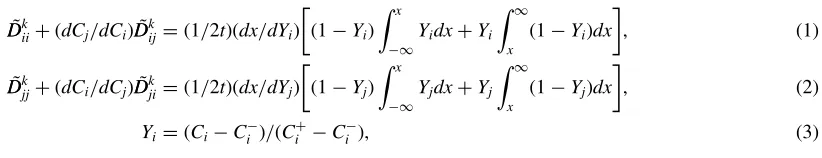
According to Whittle et al., the relations among inter-diffusion coefficients and the experimental values obtained from the concentration profiles can be expressed by the following equations.
~ D
Dkiiþ ðdCj=dCiÞDD~ijk¼ ð1=2tÞðdx=dYiÞ ð1YiÞ Zx
1
YidxþYi Z1
x
ð1YiÞdx
; ð1Þ
~ D
Dkjjþ ðdCi=dCjÞDD~jik¼ ð1=2tÞðdx=dYjÞ ð1YjÞ Zx
1
YjdxþYj Z1
x
ð1YjÞdx
; ð2Þ
Yi¼ ðCiCiÞ=ðC
þ
i C
i Þ; ð3Þ
where DD~k ii and DD~
k
jj are the main interdiffusion coefficients
which represent the influences of i and j concentration gradients on their own fluxes, andDD~k
ijandDD~kji(i6¼j) are the
cross interdiffusion coefficients which represent the influence of the concentration gradients of i and j elements on the fluxes of j and i elements, respectively. The symbol k represents the host element, i.e. Fe in this work. These diffusion coefficients represent the diffusivity of solute elementsiandjin the host elementk.Ciis the mole fraction
of i element, Cþi , C
i are the terminal mole fraction of i
element at,x¼ þ1,x¼ 1, respectively. Time is denoted by the symbolt.
From eqs. (1) and (2) adopting the experimental data obtained from the two different diffusion couples, the interdiffusion coefficients can be calculated at the composi-tion of the cross point of two different diffusion paths, in the Gibbs concentration triangle at the diffusion temperature.
3. Experimental Procedure
[image:1.595.139.550.540.619.2]Seven pairs of diffusion systems (i.e. a to g) are listed in Table 1 together with the corresponding diffusion annealing times. All systems are designed so that the diffusion occurs in
*1Graduate Student, Nagoya University, Japan
*2Corresponding author, E-mail: [email protected]
the -phase (bcc) single phase region. Each alloy for the diffusion systems was prepared by arc melting in high purity argon atmosphere. The homogenization and the grain growth of each alloy were accomplished by 50% cold rolling, followed by the annealing at 1523 K for 24 h in a quartz tube with argon atmosphere. The grain size of each alloy was estimated by an optical microscope (OM). The state of the homogenization of each alloy was estimated by a scanning electron microscope (SEM) equipped with an energy dis-persive X-ray spectroscopy (EDX). All alloys showed a single phase of the -phase solid solution and the grain diameter is more than 0.5 mm. The diffusion temperature was not more than 0.75Tm (Tm: melting temperature of the experimental alloys), so that there is little effect of interfacial diffusion on lattice diffusion in the alloy.9)The corresponding annealing temperatures are all higher than 0.75Tm in each diffusion alloy. Plate specimens were cut from the ingots.
Diffusion couples were prepared in the following way. First each side of the plate specimen was ground, then one surface of the samples were mechanically ground using the emery papers followed by polishing using 0.25mmdiamond slurry, and finally washed in acetone with an ultrasonic cleaner. These couples were held tightly with molybdenum holders as shown Fig. 1. Alumina fibers were sandwiched between the samples of the couple as a marker to find the initial interface.
Each diffusion couple was encapsulated in a quartz tube with argon gas and annealed at a given temperature for each duration as shown in Table 1. After the annealing, concen-tration profiles in the diffusion zone were measured by energy dispersive X-ray spectroscopy (EDX).
4. Results and Discussion
[image:2.595.47.546.84.190.2]4.1 Interdiffusion coefficients in Fe-Cr-X (X¼W, Mo)
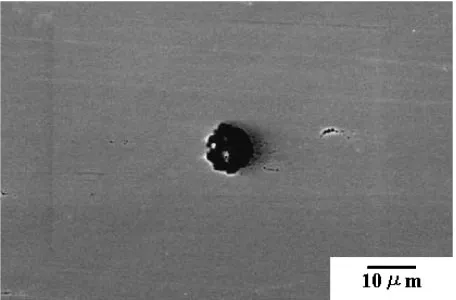
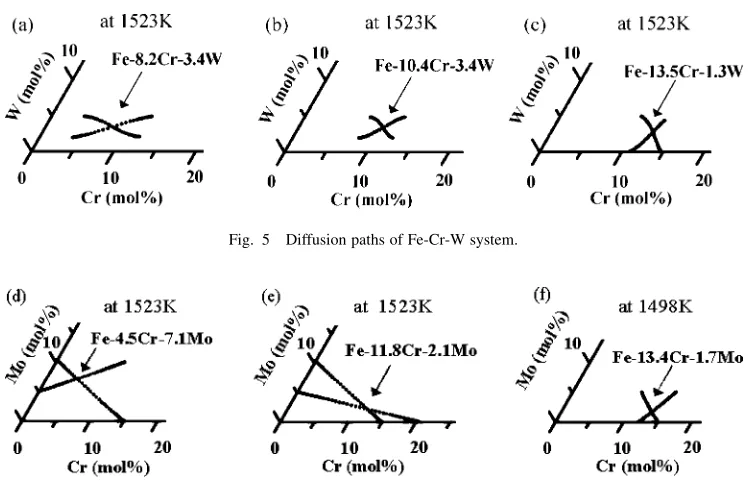
Figure 2 shows the SEM photograph of the alumina fiber between two specimens. Figures 3 and 4 show the concen-tration profiles obtained from the diffusion couples of Fe-Cr-W system and Fe-Cr-Mo system, respectively. Each profile exhibited the sigmoidal curve without any discontinuity, indicating that the diffusion occurred within thephase. The diffusion paths were obtained by plotting the data in Figs. 3 and 4 into the Gibbs triangle, and the result is shown in Figs. 5 and 6, respectively. The composition at the cross point in each figure was used for calculating interdiffusion coefficients by the modified Boltzmann-Matano method.
On the basis of the modified ternary Boltzmann-matano method (eqs. (1), (2) and (3)), interdiffusion coefficients were
obtained in the following way.10) Firstly, Y
i values are
calculated from the experimental data in Figs. 3 and 4 and they were plotted againstx. Also, the relation betweenCiand
Cj was calculated from the experimental data (Yi,Ci andCj
are defined in eqs. (1), (2) and (3)). Secondly, the each concentration profile (Yi-x, Ci-Cj) was expressed by the
suitable function obtained from the least square fitting was carried out. Thirdly, both the derivative terms and the integration terms in eqs. (1) and (2) were calculated using the functions. In particular, with respect to the integration range of eqs. (1) and (2), the x value was determined from the composition at the cross point of the diffusion paths in Figs. 5
Fig. 1 Schematic illustration showing assembly a diffusion couple and measurement points.
Fig. 2 The SEM photograph of alumina fiber between two specimens. Table 1 Diffusion systems and their diffusion annealing.
Symbol Alloy system A pair of diffusion system (mol%) Diffusion annealing
a Fe4Cr2W/Fe12Cr5W Fe4Cr5W/Fe12Cr2W 1523 K, 12 h
b Fe-Cr-W Fe8Cr2W/Fe12Cr5W Fe8Cr5W/Fe12Cr2W 1523 K, 12 h
c Fe12Cr/Fe15Cr5W Fe15Cr/Fe10Cr5W 1523 K, 24 h
d Fe5Mo/Fe10Cr10Mo Fe10Mo/Fe15Cr 1523 K, 12 h
e Fe-Cr-Mo Fe10Mo/Fe15Cr Fe5Mo/Fe20Cr 1523 K, 12 h
f Fe12Cr/Fe15Cr5Mo Fe15Cr/Fe10Cr5Mo 1498 K, 15 h
[image:2.595.310.542.214.402.2] [image:2.595.313.541.454.604.2]and 6, and the integration value corresponds to the area of Yi-xprofile. These procedures using the data obtained from
a pair of diffusion couples set up 4 independent equations, which were finally solved for 4 ternary interdiffusion coefficients. Finally, the interdiffusion coefficients were
obtained by solving the simultaneous equations. Thetvalue is diffusion annealing time.
Interdiffusion coefficients obtained from Fe-Cr-W diffu-sion system are listed in Table 2. The main interdiffudiffu-sion coefficients ofDD~FeCrCrwas about twice as large as that ofDD~FeWW,
Fig. 3 Typical concentration profiles of Cr and W obtained from (1) Fe-12Cr-2W/5W diffusion system at 1523 K and (2) Fe-8Cr-2W/Fe-12Cr-5W diffusion system at 1523 K.
Fig. 4 Typical concentration profiles of Cr and Mo obtained from (1) Fe-12Cr/Fe-15Cr-5Mo diffusion system at 1498 K and (2) Fe-15Cr/ Fe-10Cr-5Mo diffusion system at 1498 K.
Fig. 5 Diffusion paths of Fe-Cr-W system.
[image:3.595.117.483.71.223.2] [image:3.595.112.485.265.414.2] [image:3.595.111.489.452.694.2]and the sign of the all cross interdiffusion coefficients were positive. However, the value ofDD~Fe
WCrwas extremely smaller
than that of the main interdiffusion coefficient ofDD~Fe WW. This
result indicates that the existence of Cr does not affect interdiffusion between Fe and W in Fe-Cr alloys. On the other hand, the value ofDD~Fe
CrWwas in the range from one-tenth
to half of the value ofDD~Fe CrCr.
Interdiffusion coefficients obtained from Fe-Cr-Mo diffu-sion system are listed in Table 3. The main interdiffudiffu-sion coefficients of DD~FeCrCr exhibited similar values to that of
~ D
DFeMoMo, the sign of all cross interdiffusion coefficients except for the value of DD~FeMoCr at 1523 K were negative. Here, the value ofDD~FeMoCrwas extremely small compared with the main interdiffusion coefficient ofDD~FeMoMo. This result indicates that the existence of Cr does not affect interdiffusion between Fe and Mo in Fe-Cr alloys. On the other hand, the value ofDD~Fe
CrMo
was about 4% of the value of the main interdiffusion coefficient of DD~Fe
CrCr. It is thought that the diffusion path of
diffusion system f exhibit as ‘‘straight lines’’ because both Cr and Mo have almost the same main interdiffusion coeffi-cients.
As shown in Tables 2 and 3,DD~Fe
WWexhibits much smaller
value than DD~Fe
MoMo, and hence it is concluded that W is an
effective element in high temperature strength than Mo. However, it is stressed here that Mo is effective to lowering the interdiffusivity between Fe and Cr in addition to Mo diffusivity itself. As a result, there is a possibility that Mo suppresses the microstructural evolution in Fe-Cr alloy more effectively than the effect of Mo diffusivity itself.
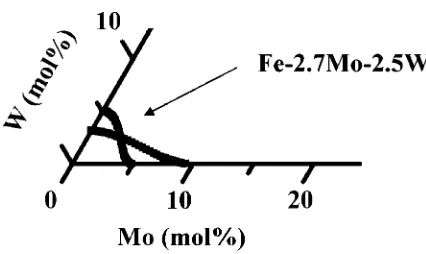
[image:4.595.55.519.80.384.2]4.2 Interdiffusion coefficient in Fe-Mo-W
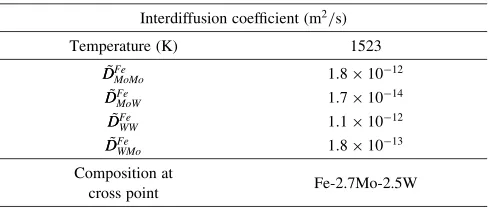
Figure 7 shows concentration profiles obtained from the diffusion couples of Fe-Mo-W system. Like the Fe-Cr-X (X¼Mo, W) system, each concentration profiles also exhibited the sigmoidal curve without any discontinuity, indicating that the diffusion occurred in thesingle phase. Two diffusion paths obtained from Fig. 7 are shown in Fig. 8. Using the composition at the cross point of the two diffusion paths, interdiffusion coefficients were calculated by the modified Boltzmann-Matano method, and the results are listed in Table 4.
[image:4.595.304.549.94.178.2]The main interdiffusion coefficient of DD~FeMoMo was also about twice value ofDD~FeWWin the Fe-Mo-W diffusion system. The sign of the two cross interdiffusion coefficients was both positive. The value ofDD~FeMoW was much smaller than that of
Table 2 Interdiffusion coefficients obtained from Fe-Cr-W diffusion system.
Interdiffusion coefficient (m2/s)
Temperature (K) 1523 1523 1523
~
D DFe
CrCr 1:61012 1:71012 2:61012
~
D DFe
CrW 1:910
13 2:31013 1:41012
~
D DFe
WW 8:610
13 8:81013 1:01012
~
D DFe
WCr 3:210
14 3:51014 5:21014
Composition at
cross point Fe-8.2Cr-3.4W Fe-10.4Cr-3.4W Fe-13.5Cr-1.3W
Table 3 Interdiffusion coefficients obtained from Fe-Cr-Mo diffusion system.
Interdiffusion coefficient (m2/s)
Temperature (K) 1523 1523 1498
~
D DFe
CrCr 2:01012 1:51012 1:41012
~
D DFe
CrMo 9:510
14 5:91013 3:71014
~
D DFe
MoMo 2:010
12 2:21012 1:41012
~
D DFe
MoCr 3:710
14 9:41014 4:21014
Composition at
cross point Fe-4.5Cr-7.1Mo Fe-11.8Cr-2.1Mo Fe-13.4Cr-1.7Mo
Fig. 7 Typical concentration profiles of Mo and W obtained from (1) Fe-5W/Fe-5Mo diffusion system at 1523 K and (2) Fe-3W/Fe-10Mo diffusion system at 1523 K.
[image:4.595.47.292.94.195.2] [image:4.595.108.488.228.381.2] [image:4.595.319.532.438.565.2]the main coefficient ofDD~FeMoMo. This result indicates that the existence of W does not affect the interdiffusion between Mo and Fe in Fe-Mo-W system. On the other hand, the value of
~ D DFe
WMowas about 15% of the value of the main coefficient of ~
D DFe
WW. These results suggest that the existence of Mo
suppresses interdiffusion between Fe and W in Fe-Mo-W system.
5. Conclusions
(1) The main interdiffusion coefficient ofDD~Fe
CrCr was about
twice as large as that ofDD~Fe
WWin the Fe-Cr-W diffusion
system, whereas the main interdiffusion coefficient of ~
D
DFeCrCr was a similar value to DD~FeMoMo in the Fe-Cr-Mo diffusion system.
(2) The existence of W accelerates the interdiffusion between Fe and Cr in Fe-Cr-W system, whereas that of Mo suppresses the interdiffusion between Fe and Cr in Fe-Cr-Mo system.
(3) The main interdiffusion coefficient ofDD~Fe
MoMowas about
twice value ofDD~Fe
WWin Fe-Mo-W diffusion system.
(4) The existence of Mo suppresses interdiffusion between Fe and W in Fe-Mo-W system.
REFERENCES
1) T. Fujita: Tetsu-to-hagane76(1990) 1053–1059.
2) H. Naoi, M. Oogami, Y. Hasegawa, H. Mimura and T. Fujita: Advanced Heat Resistant Steels for Power Generation, eds. R. Viswanathan and J. Nutting, (Institute of Materials, London, 1999) 257–269.
3) Y. Murata, K. Kawamura, M. Kamiya, M. Morinaga, R. Hashizume, K. Miki, T. Azuma and T. Ishiguro: ISIJ Int.42(2002) 1591–1593. 4) L. M. Lundin: Scr. Mater.34(1996) 741–747.
5) Y. Murata, M. Morinaga, R. Hashizume, K. Tamaki, T. Azuma, Y. Tanaka and T. Ishiguro: Mater. Sci. Eng., A282(2000) 251–261. 6) J. P. Poirier:Creep of crystals, (Cambridge University Press, London,
2005), pp. 76–93.
7) D. P. Whittle and A. Green: Scr. Metall.8(1974) 883–884. 8) M. S. A. Karunaratne, P. Carter and R. C. Reed: Acta Mater.49(2001)
861–875.
9) D. A. Porter and K. E. Easterling:Phase Transformations in Metals and
Alloys, (Van Nostrand Reinhold, England, 1981) p. 102.
[image:5.595.47.291.93.197.2]10) M. Hattori, N. Goto, Y. Murata, T. Koyama and M. Morinaga: Materials Trans.46(2005) 163–166.
Table 4 Interdiffusion coefficients obtained from Fe-Mo-W diffusion system.
Interdiffusion coefficient (m2/s)
Temperature (K) 1523
~
D DFe
MoMo 1:81012
~
D DFe
MoW 1:710 14
~
D DFe
WW 1:110 12
~
D DFe
WMo 1:810 13
Composition at