Detection of Trace Water Vapor Using SiO
x-Coated Ball SAW Sensor
Kosuke Takayanagi
1,+, Shingo Akao
1, Takayuki Yanagisawa
1, Noritaka Nakaso
1, Yusuke Tsukahara
2,
Satoshi Hagihara
3, Toru Oizumi
3, Nobuo Takeda
3,4, Toshihiro Tsuji
3and Kazushi Yamanaka
31Toppan Printing Co. Ltd., Katsushika-gun, Saitama 345-8508, Japan 2Riken Genesis Co. Ltd., Yokohama 230-0045, Japan
3Department of Materials Processing, Tohoku University, Sendai 980-8579, Japan 4NOTAS Technologies, Sendai 982-0825, Japan
In manufacturing process of semiconductor, blue light emitting diode (LED), and lithium ion battery, detection and monitoring of trace water vapor (<1 µmol/mol) are significantly important techniques. We have been researching about detection of trace water vapor with high speed and sensitivity by using ball surface acoustic wave (SAW) sensor.
In this paper, we tried to detect trace water vapor by coating silicon oxide (SiOx) on ball SAW sensor using solgel method. It was confirmed that SiOx-coated ball SAW sensor could detect water vapor in a wide range from¹95 to 0°C in frost point (0.0356.0©103 µmol/mol in concentration) and its response time to frost point change from¹70 to¹60°C was one half of that of a chilled-mirror hygrometer. [doi:10.2320/matertrans.I-M2014807]
(Received August 19, 2013; Accepted April 15, 2014; Published June 25, 2014)
Keywords: ball surface acoustic wave (SAW) sensor, hygrometer, trace water vapor, silicon oxide, solgel method
1. Introduction
In manufacturing process of semiconductor, blue light emitting diode, and lithium ion battery, the presence of trace water vapor in material gases may cause a degradation of lifetime and yield of products. So detection and monitoring of trace water vapor (<1 µmol/mol) are significantly important techniques. Chilled-mirror hygrometers and cavity ring-down spectroscopy (CRDS) have been conventionally used to detect trace water vapor.1)However, there are some problems.
Chilled-mirror hygrometers are not fast nor sensitive enough in low frost point range. CRDS is faster and more sensitive than chilled-mirror hygrometers, but they are large and expensive due to the need for a long optical cavity, so it is difficult to mount them into gas piping.
To solve these problems, we have studied detection of trace water vapor using ball the surface acoustic wave (SAW) sensor with propagating SAW on the surface of piezoelectric sphere. A unique propagation phenomenon of a SAW on a spherical substrate was discovered by Yamanaka et al.2) in
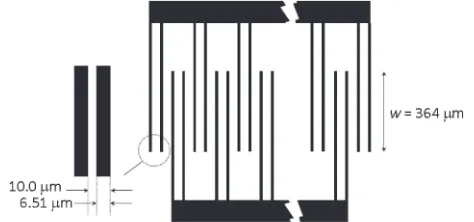
2000. When a SAW is excited on spherical surface by a properly designed interdigital transducer (IDT), a collimated SAW propagates around the equator hundred of times with neither diffraction nor convergence. The condition of naturally collimated SAW is shown as eq. (1).3)
w¼pffiffiffiffiffiffiffiD ð1Þ
Wherewis width of IDT,is wavelength of SAW, andDis diameter of sphere.
The collimated SAW can be detected after propagating multiple turns along the equator by the same IDT for excitation. The propagation characteristics of the SAW such as velocity and amplitude are affected by absorbed and/or reacted molecules on the surface, and then changes of such characteristics are accumulated by repeated interactions with the round propagation of the collimated SAW. Hence, the ball
SAW sensor has higher sensitivity than conventional SAW sensors (Fig. 1).
In our previous study, some quartz ball SAW sensor without sensitivefilm could detect 1 µmol/mol water vapor.4)
It was assumed that a damaged layer of amorphous silicon oxide formed during lapping the surface of quartz ball absorbed water vapor. However, its mechanism is not clear5) and it is difficult to reproduce the sensitive silicon oxide layer.
Thus, we supposed that a sensitive film of amorphous silicon oxide could replace the damaged layer, and it could detect trace water vapor. As a method of coating an amorphous silicon oxidefilm, there are solgel method6) or
ion beam deposition.7) Pfeifer reported detection of water
vapor using flat SAW sensor with amorphous silicon oxide (SiOx)film,6)but detection of below 100 µmol/mol was not
Fig. 1 Principle of ball SAW sensor.
+Corresponding author, E-mail: kosuke.takayanagi@toppan.co.jp
Special Issue on Laser Ultrasonics and Advanced Sensing 2013
[image:1.595.315.541.330.569.2]achieved. In this paper, to improve detection performance, ball SAW sensor was coated with SiOx film and its
performance was compared with that of a chilled-mirror hygrometer.
2. Experimental Procedure
2.1 Fabrication of ball SAW sensor
An IDT (Cr, 150 nm) was formed on the surface of º3.3 mm quartz sphere by using subtractive method. Based on eq. (1), the width of IDT was designed for the natural collimation of 80 MHz SAW. Furthermore, this IDT can generate fundamental wave (80 MHz SAW) and third harmonic wave (240 MHz SAW) (Fig. 2). By using two frequencies SAW we achieved the temperature compensation to remove the delay time change due to temperature effect. In this case, the 80 and 240 MHz SAW were not wider than the IDT realizing a narrow beam favorable for undisturbed propagation, though the 240 Mz SAW was focused after approximately 90 and 270° propagation. In this condition, SAW can propagate on the surface of quartz sphere without diffusion due to diffraction.8)
2.2 SiOxcoating on the surface of ball SAW sensor
SiOxwas synthesized by using solgel method and coated
on the surface of ball SAW sensor. 3.47 g tetraethoxysilane (TEOS), 0.75 g isopropanol (IPA), and 1.50 g 0.1 N hy-drochloric acid were mixed and stirred by sonication (27, 45, 100 kHz, 60 min). TEOS was polymerized by hydrolysis and resulted in SiOx. After sonication, the mixture was diluted
with IPA and 0.5 mass% SiOxsolution was obtained.
The surface of propagation route of ball SAW sensor was coated with SiOx solution using off-axis spin coating.9)
Condition of off-axis spin coating was 3000 rpm, 20 s. The thickness of SiOxwas revealed as 1029 nm from
measure-ment using interference microscope.
2.3 Generation of trace water vapor and supply onto
ball SAW sensor
N2 gas was flowed into bubbler to humidify with ¹95,
¹70, ¹60, ¹50, ¹40, ¹30, ¹20, ¹10, 0°C in frost point. (0.0356.1©103µmol/mol when it was converted to the concentration, see Table 1.) Humidified N2gas was supplied
to ball SAW sensor and chilled-mirror hygrometer in parallel as shown in Fig. 3.
2.4 Pulse wave generation to ball SAW sensor and
wavelet transform
A voltage pulse was generated by an ultrasonic pulse generator and supplied to a double electrode IDT on the surface of ball SAW sensor. The output signal of the SAW was recorded with a digitizer.
Wavelet transform was carried out as,
ðWgÞða; bÞ ¼p1ffiffiffia Z1
1
gðtÞ¼ tab
dt ð2Þ
where,
¼ðtÞ ¼ 1ffiffiffi
³
4
p
ffiffiffiffiffiffi½
0 £
r
expð½02=£Þ2t2expi½
0t ð3Þ
is Gabor function used as the mother wavelet with parameters
½0¼2³f,£ ¼5:337. Fig. 2 Design of IDT on ball SAW sensor. This IDT could generate 80 and
[image:2.595.51.288.71.182.2]240 MHz SAW on the surface of sensor.
Table 1 Relation between frost point and water vapor concentration.10)
Frost point, °C Water vapor concentration, µmol/mol
0 6028
¹10 2563
¹20 1019
¹30 375
¹40 127
¹50 38.8
¹60 10.7
¹70 2.58
¹95 0.0347
[image:2.595.303.551.85.210.2] [image:2.595.79.522.242.369.2]Figure 4(a) shows a RF waveformg(t) of SAW at 5th turn. Also the intensity of wavelet transform at the fundamental (80 MHz) and the third harmonic (240 MHz) frequencies are shown. In Figs. 4(b) and 4(c), the RF waveform (dotted curves) and real part of the wavelet transform (chained curves) are shown around the peaks of the wavelet intensity (solid curves). And then, the search ranges of the zero cross point were determined as the thick vertical lines.
Based on the zero cross point thus obtained, the delay time of 80 and 240 MHz SAW was calculated. The amplitude was calculated from the peak of wavelet which is 90° away from the zero cross point. While changing the frost point of the N2
gas, delay time change and amplitude were measured.
3. Results
The dry N2 gas of ¹95°C frost point was humidified to
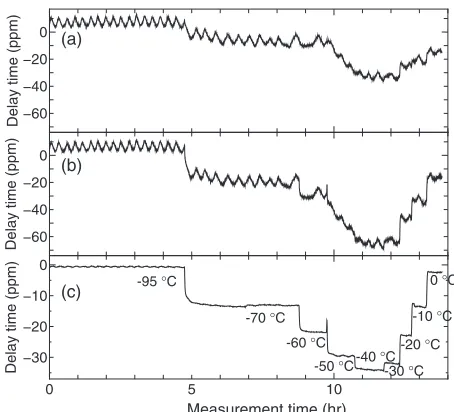
¹70,¹60,¹50,¹40,¹30,¹20°C frost point and supplied to the ball SAW sensor cell and the chilled-mirror hygrometer. Figure 5 shows delay time of SAW while the frost point was changed in the 6 steps. Change of the frost point was carried out after the measurement cycle of chilled-mirror hygrometer was completed turning on the“controlled” identifier. Thus, the measurement time in each frost point is not constant.
The delay time of both 80 and 240 MHz SAW was shifted to the negative direction in 12 h from the start of measure-ment (Figs. 5(a), 5(b)). After that, it was shifted to the
positive direction. Furthermore, periodic variation of about 20 min was observed in both frequencies. This periodic variation is the effect of temperature fluctuation due to air conditioning of the lab. To compensate the temperature
fluctuation, the delay time of 80 MHz SAW was subtracted
(a)
(b) (c)
Fig. 4 Wavelet transformation condition; (a): RF waveform of SAW at 5th turn, (b): calculation range of 80 MHz wave (from 16.3610 to 16.3660 µs), (c): calculation range of 240 MHz wave (from 16.3935 to 16.3960 µs).
−60 −40 −20 0
−60 −40 −20 0
0 5 10
−30 −20 −10 0
(a)
(b)
(c) -95 °C
-70 °C
-60 °C
-50 °C -40 °-30 C °C -20 °C
-10 °C 0 °C
Delay time (ppm)
Delay time (ppm)
Delay time (ppm)
Measurement time (hr)
Fig. 5 Delay time of ball SAW sensor when frost point was changed from
[image:3.595.106.485.65.394.2] [image:3.595.312.539.452.658.2]from that of 240 MHz SAW. Then, the periodic variation was removed and response of delay time due to frost point change was obtained (Fig. 5(c)). In the subtraction, the coefficient was set to 0.95, so that it can remove periodic variation most successfully.
Figures 6(a), 6(b) are enlarged view when frost point was changed from ¹95 to ¹70°C and from ¹70 to ¹60°C in Fig. 5(c), respectively. In these cases, response times (defined
as the time until the value changed up to 90%) were 22 and 8 min, respectively.
Figure 7 shows a result of measurement by using chilled-mirror hygrometer. Chilled-chilled-mirror hygrometer also could detect frost point change, however in this case, response times when frost point was changed from¹95 to¹70°C and from ¹70 to ¹60°C were 185 and 16 min, respectively (Figs. 7(b), 7(c)). From these results, it was shown that ball
(a) (b)
Fig. 6 Delay time change for the frost point change (enlarged view of Fig. 5(c)); (a): from¹95 to¹70°C, (b): from¹70 to¹60°C.
(a)
(b) (c)
[image:4.595.115.479.66.240.2] [image:4.595.109.484.275.646.2]SAW sensor could detect frost point change faster than conventional chilled-mirror hygrometer.
Figure 8 shows amplitude change of SAW in 5th turn. While frost point was changed from¹95 to 0°C, amplitude change of 80 MHz SAW and 240 MHz SAW were shifted about 0.4 and 6 dB to negative direction, respectively (Figs. 8(a), 8(b)). In the case of 240 MHz SAW, response of amplitude change due to frost point change was clear, but in 80 MHz SAW, response due to frost point change was not clear. When amplitude change of 80 MHz wave was subtracted from that of 240 MHz wave, response of amplitude change due to frost point change was also confirmed (Fig. 8(c)). While frost point was changed from
¹95 to 0°C, amplitude was shifted to negative direction monotonically. From these results, it was confirmed that SiOx-coated ball SAW sensor could detect change of frost
point from ¹95 to 0°C from both delay time change and amplitude change.
4. Discussions
In the range of the low frost point (from¹95 to¹40°C), the SAW velocity became faster as the water vapor was absorbed on SiOx film on the surface of ball SAW sensor,
suggesting the increase of elasticity of SiOxfilm. On the other
hand, in the case of high frost point (from ¹40 to 0°C), the SAW velocity became slower suggesting that the mass loading effect due to adsorption of water vapor to SiOx
became dominant.
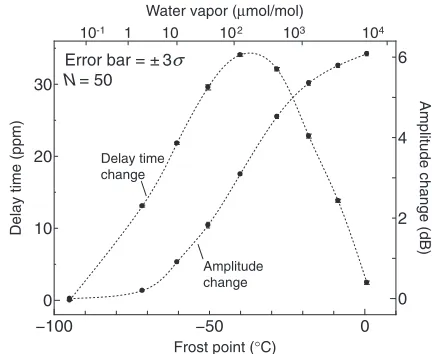
Figure 9 shows the frost point (horizontal axis) depend-ence of the delay time and the amplitude (vertical axis) evaluated from the equilibrium value of delay time (Fig. 5) and amplitude (Fig. 8). It is shown that the delay time showed peak value at around ¹40°C, and its slope showed maximum value at around ¹70°C. On the contrary, the amplitude increased monotonically, and its slope showed maximum value at around¹40°C.
Therefore, by using the amplitude we can measure the frost point from 0 to ¹50°C, and using the delay time we can
measure the frost point from ¹50 to ¹90°C. Thus, it was found that we can measure the frost point in a wide range from¹95 to 0°C. Measurement error were 0.45°C at¹70°C in frost point calculated from delay time change, and 0.55°C at¹40°C in frost point calculated from amplitude change. In this time, the value of delay time and amplitude change were determined by average of 50 data points (N=50) and the error was evaluated at®«3· (®and ·were average value and standard deviation, respectively).
From these results, it was confirmed that SiOx-coated ball
SAW sensor could detect water vapor in a wide range from
¹95 to 0°C in frost point. Especially, when frost point was from¹95 to ¹60°C, it was confirmed that response time to frost point change of ball SAW sensor was one half of that of a chilled-mirror hydrometer.
Finally it is noted that, in Figs. 5(b), 5(c), spikes are observed when the frost point was¹60°C. It can be supposed that they are due to real humidity change caused by the pressurefluctuation when switching theflow path of N2gas
to change the frost point, though it is too fast to be measured by the chilled mirror hygrometer.
5. Conclusions
When detection of trace water vapor by using ball SAW sensor, it was assumed that a damaged layer of amorphous silicon oxide formed during lapping the surface of quartz ball SAW sensor absorbed water vapor. However, its mechanism is not clear and it is difficult to reproduce the sensitive silicon oxide layer. So we supposed that a sensitive film of amorphous silicon oxide could replace the damaged layer, and it could detect trace water vapor. We synthesized SiOx film by using solgel method and tried to detect trace water vapor by using SiOx-coated ball SAW sensor. It was
confirmed that SiOx-coated ball SAW sensor could detect
water vapor in a wide range from¹95 to 0°C in frost point (0.0356.0©103µmol/mol in concentration) by using the
responses both delay time change and amplitude change. SiOx-coated ball SAW sensor has characteristics that its
response time to frost point change from¹70 to¹60°C was
−100 −50 0
0 10 20 30 0 2 4 6 Error bar = 3± σ
N= 50
10-1 1 10 102 103 104
Water vapor (μmol/mol)
Frost point (°C)
Amplitude change (dB)
Delay time (ppm)
Delay time change
Amplitude change
Fig. 9 Frost point dependence of delay time and amplitude change. Horizontal axis represents frost point and water vapor concentration at that time, vertical axis represents delay time and amplitude change. −0.5 0 −6 −4 −2 0
0 5 10
−6 −4 −2 0 (a) (b)
(c) -95 °C -70 °C -60 °C
-50 °C -40 °C
-30 °C -20 °C
-10 °C 0 °C
Measurement time (hr)
Amplitude change (dB) Amplitude change (dB) Amplitude change (dB)
[image:5.595.53.281.65.265.2] [image:5.595.317.533.70.247.2]one half of that of a chilled-mirror hydrometer and it is much more compact. So it is promising to apply the SiOx-coated
ball SAW sensor to monitoring gases in manufacturing process of semiconductor, LED, and lithium ion battery.
Acknowledgments
Detection of trace water vapor using ball SAW sensor described in this paper was greatly supported by GE Sensing & Inspection Technologies Co. Ltd., such as to provide experimental environment and to advice on the experimental results. We would like to express our sincere gratitude to them.
REFERENCES
1) H. H. Funke, B. L. Grissom, C. E. McGrew and M. W. Raynor:Rev. Sci. Instrum.74(2003) 3909.
2) K. Yamanaka, H. Cho and Y. Tsukahara:Appl. Phys. Lett.76(2000) 2797.
3) A. Ishikawa, N. Nakaso, N. Takeda, T. Mihara, Y. Tsukahara and K. Yamanaka:Appl. Phys. Lett.83(2003) 4649.
4) N. Takeda and M. Motozawa:Int. J. ThermoPhys.33(2012) 1642 1649.
5) S. Hagihara, T. Saito, R. Mihara, T. Oizumi, N. Takeda, S. Akao, T. Ohgi, K. Takayanagi, T. Yanagisawa, N. Nakaso, T. Tsuji and K. Yamanaka: Laser Ultrasonics and Advanced Sensing (LU2013), Yokohama, Japan, June 2528, (2013) p. 86.
6) K. B. Pfeifer:Langmuir11(1995) 4793.
7) K. B. Pfeifer, M. J. Kelly, T. R. Guilinger, D. W. Peterson, J. N. Sweet and M. R. Tuck: Proc. Int. Conf. on Microcontamination, San Jose, CA Oct. 46, (1994) pp. 8797.
8) S. Ishikawa, H. Cho, K. Yamanaka, N. Nakaso and Y. Tsukahara:Jpn. J. Appl. Phys.40(2001) 3623.
9) K. Kobari, Y. Yamamoto, M. Sakuma, S. Akao, T. Tsuji and K. Yamanaka:Jpn. J. Appl. Phys.48(2009) 07GG13.