Abstract— This paper presents an mathematical model that establishes the relation between the relevant cutting process parameters and surface quality, cutting forces and rate removal, in deburring process. The construction of cutting tool that one use in determining the experimental data is also presented. The mathematical model is determined by using multifactorial analysis. Directions towards the optimum choice of the parameters for deburring process are given.
Index Terms—cutting force, deburring, multifactorial analysis, optimization, surface quality.
I. INTRODUCTION
The process of deburring consists of removal burrs (rough edges left on cast, machined or punched material) or to plain a special complex external (internal) surface, this being a necessity as a surface finish requirement. The cutting tool used in this process is the rotary file. In this process one can use robots arms [1]. From this point of view it is important to have data regarding the cutting force, contact between the workpiece and cutting tool together with data about surface quality [2] and removal rate. The data with respect to above mentioned parameters are poor.
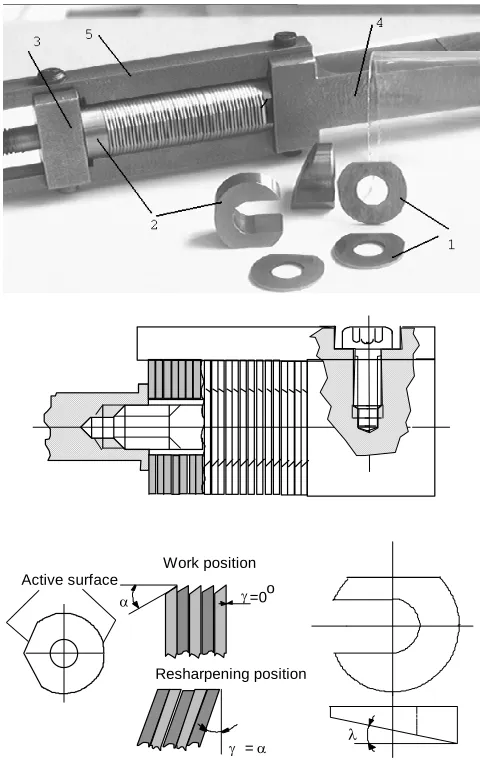
In order to determine the experimental data one uses a new construction of cutting tool. The cutting tool is made by detachable inserts 1 that can be orientated in 3D with the help of special design wedges 2, Fig. 1 [3]. Thus, we can obtain several cutting geometry (by changing the clearance angle α
and the cutting edge inclination angle λ) on the same body of the file. One of these positions brings the clearance surfaces of the teeth into the same plane thus being possible the mechanically continuous resharpening (eliminating the wear) of inserts with the help of an abrasive wheel [4]. The problem that is rising is to appreciate the material removal rates, tool life, cutting forces and surface quality achievable by this process.
II. MAJOR VARIABLES
The main geometric and process variables together with their variation range are indicated in Table 1. These variables are: Fp - pushing force (it act from working piece towards the
Manuscript received March 4, 2007.
Catalin. G. Dumitras is with the Technical University “Gh. Asachi”, Iasi, B-dul Mangeron No. 59A, 700050, Romania (corresponding author to provide phone: +40-232-242109; fax: +40-232-242109; e-mail: dumitrascata@ yahoo.com).
file); v - cutting speed; α - clearance angle; λ - inclination angle; HB - hardness of the working material (40Cr10). In order to establish the relation between these variables and objective functions mentioned above, it was performed a multifactorial tools geometry and workpiece materials under repeatable conditions. Basically, it consists from analysis using a 25
central composite rotatable second order design [5]. This design was chosen having in view: the lack of information
An Approach on Micro-Cutting (Deburring)
Process
Catalin G. Dumitras
γ=0o α
Work position
Resharpening position
γ =α Active surface
[image:1.612.319.559.274.654.2]λ
about the interdependence action of the variables, the precision of the response surface, the reduce number of the experiments that imply small costs.
Table 1 The variation of the major variables Codify
variable
Natural variable
- 2 -1 0 1 2 Δ p
x1=Fp
(daN)
8 12 16 20 24 + 4
v (m / min) 1 1.4 2 2.8 4 - x2 = lg v 0 0.14 0.301 0.447 0.602 0.14
α [°] 12 16 20 24 28 -
x3 = α [rad] 0.209 0.279 0.349 0.418 0.488 0.06
λ [°] 5 10 15 20 25 -
x4 = λ [rad] 0.087 0.174 0.261 0.349 0.436 0.08
x5 = HB 200 250 300 350 400 +50
III. TEST EQUIPMENT
One develop an test system, to simulate the real work conditions, which can control the force that keep contact between the cutting tool and the workpiece, also measure the cutting force values and the dynamicity of the process in order to know if the file is working properly. This stand of experiment, shown in Fig. 2, use an Kistler device mounted on the table of a slotting machine TOS KURIM, an 386 computer, an guide way and a system which give a certain pushing force made by a wire, two wheels, two plates and several weights. This device, together with the clamped probe material (40Cr10), could slide only in one direction, towards the cutting tool. The pushing force between the probe material and the file is control by the weights. On this experimental stand we determine the components of the cutting force.
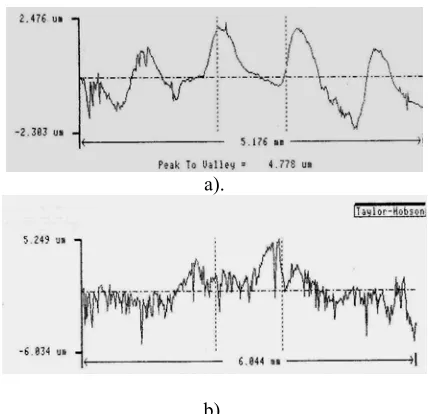
Also, in order to measure the roughness it had been used two Rank Taylor-Hobson devices: Talysurf - for measuring the topography of the manufactured surface and Surtronic 3 - for measuring Ra.
IV. RESULTS
The objective function, namely surface quality, which must be determine and optimized, is:
HB a a a F a v a Ra
a
C
e
e
e
e
e
R
=
⋅
1lg⋅
2 p⋅
3α⋅
4λ⋅
5 (1)where: Ra -arithmetic mean roughness; CRa- constant
In order to determine the constants, a1 ... a5 from equation
(1) it was carried 32 measuring (based on an experiment programming matrix) from which 6 was replicated. The replicated experiments determine the precision of the experiment.
The measurements were made on two reciprocal directions from which one was parallel with the feed direction (Fig. 3) [6].
Figure 2. Several picture presenting the test equipment
a).
[image:2.612.40.291.96.278.2]b).
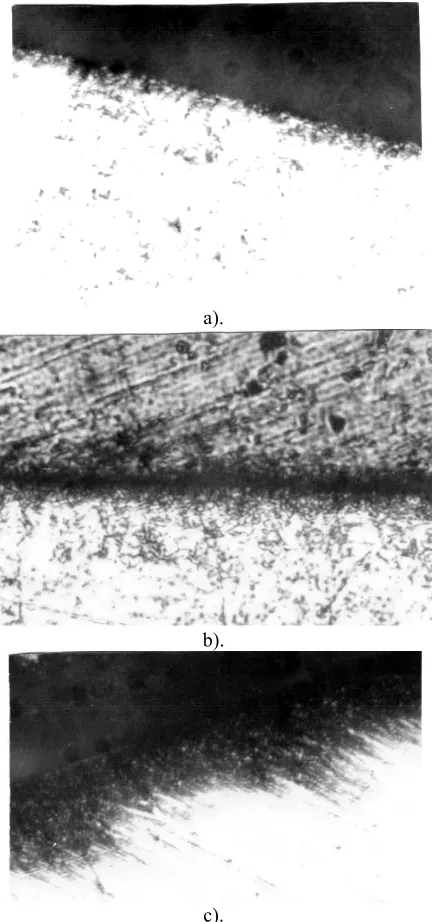
[image:2.612.332.546.473.680.2]In Fig. 4 one present photos of the superficial layer of the workpiece after cutting with a normal file and a continuously resharped file in order to measure its height and to compare them.
The results are encouraging and it show that the height of the destroy layer is half as in normal cutting. This could be explained by the cutting edge radius which is smaller by effect of resharpening.
a).
b).
c).
Fig. 4. Superficial layer: a). hardness HB 200; b). hardness HB 300; c). hardness HB= 400, normal cutting
The data obtained from these measurements was processed and the results are given in Table 2. The trust level of the mathematical model was tested using an F-test and a Shapiro-Wilk test (for the replicated measurements).
As an example one present some graphics obtain that indicate the way roughness is influenced by one of the variable
[image:3.612.320.555.146.703.2]or by the interdependence of the two variables are given in Fig. 5. These graphics are obtained by making 3 or 4 variable constant (the middle value) and varying the remaining variable. The obtained values of the constants are presented in Table 2. Further, it will remain to gather together all the information and to extract the optimum domain of working on surface roughness Ra
Table 2. The exponents expressions Objective
Function and its
Coefficients Exponent The Exponent Expression a1 -1.83 + 9.13 α +0.29 Fp - 0.02 HB + 7.23 λ
- 4.6 lg v
Ra a2 0.01 - 0.35 α +0.01 Fp +
0.0004 HB - 0.48 λ
CRa = e- 16.83 a3 19.31 - 0.49 α - 24.34 λ
a4 38.64 - 21.47 λ
a5 0.06 - 0.03 α - 0.0007 HB - 0.047 λ
a).
b).
c).
Fig. 5. The influence of the cutting speed (a) and clearance angle (b) upon the objective function "Ra –surface
quality"
Working Conditions
Graph Fp [daN] [ α° ]
λ
[ ° ]
HB n [d.s. / min]
a). 12 20 15 300 -
b). 12 - 15 300 100
[image:3.612.66.282.156.617.2]The obtaining data was processing with the help of the Mathematica 2.2 program.
Further one carried out experiments in order to determine the influence of the cutting process parameters upon the cutting forces.
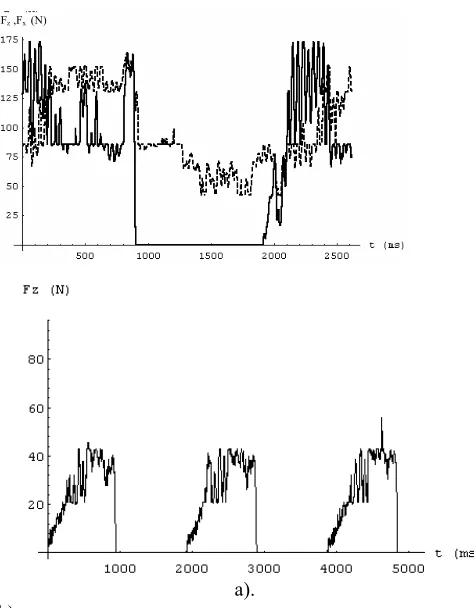
In Fig. 6,a it is present a Fz (continuous line) and Fx (dot
line) graph during a double stroke. The condition in which the experiment was carry is: n=100 m/min, Fp=16 daN, clearance
angle α= 20°, inclination angle λ=15°, the Brinell hardness HB=300. In the graph, on the time axe, one division represents 0.0024 s. From the graph it can be observe that Fz has some
gaps. This can be explaining by the file tolerance in both planes (longitudinal and transversal). This tolerance conduct to a variation of the depth of cut during the stroke and also to the variation of the total length of cut (taking into account that we have a number z of teeth simultaneous in contact with the workpiece). Regarding the Fx force it can be seen that it has a
slower decrease than Fz force during the change between the
active stroke and passive stroke. This can be explain by the fact that between the dynamometer and the machine tool table there is a friction force that acts this way [7]. From fig.2,b one can observe that the filing process which use a usual file is more calm this being possible due to the transversal chip breaker. But the filing of the probe material, in the given condition, was almost impossible, only a small quantity of material being remove through this type of process.
Fz ,Fx (N)
[image:4.612.316.572.230.409.2]a). b).
Fig. 6 The dynamicity of the Fz and Fx forces: a). Pz, Px
measured on one stroke; b). the force in an filing process which use an usual file
As one mention before, in order to obtain the dependence between cutting process parameters and cutting force one use a test procedure based on central composite and rotatable design. We consider that the objective function has the following form:
HB a a a F a v a P
z
C
e
e
e
e
e
P
p z 5 4 3 21lg
⋅
⋅
⋅
⋅
⋅
=
α λ (2)The values of the exponents ai (i=1,...,5) are given in the Table
3.
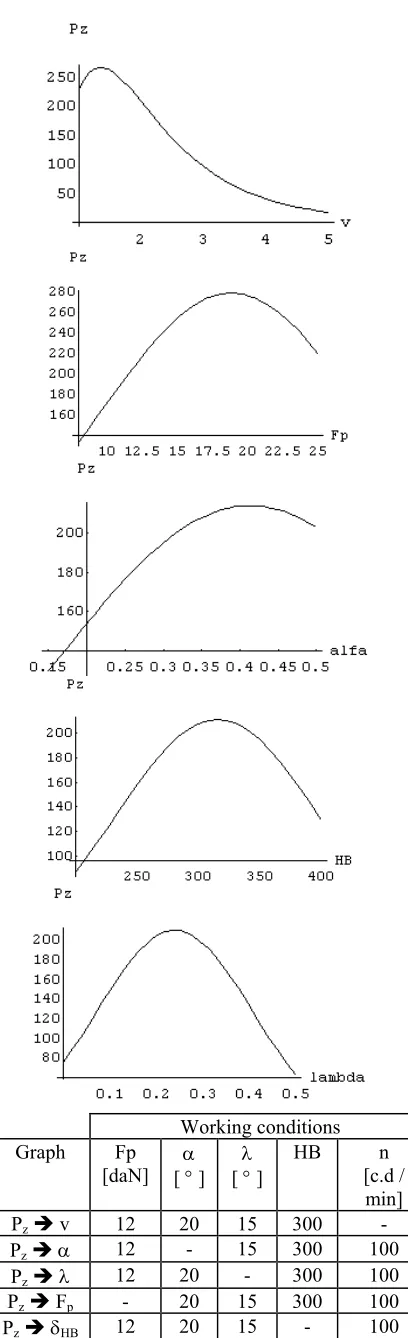
Having in view this graph dependence (Figure 7) one can determine an optimum range for the cutting tool geometry and the cutting regime parameters with respect to cutting forces. Table 3 Objective function and its coefficients
In the following, we will present the way the rate removal is influenced by cutting parameters presented in the Table 1. Based on calculus algorithm one obtains the following regression equation: HB a a a a v lg a
Q p 3 4 5
F 2
1
e
e
e
e
e
C
Q
=
α λ (3)where the coefficients CQ and ai (i=1,5) are given in the next
table:
Table 4 Objective function and its coefficients
In Fig. 8 one presents the 2D graphics which indicate the dependence of the rate removal with respect to cutting process parameters. Objective function and its coefficients Exponen t Exponents expression
a1 2.4546 - 16.1527 α +0.613189
FP - 0.0199165 δHB +15.416 λ -
8.54105 ln V
Pz a2 -0.05031 + 0.2958 α +
0.00012145 δHB -0.1439 λ -
0.00625 FP
CPz = e-11.1868 a3 15.3879 - 28.4467 λ - 7.21813 α
a4 31.3234 - 17.853 λ
a5 0.06159 - 0.002203 α
-0.0526011 λ - 0.00006745 δHB
Objective function and
its coefficients
Exponent Exponents expression
a1 -8.68 + 5.63 α - 0.11 FP + 0.013 δHB + 19.42 λ + 2.15 ln v Q a2 0.43 + 1.03 α - 0.023 FP + 0.0003
δHB - 0.07 λ
CQ = e-1.3235 a3 - 37.74 + 53.302 α - 8.05 λ
a4 - 13.05 + 20.15 λ
a5 0.064 - 0.0531 α - 0.0001 δHB -
[image:4.612.48.285.374.678.2]Working conditions
Graph Fp
[daN] [ α° ]
λ
[ ° ]
HB n [c.d. / min]
Q Î v 12 20 15 300 -
Q Îα 12 - 15 300 100
Q Îλ 12 20 - 300 100
QÎ
[image:5.612.67.271.41.710.2]HB 12 20 15 - 100
[image:5.612.91.534.52.706.2]Fig. 8 The influence of the optimization variables upon the objective function "Q –rate removal"
Fig. 7 The influence of the optimization variables upon the objective function "Pz –principal cutting force"
Working conditions
Graph Fp [daN] [ α° ]
λ
[ ° ]
HB n [c.d / min]
PzÎ v 12 20 15 300 -
PzÎα 12 - 15 300 100
PzÎλ 12 20 - 300 100
PzÎ Fp - 20 15 300 100
V. CONCLUSION
It can be see from Fig. 5 that the roughness is slightly decreasing with respect to cutting speed. This could be explain, according to [3], that in low speed domain there are adhesion to the cutting edge and this adhesion disappears with the increasing of the speed. Also, we can that the clearance angle α
has a negative influence on roughness. This is given by the fact that the clearance angle is strictly dependent with rake angle γ. An increasing of the clearance gives a high negative value of the rake angle, thus increasing the forces and vibration in the system. The inclination angle λ has a complex influence on roughness. We can see that at small value we have an increase of the roughness until a certain value, after it the roughness decrease. This could be explaining by the fact that this angle determines the entrance shock of the cutting tooth. At small value this shock is high determining a vibration in the system. With increasing of the value this shock become smaller and the vibrations become smaller, too. In Fig 7 one can see that the force is decreasing with the increase of the cutting speed, this can be explained by the fact that the depth of cut is decreasing with the increase of cutting speed. Also, one can see that the cutting force is increasing with the pushing force Fp. This is due
to the increase of the cutting depth. At a certain value this pushing force is compensate by the reaction force. The increasing of the clearance angle lead to the increasing of the cutting force. This can be explained by the fact that this angle is dependent with the back rake angle which has negative value. Thus one obtains a complex cutting process. In Fig.8 both angles are measure in radians. In Fig. 8 is representing the influence on the rate removal. As it is expect the influence of the cutting speed is positive. It can be seeing that the geometry has a negative influence, this having, in part, the same explanation as previous influence. In completion we can add that with the increasing of the λ - angle the total length of the cutting edge is increasing thus the pushing force is distributed on a greater length. Thus the specific force is decreasing and the depth of cut is smaller. Comparing with a normal file the removal rate has an increasing rate of 70 - 100%, this being explain by the sharpening condition of the cutting edge (9μm), and the quality of the material which is use to the construction of the insert.
REFERENCES
[1] T.M Stepien; L.M Sweet, M.C. Good, “Control of Tool/Workpiece Contact Force with Application to Robotic Deburring”, Proc. 1985 IEEE
International Conference on Robotics and Automation, IEEE, St. Louis,
USA 1985.
[2] B Snaith, S. Hayward, A Draper., “Variation of Surface Topography Produced Via a Deburring Process”, Int. Journal Mach. Tools Manuf., vol. 35, No. 2, p.353-356, 1995.
[3] V. Belous, C. Dumitras, Pila multifunctionala cu ascutire continua
(Multifunctional file with continuously resharpened inserts), Patent no. 96
- OSIM 01512/ 1996, Bucuresti, Romania.
[4] C Dumitraş. S Markos,. “New Concepts in File's Design and Manufacturing Technology”, International DAAAM Szmposyum,
Dubrovnik, Croatia, 23-25 Oct., 2001, p.75-76, ISBN 3-901509-04-6.
[5] W.G. Cochran, M.C. Gertude, Experimentals Design, J. Wiley & Sons, New York, USA,1963.
[6] C Dumitraş., “Surface Quality Modelling in Micro-Cutting with Multi-Inserts Cutter”, International Carpathian Control Conference
ICCC 2006, Roznov, Czech Republic, May 29-31, 2006, p.125-129,
ISBN 80-248-1066-2.
[7] C. Dumitras, “Modeling of the Deburring Process”, Applied Mechanics
and Materials, Vols. 5-6, Trans Tech Publications, Switzerland, 2006,