Rank-sum Test Based on Order Restricted
Randomized Design
Omer Ozturk and Yiping Sun
∗Abstract— One of the main principles in a design of experiment is to use blocking factors whenever it is possible. On the other hand, if the blocking infor-mation is not precisely defined and subjective in na-ture, it is usually discarded. This paper introduces a new design that utilizes available subjective informa-tion on experimental units to create artificial blocking factors and develops a rank-sum test to test the dif-ference between two population medians.
Keywords: Order restricted randomized design, rank-ing error , Wilcoxon test, ranked set samplrank-ing, Pittman efficiency.
1
Introduction
In many experimental settings, experimental units (EU) based on inherent variation may provide two types of in-formation, formal measurements or informal and subjec-tive observations. While the formal measurements are successfully used in traditional analysis as covariates, in-formal observations are usually ignored. A new design , order restricted randomized design (ORRD), exploits the use of this informal and subjective information to design an experiment. Sets of experimental units, each of size
H are recruited from a potential population along with subjective information that they may have. This sub-jective information is used to judgement rank the EUs from smallest to largest in each set to create artificial co-variates. Ranking process induces a positive correlation among within-set experimental units. The ORRD then uses a restricted randomization of the treatment regimes to the ordered units in each set to facilitate negative cor-relation between the responses coming from two different treatment group in the same set. This negative correla-tion acts as a variance reduccorrela-tion technique in the estima-tion of the contrast parameter.
Section 2 describes the ORR designs for a two-treatment setting. Section 3 introduces a rank-sum test based on ORR design to draw inference for the equality of the
pop-∗Omer Ozturk is Professor, Department of Statistics, The Ohio
State University, Columbus OH 43210,. Email: [email protected], Tel/Fax: 614-292-3346/2096 . Yiping Sun, Senior Statistician, For-est Research Institute, Harborside Financial Center Plaza V, Jersey City, NJ 07311, Email:[email protected]. This work is partially supported by NSA Grand MSPF-04G-10 and NSF grand DMS 06-05041.
ulation medians. The Pittman efficacy of the test is com-puted and compared with its competitors. Section 4 de-velops asymptotic null distribution of the test statistics under a consistent judgment ranking scheme and pro-vides empirical evidence that the new test outperforms Mann-Whitney-Wilcoxon rank-sum test based on simple random sampling design.
2
The order restricted randomized
de-signs
We assume that the EUs enter study either sequentially orH at a time. In either case, we need to haveH units to form a set. One replication of the basic ORR design requires two sets, each of sizeH and can be constructed in a three step procedure.
Step I.We first identify the design parametersH,αand
β, whereH is the set size,αand β are two disjoint sets that partition the integers 1,· · ·, H.
Step II. In each of the two sets, we pre-experimentally judgment rank the EUs from smallest to largest based on available subjective information on within-set EUs, and obtain the ranksR1,· · ·, RH.
Step III.In one of the sets, we perform a randomization to assign the treatment levelT1 to EUs whose ranks are
in theα-set and the treatment levelT2to the EUs whose
ranks are in theβ-set. We perform an opposite allocation in the other set without a randomization so that each treatment level is applied to all the ranksR1,· · ·, RH.
This basic design is repeatedntimes to increase the sam-ple size. We useX[h]j and Y[h]j to denote the response
measurements from theh-th ranked unit,j-th repetition, and the treatments T1 andT2, respectively. We assume
that response measurements can be modeled as follows
X[h]j=μ1+γ[h]j, h= 1,· · ·, H, j= 1,· · ·, n,
Y[h]j =μ2+γ[h]j, h= 1,· · ·, H, j= 1,· · ·, n, (1)
whereμ1,μ2are the medians of the treatment groupsT1,
T2, respectively, andγ[h]j is the random error associated
with the experimental unit in replicatej and judgment rankh.
example. Assume that we wish to conduct an experiment to compare the efficacy of two drugs, drug T1 and drug
T2. We set H = 3 and α = {2} and β = {1,3}. For
just one repetition of the basic design we need two sets, each of which has three patients. We rank the patients in each set separately based on general quality of health measure, pre-medical history, etc. In one of the set, we randomly assignT1to a patient whose rank is 2 (inα-set)
andT2to patients whose ranks are 1 and 3 ( in setβ). In
the second set, we do the opposite allocation so thatT1
andT2are applied to patients whose ranks are 1, 3, and
2, respectively. It is clear from this example that each treatment group is applied to all the ranks. Thus, it is a balanced design. The basic ORR design for this example is illustrated in Table 1.
Table 1: Basic ORR design whenH = 3,α={2}, and
β={1,3}.
Set 1 β1,T2,Y[β1]1 α1, T1,X[α1]1 β2,T2,Y[β2]1
Set 2 β1,T1,X[β1]1 α2,T2,Y[α1]1 β2,T1,X[β2]1
The main features of this design can be summarized as follows:
• In each treatment group, there are n observations that has judgment rankh for h= 1,· · ·, H. Thus, each rank is equally represented within each treat-ment group. This property is useful to have an un-biased estimator for the treatment mean.
• Within set measurements, due to judgment ranking of experimental units, are not independent. Under some mild assumptions (for example under the ad-ditive model (1)), they are positively correlated.
• This design puts emphasis on the contrast parameter Δ =μ1−μ2. Within-set judgment ranking process
creates an error structure with positive covariances between within set responses. The restricted ran-domization turns this positive covariances into nega-tive one in the estimation of the contrast parameter Δ.
• This design is unique for H = 2. The number of designs increases with set size H. In this case, an efficient design can be found by selecting optimal design parameters αandβ.
The previous works in ORR design demonstrated that use of subjective information along with restricted random-ization yields highly efficient inference for control versus treatment comparison [1] and two-sample inference [2]. Close inspection of ORRD shows that judgment rank-ing process creates a kind of stratified sample. In this regard, each judgement class can be considered as a stra-tum. Borrowing the idea of post-stratification from the
theory of sampling survey, judgment ranking can be done post-experimentally. This judgment post stratified ORR design also yields inference with high efficiency [3]. Two-sample inference based on ORR design is also considered in the context of median confidence intervals [4]. The de-tailed development of the theory in this paper is provided in a PhD dissertation at the Ohio State University. The proofs of the theorems can be found in [5].
3
Rank-sum Test
Let F(x) and G(y−Δ) be the cumulative distribution function of the treatment populationsT1andT2,
respec-tively. The parameter Δ = μ2−μ1 denotes the
loca-tion shift between these two distribuloca-tions, whereμ1and
μ2 are the medians of F and G. Let X[h]j and Y[h]j,
h = 1,· · ·, H, j = 1,· · ·, n be the samples from treat-ment populations T1 and T2 generated by ORR design
in Section 2 . LetF[h] and G[h] be the cdf of the
judg-ment order statisticsX[h]jandY[h]j, respectively. In this
notation, square brackets indicate the quality of ranking information. If there is no ranking error, we replace the square brackets with the round one and judgment ranked order statistics then become usual order statistics from a set of sizeH.
We now wish to develop a nonparametric test for the hypothesis
H0: Δ = 0 HA: Δ= 0.
Even though we use two-sided alternatives here test can be applied to one sided alternatives with minor modifica-tion. Let
T =
H
i=1
n
j=1
H
k=1
n
t=1
I(X[i]j ≤Y[k]t). (2)
We reject the null hypothesis for extreme values of T. For an arbitrary judgment ranking scheme, the exact null distribution ofT is not possible. We then look at the null distribution ofT asngoes to infinity.
Theorem 1 Let T¯ = T /(n2H2). For an arbitrary, but consistent ranking scheme,ET¯= 1/2.
Theorem 2 Under a consistent ranking scheme, as
n goes to infinity, the asymptotic null distribution of
√
2nH( ¯T−1/2) converges to a normal distribution with mean zero and variance σ2=H2(σ21+σ22), where
σ21 = V ar
u
i=1
(1−F(X[αi]1)−τ¯αi·)
+
H−u
k=1
(F(Y[βk]1)−τ¯·βk)
σ22 = V ar
H−u
i=1
(1−F(X[βi]1)−τ¯βi·)
+
u
k=1
(F(Y[αk]1)−τ¯·αk)
,
τik = EI(X[i]j ≤ Y[k]t), τ¯.k = Hi=1τik/H, τ¯i. =
H
k=1τik/H, and uis the number of elements in set α.
The results of Theorem 2 hold for an arbitrary ranking scheme as long as it is consistent in each set. The consis-tency here is used to denote that the same ranking mech-anism is used in each set. We note that the asymptotic null distribution of ¯T is not distribution free. It depends on the judgment ranking scheme. Under perfect ranking, considerable simplification is possible in Theorem 2.
Corollary 3 Under perfect ranking , the asymptotic null distribution of √2nH( ¯T −1/2) converges to a normal distribution with mean zero and varianceσ2P, where
σ2p = 4
H
u
i=1
αi(H+ 1−αi)
(H+ 1)2(H+ 2)
+2
u
i=1
u
j=1
I(αi < αj)(αi(H+ 1−αj)
H+ 1)2(H+ 2)
+
H−u
k=1
βk(H+ 1−βk)
(H+ 1)2(H+ 2)
+2
H−u
k=1
H−u
t=1
I(βk < βt) βk(H+ 1−βt)
(H+ 1)2(H+ 2)
−2
u
i=1
H−u
k=1
I(αi< βk)(αi(H+ 1−βk)
H+ 1)2(H+ 2)
−2
u
i=1
H−u
k=1
I(βk< αi)(βk(H+ 1−αi)
H+ 1)2(H+ 2)
.
It is now clear that the asymptotic null distribution of ¯T
is distribution free under perfect ranking.
WhenH > 2 the number of designs that we can select for ORRD is not unique. In this case, we select a design so that the Pittman efficiency of the test is larger than any other design in its class. LetGΔn(t) =F(t−ΔN),
where Δn =a/√n, a >0. Under this local alternative, the Pittman efficacy of the test based on the design pa-rametersαandβ is given by
c2(α, β) = μ(0)
σP2 , μ
(0) = d
dΔEΔT¯|Δ=0.
For a generalαandβ, the Pittman efficacy of the ORR design is then given by
c2(α, β) =(
f2(y)dy)2
σP2 .
In order to find the optimal design, we need to maxi-mize this equation with respect to setsαandβ. This is equivalent to minimizing the asymptotic null variance of
¯
T.
Theorem 4 Let H > 2 be any fixed integer. Then the Pittman efficacy of the test T¯ is maximized when set α contains odd integers only and setβ contains even inte-gers only, or vice versa.
The theorem 4 indicates that the optimal design is the one that distributes integers to setαandβ as evenly as possible. This can be achieved by putting odd integers in setαand even integers in setβ.
The asymptotic variance of the test statistics ¯T reduces to a simple form for the optimal design.
Corollary 5 Assume that setαandβ contains odd and even integers. Under perfect ranking assumption, the asymptotic null variance of T¯ based on optimal design, σOpt2 reduces to
σ2Opt=
1
(H+1)2 if H is even 1
H(H+2) ifH is odd.
The Pittman efficacy of the Mann-Whitney-Wilcoxon (MWW) test based on simple random sampling can be found in [6]. For equal sample sizes, it reduces to
c2(M W W) = 3{ f2(x)dx}2.
We now compare the asymptotic Pittman relative effi-ciency of the rank-sum test based on optimal ORRD with respect to MWW test based on simple random sample
ef f(Opt, M W W) = c
2(Opt)
c2(M W W)= 1 3σ2opt.
For H = 2,3, and 4, relative efficiencies are 3,5, and 25/3, respectively.
The point and interval estimate of the shift parameter Δ can be constructed from pairwise differences of X- and
Y-sample observations,
ˆ
Δ =median{Y[k]t−X[i]j}.
The estimator has the same form of HodgLehman es-timator as in a simple random sample. On the other, its distributional properties are different due to within-set correlation structure.
note that the null distribution ofT is symmetric around (nH)2/2. LetD(1)≤ · · · ≤D(n2H2)be the ordered
differ-ences ofY[k]t−X[i]j, fork, i= 1,· · ·, Handt, j= 1,· · ·, n.
If we select a k∗ such that P0(T ≤k∗) =η/2, from the
symmetry ofT we have that
[D(k∗+1), D(n2H2−k∗)]
is an 100(1−η)% confidence interval for Δ. For largen,
k∗ can be approximated form the asymptotic null distri-bution ofT,
k∗= (nH)2/2−0.5−zη/2σT,
where σ2T = (nH)3σP2/2 is an estimate of the variance of T and za is the a-th upper quantile of the standard
normal distribution.
In order to investigate the convergence rate of the asymp-totic distribution of ¯T we performed a simulation study. Simulation setting consists of different set (H), repli-cation (n) sizes, varying degree of ranking information, and some common underlying distribution (F). Judgment ranking information is modeled through Dell and Clutter [7] model. This model uses an additive perceptual error model
ui=γi+wi,
where the residualγi assumed to have a distribution F
with mean zero and variance 1. The random components
wi is generated from a normal distribution with mean
zero and variance θ2, and γi and wi are independent.
[image:4.595.297.539.325.535.2]In order to generate judgment order statistics from this model, we generate two sets of random variateγandw, each of sizeH. We add these vectors to obtainu=γ+w. This vector is sorted and correspondingγvalues are taken as judgment order statistics. In this model, the quality of judgment ranking information is controlled by the cor-relation coefficientρ=corr(u, γ). The correlationρ= 1 and ρ = 0 correspond to perfect and random ranking, respectively. Intermediate value of judgment ranking in-formation can be considered by selecting 0< ρ <1.
Table 2: Estimated Type I error rates whenn = 5 and underlying distribution is standard normal.
H ρ= 1 ρ= 0.9 ρ= 0.75 ρ= 0.5
2 0.042 0.112 0.178 0.240
3 0.038 0.161 0.259 0.339
4 0.043 0.242 0.371 0.469
5 0.044 0.283 0.447 0.523
Table 2 presents the estimated Type I error rates for dif-ferent values ofρ. It is clear that simulated type I error rates are close to nominal Type I error rate of 0.05 if there is no ranking error. On the other hand even a small rank-ing error inflates the Type I error rates considerably.
4
Asymptotic Null Distribution under
Imperfect Ranking
Simulation study in Section 3 indicates that even a slight departure from perfect ranking inflates the Type I er-ror rates. Hence, test looses its distribution free prop-erty. Under imperfect ranking, the quantity σP2 under estimates the variance of the test statistics. In order to correct this problem, It is important to have a con-sistent estimator for σ2. Let Zi, i = 1,· · ·,2n be the
H-dimentional within set correlated observations in each replication
Zi= (X[α1]i,· · ·, X[αu]i, Y[β1]i,· · ·, X[βH−u]i).
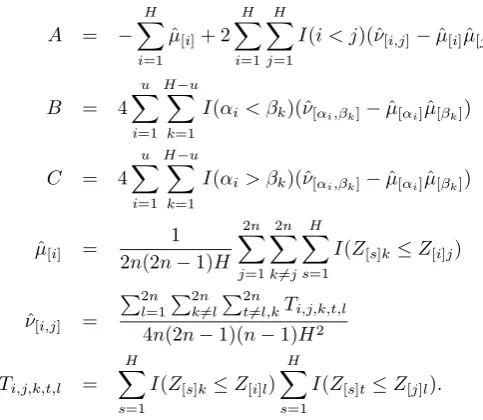
Theorem 6 For a fixed set size H, under a consistent ranking scheme, unbiased and consistent estimator ofσ2 is given byσˆ2= H4(H/3 +A−B−C), where
A = −
H
i=1
ˆ
μ[i]+ 2
H
i=1
H
j=1
I(i < j)(ˆν[i,j]−μˆ[i]μˆ[j]),
B = 4
u
i=1
H−u
k=1
I(αi < βk)(ˆν[αi,βk]−μˆ[αi]μˆ[βk])
C = 4
u
i=1
H−u
k=1
I(αi > βk)(ˆν[αi,βk]−μˆ[αi]μˆ[βk])
ˆ
μ[i] = 2 1
n(2n−1)H
2n
j=1 2n
k=j H
s=1
I(Z[s]k ≤Z[i]j)
ˆ
ν[i,j] =
2n
l=1
2n
k=l
2n
t=l,kTi,j,k,t,l
4n(2n−1)(n−1)H2 Ti,j,k,t,l =
H
s=1
I(Z[s]k ≤Z[i]l) H
s=1
I(Z[s]t≤Z[j]l).
By using the consistent estimator of σ2 we can easily establish from the Slutsky’s theorem that √2nH( ¯T −
1/2)/ˆσconverges to a standard normal distribution as the repetition numbern goes to infinity. Even though, this result holds for largen, it may not provide a satisfactory solution for small n. Since we estimate σ2 consistently from the data, Student’s t-distribution with 2n−2 de-grees of freedom provides better approximation for small
[image:4.595.71.255.641.703.2]n.
Table 3 presents the Type I error rate estimates based on Student’s t-approximation under different judgment quality information. Underlying distributions are taken as standard normal (N), Student’st-distribution with 3-degrees of freedom (t3) and lognormal distribution (LN).
Table 3: Estimated Type I error rates based on Student’s
t- approximation. Simulation size is 5,000 andn= 5. Dist H ρ= 1 ρ= 0.9 ρ= 0.75 ρ= 0.5
N 2 0.041 0.051 0.053 0.053
3 0.053 0.062 0.058 0.060
4 0.045 0.059 0.056 0.055
t3 2 0.040 0.056 0.056 0.059
3 0.050 0.061 0.058 0.059
4 0.039 0.061 0.056 0.054
5 0.049 0.053 0.058 0.055
LN 2 0.038 0.056 0.058 0.057
3 0.051 0.064 0.063 0.064
4 0.040 0.049 0.051 0.052
5 0.040 0.051 0.056 0.049
proposed test is asymptotically distribution free irrespec-tive of the quality of judgment ranking information.
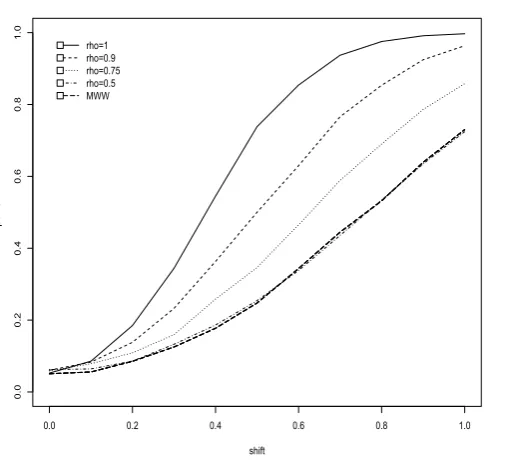
We next investigate the empirical power of the test. Sim-ulation study considered set size H = 3, the number of replicationn = 5 and varying degree of judgment rank-ing information. Residual for the ORRD are again gen-erated from Dell and Clutter model forρ = 1,0.9,0.75,
and 0.50. For the alternative hypothesis we considered location shift of Δ = 0(0.1)1. The empirical powers of the rank-sum test of ORRD along with classical Mann-Whitney-Wilcoxon test is given in Figure 1.
0.0 0.2 0.4 0.6 0.8 1.0
0.0
0.2
0.4
0.6
0.8
1.0
shift
power
rho=1 rho=0.9 rho=0.75 rho=0.5 MWW
[image:5.595.55.502.415.742.2]Figure 1: Empirical power curves of the rank-sum test based on ORRD for selected ρ(rho). Set size H = 3, replication sizen= 5 and simulation size is 5,000.
Figure 1 illustrates that the new test has substantially higher power than the the power of the Mann-Whitney-Wilcoxon test as long as there is some information to judgment rank the units prior to experimentation. If judgment ranking information is week, the correlation coefficient is less than 0.5, the ORR design is as good as simple random sampling design. This indicates that the proposed test does not loose its power if our ranking information leads to a random ranking.
5
Conclusion
This papers develops distribution-free inference based on ORR design for the location shift between two distribu-tions. New design exploits the use of subjective infor-mation to rank the experimental units to produce more accurate inference for the contrast parameter. The ap-proach that we have taken in this paper extends to more complex treatment structure withk-treatments. A test, similar to Kruskal-Wallis test, can be constructed. In this case, interesting design issues appear. In current work, the authors are pursuing the extension of ORR design to thisk-treatment structure.
References
[1] Ozturk, O. and MacEachern, S. N. Order restricted randomized design for control versus treatment com-parison. Annals of the Institute of Mathematical Statistics, 56, 701-720, 2004.
[2] Ozturk, O. and MacEachern, S. N. Order restricted randomized designs and two-sample inference, Jour-nal of Environmental and Ecological Statistics,14, 365-381, 2007.
[3] Du. J. and MacEachern, S. N. Judgment post-stratification for deigned experiment. Biometrics, 64, 345-354, 2008.
[4] Two sample median test for order restricted random-ized designs. Statistics and Probability Letters, 17, 131-141, 2007.
[5] Rank-sum test for two-sample location problem un-der orun-der restricted randomized design. The PhD dissertation, Department of Statistics, The Ohio State University, 2007.
[6] , Hettmansperger, T. P. Statistical Inference Based on Ranks, Reprint Edition, Krieger Publishing Com-pany, 1991.
[7] , Dell, T. R., and Clutter, J. L. Ranked-set sampling theory with order statistics background.Biometrics,
[image:5.595.43.297.502.734.2]