ECHOCARDIOGRAPHY
A thesis
presented for the degree of
Doctor of Philosophy in Electrical Engineering in the
University of Canterbury, Christchurch, New Zealand
by
W.H. ROUND B.Sc.(Tech.),M.Sc.
10 ~~'.i: , S . US
wrote that the motion of the heart was perplexing as the flux and reflux of Euripus was to
Aristotle ... 1 found i t so truly difficult that I almost believed with Fracastorius that the motion of the heart was to be understood by God alone."
William Harvey, M.D.
First, I would like to thank my wife Glenys for supporting me over the last three years, especially over the last three months.
I would also sincerely like to thank my supervisor, Professor Richard Bates, for his advice, encouragement and interest. I know that I am a far better scientist and engineer from the experience of working under his guidance.
My associate supervisor, Dr Hamid Ikram must also be thanked for his advice on the medical aspects of the research presented in this thesis. I also thank him for his perpetual enthusiasm and encouragement.
Dr Philip Bones, who often acted as an 'unofficial supervisor', was always willing to offer advice on the technical aspects .of my work. I thank him for this.
I also thank the staff of the Princess Margaret Hospital for providing me with a pleasant environment in which to work. Special thanks must go to the
echocardiographer at PMH, Christine Wilson, for always being willing to scan subjects for my studies. I thank her for her hard work and dedication.
Several of the staff and students at the University of Canterbury also contributed ideas and advice. In particular, I wish to thank Robin Williams, Dr Fred Cady, Bill Kennedy, Brent Robinson, Robert Minard and the technicians
in the Electrical Engineering Departments' workshops.
The National Heart Foundation have generously supported my work financially over the past three years. I thank them for this.
QUANTITATIVE TWO-DIMENSIONAL ECHOCARDIOGRAHY BY W. H. ROUND
Page Page Page Page Page Page Page
4, para 2, line 2 'available'
4, Table 1.2 5, para 1, line 5 19, Fig 1.2
'mammilian'
6, para 1, line 2 'acqueous'
8,
para2,
line7
'longer'
9, para 2, line 2 'or'
Page 18, para 3, line 9 'is'
Page 31, para 3, line 6 'hand-copy'
Page 32, para 5, line 2 'M-mode'
Page 47, para 2, line 3 'defector'
Page 51, para 3, line 13 'pizels'
Page 63, para 5, line 10 'systol'
Page 65, para 2, line 15 'end-diastolic'
Page 73, para 2, line 7 'distance along'
Page 90, para 3, line 6
should be
should be
should be
should be
should be
should be
should be
should be
should be
should be
should be
should be
should be
low pass filtering' or smoothing' should be 'low pass filtering' or 'smoothing'
Page 98, para 2, line 3
'Robison' should be
'able' 'mammalian' 'aqueous' 'larger' 'of' 'are' 'hard-copy' 'C-mode' 'detector' 'pixels' 'systole' 'end-systolic'
'distance
t
along'ABSTRACT PREFACE
CHAPTER 1. 1.1 1.2 1.3 1.4 1.5
CHAPTER 2. 2. 1
2.2 2.3 2.4
CHAPTER 3. 3.1 3.2 3.3 3.4
CHAPTER 4. 4.1 4.2 4.3
4.4
CHAPTER 5. 5.1 5.2 5.3 5.4 5.5
THE INTERACTION OF ULTRASOUND WITH TISSUES Introduction
Propagation of sound waves in fluid media Acoustic velocity in tissues
The scattering of sound by tissues
Attenuation of ultrasonic waves by tissues
MEDICAL ULTRASONIC IMAGING Introduction
The echo location principle
The generalised pulse-echo imaging system Ultrasonic transmission imaging
PROPERTIES OF THE HEART Introduction
The heart
Measurement of ventricular wall motion Quantitative ventricular shape description
ECHOCARDIOGRAPHY AND IMAGE PROCESSING Introduction
Echocardiography
Image processing in cardiology Segmentation of cardiac images
ACQUIRING AND PROCESS ING ECHOCARDIOGRAl:-'1S Introduction
A system for acquiring two-dimensional echocardiograms Processing echocardiographic images
6.1 6.2
6.3
6.4
6.5
CHA.PTER 7. 7.1
7.2
7.3
REFERENCES APPENDICES
Introduction
A Fourier series description of left ventricular shape Regional wall motion studies
Application of Fourier shape descriptors Discussion
CONCLUSIONS AND SUGGESTIONS FOR FUTURE WORK Data collection
Wall motion and shape Wall motion versus shape
137 137 144 160 181
189 190 192 193
- ABSTRACT
This thesis reports studies of the motion and shape of the walls of the heart using data extracted from two-dimensional echocardiograms.
The relevant literature and clinical practice are first reviewed at length.
The development of hardware and software systems for digitally recording two~dimensional echocardiograms (scans) is described. Computer
techniques for enhancing scans of the left ventricle of the heart are presented. Methods of interactively extracting the endocardial outlines seen in the scans are described.
The outlines of the left ventricular walls were extracted from the
scans of two groups of subjects. One group consisted of nine normal volunteers, the other consisted of nine coronary artery disease (CAD) patients known to have abnormal left ventricles. The outlines obtained were used to study methods of analysing left ventricular wall motion and shape under exercise and drug
interventions. Two cardiac drugs were used: nifedipine and metoprolol.
Hall motion was measured in terms of the change in distance of the walls from the ventricular centroid. CAD patients with apical infarctions were found to have hyperkinetic regions of the walls adjacent to their
infarctions. The hyperkinesia decreased when the patients were subjected to isometric exercise. Under the influence of nifedipine the hyperkinesia increased. However under the influence of metoprolol it decreased. These observations are consistent with the kno~vn effects of exercise and the drugs on the motion of the heart.
Ventricular shape was described using a trigonometric Fourier series. Descriptors derived from the coefficients of the series were developed. The values of some of the descriptors of the CAD patients with apical infarctions were found to be larger than those of the normal volunteers. Under exercise
PREFACE
In 1978 I was employed as a physicist in the Departments of
Radiotherapy and Nuclear Medicine at Waikato Hospital in Hamilton, New Zealand. I was fascinated with the relatively new (to New Zealand) field of medical ultrasonic imaging but my chances of venturing further into this at Waikato Hospital were somewhat limited. ~~ile passing through Christchurch in October of that year, I took the opportunity to visit Professor R.H.T. Bates at the Electrical Engineering Department at the University of Canterbury. Professor Bates and some of his colleagues had been experimenting with
ultrasonic computed tomography and speckle imaging techniques. I was impressed with what I saw and told Professor Bates that I was interested in dOing a
Ph.D. in 'something to do with medical ultrasonics'. At later meetings with Dr. Philip Bones and Dr. Hamid Ikram at the Princess Margaret Hospital a proposal was put forward that we should apply for a grant from the National Heart Foundation of New Zealand to finance a suitable project.
Eventually funding to undertake a study of left ventricular wall motion was granted by the National Heart Foundation. It was proposed to interface an SKI echo cardiographic sector scanner to the Cardiology and Respiratory Departments' PDP 11/10 computer. This would allow images from the scanner to be processed by the computer to help extract the desired wall motion
data thus enabling ventricular wall motion to be quantified. It was recognised at this stage that the 'stop-frame' sector scan images produced by the SKI
were of poor quality and, in general, the inner wall of the ventricle (the endocardium) could not be identified. Therefore image processing techniques would have to be employed to improve the image quality.
A sector scanner-to-computer interface was eventually constructed. Scans of several volunteers were recorded and were used to help develop appropriate image' processing techniques.
shape were developed. It was shown that it may be possible to classify patients as having normal or abnormal ventricles by quantitatively assessing wall motion md shape using the data from their sector scans.
The first four chapters of this thesis review the research literature and describe the clinical techniques relevant to the original work presented in the final three chapters.
In Chapter 1, the interaction of ultrasound with human tissues is reviewed. This provides those readers who are unfamiliar with medical ultrasonic imaging with the necessary physical and biological background. The equations used to describe the propagation of sound through tissues are presented. The basic acoustic parameters, such as velocity and attenuation, related to sound travelling through tissue are discussed. Also the mechanisms by which ultrasound is absorbed and scattered by tissues are considered.
Chapter 2 discusses the instrumentation side of medical ultrasonic imaging. Emphasis is placed on pUlse-echo techniques rather than on the transmission techniques which are less popular.
A brief description of cardiac anatomy is presented at the start of Chapter 3. The qualitative and quantitative methods used to analyse
ventricular wall motion and shape in cineangiography and echocardiography are described. Angiographic methods are discussed in detail because angiography in the past has been the 'gold standard' technique for analysing wall motion. The literature contains many more accounts of the quantification of wall motion and shape by this technique than by echocardiography.
Image processing techniques are now widely employed in commercial ultrasonic scanning equipment to improve image quality. These techniques are reviewed in Chapter 4. Estimation of the position of the ventricular walls in angiograms and echocardiograms by semi- and fully-automatic
computational procedures are also revie~ed.
Chapter 5 describes the construction of the scanner-to-computer
interface which was developed as part of the research reported in this thesis. The images it presents to the computer are generally of poor quality.
Therefore image processing was employed to improve their visual appearance and to make the endocardial outline more obvious to an observer. The methods used to do this are described in detail. A technique called 'simultaneous
a result a new mode of scanning,' R-mode' scanning, was introduced. A computer program developed to extract the endocardial border in a series of scans is described in this chapter.
The above-mentioned techniques were employed to obtain the data for the experiments described in Chapter 6. In these experiments the regional heart wall motion of normal volunteers and coronary artery disease patients was studied. Wall motion was measured in terms of the percentage decrease in the distance of the walls from the ventricular centroid. The effects of various exercise and drug interventions on wall motion were also studied. The results of these experiments are detailed and shown to
correlate with the known effects of these drugs on wall motion. A method of describing ventricular shape in terms of trigonometrical Fourier series
is described. It was found that changes in the coefficients of the series due to the effects of the interventions can be related to expected changes in the ventricular shapes.
Conclusions are presented in Chapter 7 which also contains suggestions on how this research may be developed further.
While the research described in this thesis was being carried out, the following papers and presentations were
prepared:-1) W.H. Round and R.H.T. Bates
'Ultrasonic spectrum modification by subwavelength scatterers' Presented at 20th Conference on Physical Sciences and Engineering
in Medicine and Biology, Christchurch, New Zealand. 25-29 August 1980.
2) W.H. Round, P.J. Bones, H. Ikram and R.H.T. Bates 'Digitising and processing echocardiographic images'
Presented at 21st Conference on Physical Sciences and Engineering in Hedicine and Biology, Helbourne, Australia. 17-21 August 1981. Also published in 'Australasian Physical and Engineering Sciences in Medicine, 1982, 5, 113-121.
The following papers are also to be submitted.
1) N.H. ~ound, P.J. Bones, R.H.T. Bates, H. Ikram
'The simultaneous scanning technique : an aid for endocardial detection in sector scans' To be submitted to The Journal of Cardiovascular Ultrasound.
2) H . H. Round and R. B. v-Jilliams
3) W.R. Round~ P.J. Bones, R. Ikram, R.R.T. Bates
'Echocardiographic studies of left ventricular wall motion'. To be submitted to The Journal of Cardiovascular Ultrasound.
CHAPTER 1
THE INTERACTION OF ULTRASOUND WITH TISSUES
1.1 INTRODUCTION
In this chapter, the interaction of ultrasound with soft tissues is discussed. This will provide those unfamiliar with medical ultrasonic imaging with an appreciation of the relevant acoustical and biological
background. It will also provide an insight into the difficulties encountered when obtaining data to image tissues using ultrasonic methods.
While the physics of ultrasound traversing homogeneous; low-loss media is well understood (cf. Wells, 1977, Chap. 1), it is difficult to obtain a satisfactory description of the propagation of an ultrasonic wave through biological tissues. Tissues exhibit spatial variations in density, refractive index and attenuation. The effects of these variations on
ultrasonic waves have been analysed theoretically using simple tissue models (cf. Twersky, 1962a, 1962b; 1964; Atkinson and Berry, 1974).
In §1.2 the propagation of ultrasound in homogeneous media is discussed. The various acoustic parameters relevant to ultrasonic imaging are introduced. One of these, acoustic velocity, is treated in greater depth in §1.3. The range of values of this parameter for various biological tissues is presented. The scattering of sound by inhomogeneous media is considered in §1.4. Scattering is considered in detail for three tissues: blood, heart muscle and liver. Blood is a highly disordered tissue while liver is highly structured. Heart muscle represents the intermediate case and shows some degree of disorder in its structure. Finally, in §1.5, the absorption of ultrasound by tissues is described in terms of several of the mechanisms by which it may occur.
1.2 PROPAGATION OF SOUND WAVES IN FLUID MEDIA
=
- - - - 'V'V.$ - G'VX'VX$ (1.1 )where 1jJ is the instantaneous displacement of a particle of the medium from its equilibrium position
K is the adiabatic modulus of compressibility of the medium G is the modulus of shear rigidity of the medium
Po is the mean density of the medium
The assumption is made that the medium is unable to support shear waves.
Hence only longitudinal waves can propagate in the medium. This is in accord with experience with soft tissues (Wells, 1977).
rigidity to zero (1.1) reduces to
Setting the modulus of shear
(1. 2)
This equation is an approximation of the more general hydrodynamic equations. It is valid under the conditions that the maximum particle velocity amplitude is small compared to the velocity of sound in the medium and that the
adiabatic compressibility is not significantly dependent on pressure over the range of pressure variations occurin~ in the sound field. Under these
conditions, the sound propagation velocity for longitudinal waves is
c =
(1. 3)
where
lji(x,t) = A ei(wt - kx)
A is the amplitude of the wave
w is the angular frequency of the wave k is the wave number w/c
The characteristic impedance Z of the medium is defined as o
Z
=
p co 0
IKP
o(1. 4)
(1. 5)
This important parameter is discussed in §1.4. at a point in the field can be defined as
The acoustic pressure p
(1. 6)
where Pi is the instantaneous pressure at that point and Po is the equilibrium pressure in the medium.
displacement are related by
p -p c -2 8lji o
ox
The acoustic pressure and the particle
(1. 7)
The intensity I of the acoustic wave is defined as the time average of the rate of transport of energy through unit area normal to the direction of propagation. It is given by
I
=
Pocvmax2 (1. 8)
where v max is the maximum velocity of a particle under the influence of the wave.
Medical ultrasonic imaging equipments use sound with a frequency in the range 1-10 HHz. The sound waves which they transmit have an intensity of approximately 10-2W/cm2. The propagation of ultrasound in water in this frequency range is similar to that in soft tissues. It is therefore
These are presented in Table 1.1 for 1 MHz sound waves.
Table 1.1 Field pa~ameters for plane acoustic waves in ,vater at 1 MHz
Parameter Magnitude
Peak particle displacement 1.8 x 10⁻⁹
Peak particle velocity 12
Peak particle acceleration 7 x 10⁴
Peak particle pressure l.8x 104
Wavelength 1.5 x 10⁻³
Wave velocity 1.5 x 10³
Density 1 x 10³
Characteristic impedance 1. 5 x 10 6
1.3 ACOUSTIC VELOCITY IN TISSUES
Units m m/sec m/sec 2 Nm- 2
m m/sec kgm -3 kgm -2
Most medical ultrasonic imaging systems require accurate estimates of the velocity of sound in various tissues to be available to produce
undistorted images. Parry and Chivers (1979) collate the results of many 1
researchers who have measured acoustic velocity in various tissue types.
Estimates of acoustic velocity for selected tissues are presented in Table 1.2.
Table 1.2 The velocity of ultrasound in mammilian tissues (from Parry and Chivers, 1979)
Tissue Velocity (m/ sec)
I
Blood (normal) 1550 - 1570
Fat (normal) 1440 - 1582
Liver (normal) 1553 - 1599
(abnormal) 1570 - 1607
Kidney (normal) 1558 - 1572
Spleen (normal) 1515 - 1595
Lung (normal) 650 - 1180
(abnormal) 340
Connective tissue (normal) 1545
Huscle (normal) 1545 - 1631
Nervous tissue (normal) 1506 - 1644
(abnormal) 1500 - 1569
Bone (normal) 2870 - 4060
(abnormal) 2442 - 3371
Breast (normal) 1450 - 1570
The velocity estimates reported in the literature for each tissue type tend to vary over an appreciable range of values (cf. Wells, 1977; Parry and Chivers, 1979). This variation has several sources, some being normal biological variation between tissue samples. In addition, not all of the values reported are for human tissues, although all are mammilian. It appears that there may be little difference from species to species (cf. Parry and Chivers, 1979). Several different techniques are used to measure ultrasonic velocity (cf. Andreae and Edmonds, 1961; Pellam and Galt, 1946; Greenspan and Tscheigg, 1957). Hhile there should be no difference in the velocity estimates obtained using the various techniques, the reported values may well be functions of the instrumentation used. Some of the data reported in
the literature are for tissues '>lhich have been 'fixed I in preserving chemicals,
while others are for freshly excised or refrigerated samples. While the various preservation methods alter the acoustic velocity slightly (Bamber et al., 1979), greater variation is observed if the samples are not preserved. Presumably tissue decay over short periods of time has a greater effect than does preservation.
Velocity in tissues is known to be temperature dependent (cf. Bowen et al., 1979). Few of the estimates reported in the literature were
measured with the samples at body temperature. Rather, the range of
temperatures used by various researchers is from 190C to 430C. The velocity of ultrasound in most soft tissues increases by approximately 1 m/sec for each loC increase in tissue temperature (Bowen et al., 1979).
Soft tissues are dispersive media. The velocity dispersion is small however. It is less than 1% of the velocity in the 1-10 MHz frequency range (Wells, 1977). Since the magnitude of the dispersion is small, it is neglected in most imaging situations.
1.4 THE SCATTERING OF SOUND BY TISSUES
1.4.1 Scattering by Inhomogeneous Media
In §1.1 the propagation of sound in lossless, homogeneous media (such as the acqueous and vitreous humours of the eye) is considered. However, few tissues can be considered homogeneous and almost all tissues exhibit spatial variations in density and compressibility. ~men an acoustic wave encounters a region where one of these parameters changes, some of the energy 'of the wave is scattered (Reid, 1976). In simple situations such as large
planaror isolated subwavelength spherical scatterers, the scattering can be readily described theoretically. However the analysis is much more
complicated for tissues, since to predict the acoustic parameters of a
scattered wave, the spatial distributions of the density and compressibility of the tissues must be known. They are usually not available (Shung et al., 1976).
Scattering of ultrasound occurs at boundaries between organs and
~vithin the tissues themselves. Scattering at organ boundaries appears to be
caused by the connective tissue membranes surrounding the organs (Reid, 1976). The echoes are strong and highly angle - dependent. This indicates that the scatter takes the form of specular reflections at the surface of the organs. The sources of the small echoes seen to arise from scatterers within tissues have not, in general, been identified.
In this section, scattering of sound from objects possessing simple shapeand distributions is discussed. Scattering from three tissues (blood, heart muscle and liver) which exhibit differing degrees of order in their structure is related to the theoretical descriptions of scattering.
1.4.2 Scattering by Specular Reflectors
incident wave reflected wave
medium 1 medium 2
Figure 1.1:
transmitted wave
tion and transmission of sound at a plane boundary
At the interface some of the wave is transmitted while the rest is reflected. The angles e. and
e
of the direction of the incident and reflected waves1. r
to the normal to the plane are such that
e.
=e
1. r (1. 9)
The angle e
t describes the direction of the wave transmitted through the interface satisfies
sin(e )
(1.10)
where c
1 and are the velocities of the waves in media 1 and 2 respectively. At the interface there can be no discontinuities in either particle velocity or particle pressure. In physical terms, this means that the two media remain in contact. applying these two conditions the ratios of
(1.11) I.
l
and
(1,12)
w'here Z1 and Z2 are the characteristic impedances of media 1 and 2.
This analysis provides a satisfactory description of ultrasonic transmission and reflection at boundaries between organs (Reid, 1976; Round, 1977) . The reflectivities, I /1., of boundaries between various tissues
r l
for waves perpendicular to the interface are presented in Table 1.3. I t is seen that the reflectivities of soft tissue interfaces are in general small. Therefore little energy is lost from the incident wave by reflection.
The reflectivities of interfaces between soft tissue and bone are much longer with the reflected wave having over half the intensity of the incident wave.
Table 1.3
Water Fat Huscle
Skin Brain Liver Blood
Reflectivities of boundaries between selected tissues
Water Fat Muscle Skin Brain
0.0 0.047 0.02 0.029 0.007 0.067 0.076 0.054 0.009 0.013 0,022
1.4.3 Scattering by Small Particles
Variations in density and compressibility in tissues are recognised as occuring over distances of much less than the wavelength of 1-10 ~rnz
ultrasound (cf. Chivers, 1978; Gore and Leeman, 1977). It is informative to discuss the scattering of ultrasound by subwavelength particles.
Some tissues appear to scatter ultrasound in a manner which can be described by modelling the scatterers as small spheres or cylinders (cf. Shung and Reid, 1977; Shung et al., 1976).
The scattering of sound by a sphere with a diameter much less than a wavelength is considered by Morse and Ingard (1968). If a sphere or radius a is suspended in a frictionless (i.e. non viscous) medium, the intensity I of the scattered sound at an angle 8 to the direction of the incident
s
wave \vith wavenumber k and intensity I. is given by
1.
I
s 9
COSCSJ 2
= (1.l3)
\vhere K and K are the compressibilities of the medium and the sphere e
respectively, and p and p are the densities of the medium and the sphere e
respectively. It is not realistic to consider the medium to be non-viscous in most biological situations. The above expression has been extended by Ahuja (1972) for a sphere suspended in a medium with viscosity v :
m
~
\ 2
r
2 12I.k4a6
p - pI
K - K 3E e
I
1. e
-. -pJ
I
=
+
2JCOSCS)
(1.14)s
9 K 2
(: e
+ ,)
where
E :: 1 +3
i
+
9 (i) 2+
+
2..
(i)4a 2 a 4 a
2v k
m
d
=
( ) 2pw
l ""
1+1
(i) 2 4 a s ::.2.
(i) (l+
i)
4 a a
The above equations also to a non spherical scatterer of volume
4ITa3/3 all of whose dimensions are much less than the wavelength (cf. Reid,
1976).
Many tissues, such as muscle, are made up of networks of fibres. It is relevant therefore to consider the scattering of sound from cylindrical objects. Morse and
(1968)
derive the equation for the intensityI of a wave scattered off a cylinder of radius a much less than the wavelength s
as
I
=
s (1.15)
8r
Equations (1.13) to (1.15) show that the intensity of the wave
scattered off a sphere varies as tne fourth power of frequency and that off a cylinder as the third power.
1.4.4 Scattering by Distributions of Scatterers
~Grey scale' ultrasonic images of tissues reveal that within tissues
there exist many closely spaced scattering centres. It is reasonable therefore to model tissues as being 'clouds' of subwavelength scatterers (cf. Twersky 1962a, 1962b, 1964; Aks and Vezzetti,1980; Vezzetti and Aks, 1980)
When sound traverses a cloud of scatterers, each object produces a scattered wave. These waves reinforce in some directions and interfere in others. This gives rise to coherent, incoherent and multiple scatterings. In soft tissues, the scattering from a single scatterer is small (cf. Gore and Leeman, 1977). Therefore it is usual to neglect multiple scattering.
The wave scattered from a cloud of subwavelength objects is the sum of the waves arising from each of the objects, each having a relative phase and amplitude determined by the particular object's size and position. If the spheres are regularly placed, the phases add up in certain directions to produce
diffracted beams, as with the Bragg diffraction of X-rays from crystals. The maxima of these diffracted beams are found at angles e to the direction of the wave incident on the cloud is satisfied by
sinCe)
nA
2d
where n is an integer and d is the separation of the scatterers.
(1.16)
However, the objects scattering the sound waves are often found to be randomly
distributed. In this case little reinforcement occurs except in the direction of the incident wave.
Consider now a region R containing randomly distributed subwavelength scatterers having a concentration of N/unit volume and whose separations are also less than the wavelength of an incident plane wave of wavenumber k. Let the nth scatterer have a radius a , a compressibility K and a density
n n
P
n, the supporting medium has a compressibility Ko and a density Po' In the forward direction, coherent scattering modifies the incident wave as though it were traversing a region of constant density P
=
1 N 4 3
-
+
L: -1TaPo n=l 3 n
K o
+
N 4 3
L:
-3
1Ta(K - K )
n=l n n 0
(1.17)
(1.18)
(Morse and Ingard, 1968),
Incoherent scattering is observed due to the variation in density and compressibility of the scatterers about the average values of P
R and KR, The nth scatterer behaves like a scatterer of densi P and compress
n
K in a medium of density P and compressibility K .
n
R
R
It can be shown(Morse and Ingard, 1968) that the ratio of the incoherent scattered intensity I to the incident wave intensity I. is
s 1
=
2 2 . 2
e
.exp{-2kia Sln (2 )}
where a is the mean radius of the spheres, y is the mean value of K
(1.19)
(K )/K
o' Yp is the mean value of 3(p -p )/(2p +p ) and k~ is the wavenumber
n n o n o £\.
If it is assumed that the scatterers in R scatter sound independently and that each wavelet does not interfere with any other so that the scattered intensities merely add, the ratio of the intensity of the scattered wave to
that of the incident wave is
(1.20)
By comparing (1.19) and (1.20) it can be seen that interference
between the wavelets modifies the angular distribution of the scattered wave. It is reduced in the forward and augmented in the side and backward directions.
Twersky (1962a, 1962b, 1962c, 1964), Beard et al., (1967) and Shung et al., (1976) have estimated the magnitude of backscattering from dense clouds. That is, from distributions where the separations of the scatterers is so small in comparison to their dimensions that they can no longer be considered to be totally random. Two heuristic approximations were suggested: the 't,vo phase' system and the 'hole' approach. in the two phase system each scatterer is considered to move totally randomly as does a molecule in a gas or to be held in a rigid structure as is a molecule in a crystal. Only those scatterers in the random phase contribute to incoherent scattering. In the 'hole' approach, scattering is considered to occur at the cavity sites (i.e. by the space not occupied by the medium). In effect, the scatterers become the medium, and the medium becomes the scattering source.
All soft tissues have very similar densities. -Under the approximation that the scatterer density p is similar to the medium density p the ratio of
n 0
the backscattered intensity to that of the incident intensity in sparse concentrations can be shown to be
Ir
(1. 21)where W ,K and p are the volume concentration, compressibility and density
respectively of the scatterers. Then, using the 'hole' approach, the backscattered intensity, in very dense concentrations such that Wo~1, is
given by
I
s
+
p
-.:::..--..:::.. \ 2
)
(1.22)However, if the scatterers are rigid, then their volume concentration cannot approach unity. For example, if the scatterers are spheres, then the maximum volume concentration is only 0.64. Beard et al., (1967) assumed that the volume V
h of a hole at the maximum realisable concentration of scatterers can be expressed as
=
V (1 - bW )o 0 (1. 23)
where V is the volume of each scatterer and b is a 'fitting constant'. o
The intensity of the backscattered wav~ can then be expressed as
I s
1.
4.5
=
(1 - W)K - K W
I·
+
o e 0 0
K - K
e 0
The Scattering of Ultrasound by Blood
Blood is a suspension of cells in a liquid called plasma.
(1.24)
There are three major types of cell in blood: red blood cells, white blood cells, and platelets. By far the most numerous are the red blood cells. They are
elastic biconcave disks with an average diameter of 7 ~m and an average thickness of 2 ~m. The percentage fraction by volume which the cells occupy in a sample
of blood is called the haematocrit. Normally this is about
45%.
of intact red blood cells are presented in Table 1.4, (Urick, 1947; Carstensen et al., 1953; Platt, 19S3).
Table 1.4 Acoustically significant properties of blood
Material Density
gm/cm3
p Adiabatic Compressibility 10-12 cm2/dyne (at 200C)
Water 0.998 46.1
Plasma 1.021 40.9
Red blood cell 1.092 34.1
Red blood cells move in a more or less random manner through the plasma at low haematocrits. At 45% haematocrit the cells are separated by about only one tenth of a cell diameter (Shung et al., 1977). At haematocrits above 58% the cells touch each other and begin to deform. At such high haematocrits the blood resembles a crystalline solid (Kol'tsova and Hikhailov, 1970).
The scattering of ultrasound by blood has been studied extensively (Sigelman and Reid, 1972; Shung et al., 1976, 1977; Reid, 1976).
In their experiements these authors· irradiated samples of blood with short
(4 ~sec) bursts of monochromatic ultrasound in the frequency range 5-15 MHz.
The intensity of ultrasound backscattered by blood varies as the fourth power of frequency (Shung et al., 1976). This dependence has been observed at all haematocrits. This is predicted by (1.19) to (1.24).
The intensity of the backscattered ultrasound at anyone frequency is dependent on the haematocrit. Up to haematocrits of approximately 8% the backscattered intensity is found to increase linearly with increasing haematocrit (Shung et al., 1976). This is predicted by Morse and Ingard's
(1968) equations for scattering from clouds of random scatterers (cf. 1.19, 1. 20) • Above
8%
the scatterers can no longer be considered independent. The intensity of the backscattered wave is maximum at haematocrits of 26%. It then decreases with increasing haematocrit. Shung et al., (1976)explains this phenomenon in terms of Twersky (1962a, 1962b, 1964) and Beard's (1967) 'two phase' and 'hole' models. They report excellent agreement between the measured backscattering and that predicted using the models.
Shung et al., (1977) report an investigation of the angular dependence of the scattering of ultrasound by blood at low haematocrit levels. They confirm that, assuming the red blood cells to be scatterers, the scattering has an angular dependence similar to that predicted by Ahuja (1972) for a
difference between the plasma and the blood gives rise to the angular
variation. Hence it is possible to scattering into its compressibility and density contributions. Thus these parameters for a sample of blood cells may be determined by measuring the dependence of the scattered wave.
It is expected that the values of these parameters may be correlated with different pathological conditions (Shung et al., 1977).
The amplitude of a wave backscattered by a sample of blood is
observed to fluctuate with time. The fluctuations can be attributed to the random movement of the cells due to convection within the sample. Using a statistical diffraction theory, Atkinson and Berry (1974) have calculated therate at which the fluctuations occur in terms of the spatial and temporal dimensions of incident ultrasonic pulses.
with the observed fluctuation rates.
Their calculations are in agreement
A statistical approach has also been taken by Angelsen (1980) to describe the observed fluctuations in backscattered wave intensity due to red blood cell concentrations changing'by the diffusion of the cells in the
blood. He explains in the scattered wave in terms of the diffusion velocity of the cells.
1.4.6 The Scat of Ultrasound by Cardiac Huscle
Cardiac muscle is composed of fibres approximately 10-30 ~m in
diameter. They are composed of separate cellular units joined end to end by intercalated disks, (Kadaba et al., 1980). The fibres do not have s
cylindrical shapes. They bifurcate and connect with adjacent fibres to
form a three-dimensional network. Hence there is no single predominant fibre orientation. The fibres are separated by connective tissues and small blood vessels.
Backscat experiments show that the amplitude of the scattered ultrasound is independent of the orientation of the sample to the incident wave
(Lele, 1976; Kadaba et al., 1980). orientation found in the myocardium.
This is consistent with the diverse fibre
Shung and Reid (1977) and Kadaba et al., (1980) report that the intens
f3.3
of ultrasound backscattered from a sample of
where f is the frequency of the incident wave.
tissue has an Cylinders of infinite and subwavelength diameter are known to scatter sound with an
3
the primary source of backscattering in normal tissue may be the myocardial fibres.
Mimbs et al., (1980, 1981) and Kadaba et al., (1980) have measured the effect of differences between the backscattered intensities of normal and infarcted tissue. ~.Jhen a region of the myocardium suffers an infarct, the affected tissue fibroses (scars) and the content of elastin and collagen
increases dramatically. The backscattered intensity from infarcted myocardium is much greater than that of normal tissue. This has been attributed to the increase in collagen content in the infarcted regions. Mimbs et al., (1980) have treated infarcted hearts chemically to break down the collagen fibres into smaller units. These are still units of collagen however. The level of backscatter is then seen to reduce in the infarcted regions. Therefore it appears that intact collagen is the primary source of scatter from within infarcted myocardium.
1. 4.7 The Scattering of Ultrasound by Liver
Liver tissue shows a high degree of regularity in its structure. It is composed of large groups of cells called lobules.
found lobular canals through which flow bile and blood.
Between these are The connective tissue forming the lobular canal network is composed of the proteins elastin
and collagen. The acoustic impedances of elastin and collagen are three or four orders of magnitude greater than those of other tissue constituents
(Fields and Dunn, 1973). Nicholas (1976) comments that the network of lobular canals or the actual lobular structure itself may be responsible for
scattering. In support of this theory Houn tford and Wells (197 2a, 197 2b) find an increased ultrasonic backscattering in people with cirrhotic liver disease. This is also consistent with the results of investigations by
Freese and Lyons (1973, 1979), who find a high correlation between ultrasonic backscattering coefficient and the protein content of excised livers.
However, a high correlation is also found between the backscatter coefficient and the lipid (or fat) content in patients with fatty liver disease. This suggests that there may be more than one source of scattering within liver tissue.
The backscattering coefficient in liver tissue has been found to be proportional to f2.1 (Kadaba et al., 1980) or f2.2 (Chivers and Hill, 1975; Nicholas, 1976) where f is the frequency of the incident wave. These results have been obtained for frequencies in the range 1-5 HHz. Chernov (1960)
backscattered intensity varies as the square of the frequency of the incident wave. It appears that the mean scatterer dimension in liver tissue may
therefore be approximately 1mm (Nicholas, 1976).
Nicholas and Hill (1975) and Nicholas (1976) report experiments to determine the angular dependence of scattering. They report a phenomenon similar to that observed in Bragg X-ray crystallography which suggests a characteristic structural pattern within the tissue. Similar work has been reported by Waag and Lerner (1973), Waag et al., (1973), de Billy and Quentin
(1973) and Braun and Robinson (1980).
1.4.8 tral Studies of Ultrasonic Backscatter
It is obvious, even from the earliest ultrasonic images of tissues (cf. Wild and Reid, 1952), that small but appreciable echoes may be observed from sources within tissues. Such small scale echoes can be readily seen in images obtained using modern 'grey scale' ultrasonic imaging equipment
(cf. Kossoff and Garrett, 1973; Taylor et al., 1973). If a sufficiently short pulse of sound was to be transmitted into a tissue sample, it would be
reasonable to expect each peak in the received echo train to correspond to a single scatterer. Commercial diagnostic imaging devices cannot produce such a pulse. The echo trains received by commercial systems is dependent on the spatial and temporal characteristics of their transmitted pulses. Gore and Leeman (1977) predict that scattering is observed from sources within tissue when their spatial separation frequency is in the range 0 cycles/mm, Diagnosing disease from the texture of the scatter seen in two-dimensional images is common clinical practice (McDicken, 1981).
An alternative method of analysing backscatter has been investigated by Chivers and Hill (1975). They irradiate samples of tissues with broadband ultrasonic pulses. An 8 ~sec pulse of the backscattered wavetrain is ed through to a spectrum analyser. It is observed that each type of tissue appears to have its own characteristic spectrum.
Similar studies have been reported by Lizzi et al., (1976) and Lizzi and Elbaum ~1979). They have catalogued the spectra of backscattered echoes from various eye tissues according to the type of disease. They claim that it is possible to distinguish between several different types of diseased tissues on the basis of the spectra. It is reasonable to expect that such
deeper organs, such as the liver, corrections would have to be made to the spectra to account for the effects of intervening tissues.
1.5 ATTENUATION OF ULTRASONIC WAVES BY TISSUES
Attenuation of an ultrasonic wave traversing a medium is described by an exponential law (Wells, 1977; Parry and Chivers, 1979), that is
A
=
A exp(-ax)o (1. 25)
where A is the amplitude of an acoustic wave of initial amplitude A after o
it has travelled a distance x into a medium having an attenuation
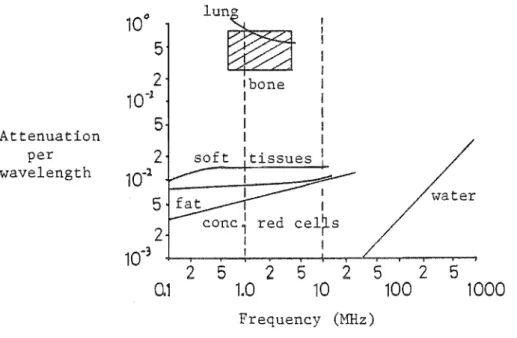
coefficient a. The attenuation coefficient is a function of frequency for al tissues. This dependence for several tissues is illustrated in Figure
1.2. A comprehensive review of at'tenuation data in the literature has been published by Parry and Chivers (1979).
10°
lun~
5
2
Ibone10-
1 II
5
IAttenuation I
per
2
soft Itissueswavelength
10-
lI water
5
r2
red cel~s10-
3 I2
5
2
5
2
5
25
0.1
1.0
10
100
1000
Frequency (MHz)
Figure 1.2 Graph of attenuation wavelength vs, frequency for
On the basis of the magnitude of the coefficients, the tissues can be grouped into several categories. These are water, red blood cells, fat, soft tissues, lung and bone. The range of the attenuation coefficients reported for each of these tissues is large (Carstensen, 1979). The variation is due to normal biological variability, inhomogeneous tissue samples, the method of measurement, the preservative process to which the samples have been subjected,
the time after excision and the temperature at which the attenuation is measured. Also, much of the data reported is for species other than man (Parry and Chivers, 1979).
It is common practice to describe the attenuation coefficient of each tissue in terms of a power law of the form
(1. 26)
where a and b are characteristics of the tissue. For fat and soft ti.ssues b is usually very close to unity, while for blood cells it is close to 1.2. Bone has a quadratic dependence up to 3.5 MHz, after which a lower power dependence is apparent. Water follows a quadratic law at all frequencies. Water is much less attenuating than fat, blood and soft tissues. Lung and bone are the most highly attenuating. Attenuation of ultrasound by tissues is due to two factors: absorption and scattering. Absorption is the
conversion of acoustic energy into thermal energy. Scattering is the removal of some of the energy of an acoustic beam by reradiating it from
regions where the acoustic parameters of the media change. In the literature, absorption is often confused with attenuation (Wells, 1977). Losses due to scattering within tissues are believed to be small (O'Donnell and Miller, 1979). This is because the acoustic properties of the scatterers do not differ significantly from the rest of the tissues. Therefore attenuation is due almost entirely to absorption. The mechanisms by which absorption occurs are not well understood (Carstensen, 1979). Several of the mechanisms which have been suggested are now described. It is unlikely that all of these mechanisms are equally applicable to the different tissue types.
1. 5.1 Classical Absorption in Fluids
2
2w n
s 3 3p c
o
(1.27)
where w is the angular frequency of the acoustic wave travelling with velocity c in a medium of density Po and a shear viscosity coefficient ns
(Dunn, 1976). Classical absorption indicates that the attenuation coefficient varies as the square of the frequency. This is not seen in biological
tissues in the 1-10 MHz frequency range. Therefore, somewhat surprisingly perhaps, it cannot be considered to be an important mechanism.
however be significant at frequencies above 1000 MHz.
1. 5.2 Relaxation Mechanism
It may
This is believed to be the 'most important mechanism (Wells, 1977). In an acoustic medium, energy may be considered to be stored in various 'compartments' which may be physical or chemical energy states such as translational molecular motion states (cf. Carstensen and Schwan, 1959; Pauly and Schwan, 1971). All of the compartments are coupled to each other so that energy may be shared among them. There are finite time constants associated with energy transfers between the compartments. vmen an acoustic wave passes through the medium, compressional energy is transfered from the wave into the compartments. Most energy is transfered to those with the smallest time constants. Energy is then shared with the other compartments. During the decompression half cycle of the acoustic wave, energy is
transfered back from the compartments. The energy stored in the compartments with the short time constants returns to the wave almost immediately. That stored in compartments with time constants almost equal to the period of the wave returns out of phase and is absorbed. Little energy is stored in the
compartments with longer time constants. Therefore there is little loss of energy via these compartments.
e by assuming absorption to be caused by relaxation mechanisms. Absorption by bone rises with temperature (Kishimoto, 1959). This
is also predicted by relaxation mechanisms because absorption by bone decreases with increasing frequency.
Absorption by central nervous tissue is more complicated as Dunn and Brady (1973, 1974) have reported for experiments on mice. It is found to both
increase and decrease with temperature depending on the frequency of ultrasound
,i used. It appears that this cannot be
mechanisms.
in terms of relaxation
If a single relaxation mechanism has a time constant l , then the
attenuation per wavelength a
A
,
is (Markham et al., 1951)2 ( C 2
)
IT
:2 1 -
c~
1
+
(Wl)
o 00
(1. 28)
where c is the velocity of a wave with angular frequency wand c , c are the
o 00
velocities at the wave at very low and very high ies respectively. This relation has been shown to be consistent with the observed absorption of ultrasound in haemoglobin (Carstensen and Schwan,
1959a).
Relaxation mechanisms also requires that dispersion occurs. The
magnitude of the d ion observed in soft tissues and of biological macromolecules is consistent with that predicted by relaxation theory
(Carstensen, 1979).
Absorption
per c.().. wavelength
0.1
1
10
Frequency ( f )
Figure 1.3 The ence. of absorption per wavelength on frequency for a single relaxation process.
Absorption is greatest when the time constant of the relaxation process is equal to the period of the ultrasonic wave. If absorption is due to several relaxation processes, then an almost linear dependence of absorption
coefficient can be achieved over a wide range of frequencies. Suppose
several relaxation processes occur at different frequencies as is illustrated
in 1.4. The overall absorption at any frequency is due to a
Absorption
1.5.3
Frequency
Figure 1.4. Illustration of how several relaxation processes at different frequencies can combine to produce an
apparently linear dependence of absorption coefficient on frequency.
Relative Motion
Tissues can be considered to consist of small particles suspended in fluid media. For example, within a cell there exist many particles such as large protein molecules, which inhabit a liquid medium called the cytoplasm. Imen an acoustic wave passes through the fluid, the particles try to follow the motion of the medium. How well they manage to achieve this depends on the relative densities and viscosities of the particles and the fluid and on the frequency of the wave. Often the particles do not closely follow the
motion of the fluid, and the particles move appreciably relative to the medium. This causes absorption by viscous drag. It has been demonstrated
that relative motion between the very large molecules (macromolecules) found in cells and the cytoplasm may account for much of the absorption of ultrasound by heart muscle and skin and may also account for absorption by blood cells (O'Donnell and Miller, 1979). Absorption of ultrasound by blood may be accounted for by considering the relative motion of red blood cells and plasma (Carstensen and Schwan, 1959b).
1.5.4 Thermal Losses
fluid media, absorption of ultrasound also occurs from the thermal losses. The magnitude of such losses is dependent on the relative heat capacities, thermal conductivities and coefficients of thermal expansion of the particles and the media and on the frequency of the wave. O'Donnell and Miller (1979) have estimated the amount of acoustic energy absorption which can be
attributed to thermal losses by subcellular particles in red blood cells,
heart muscle and skin. They conclude that losses by such mechanisms are small. Approximately 100 times more energy is absorbed by relative motion losses.
1. 5.5 Molecular Interaction
This is a poorly defined concept not based on any postulated
mechanism. Kremkau and Carstensen (1972) have demonstrated that concentrated solutions of haemoglobin have a much greater absorption per molecule than do dilute solutions. Other experiments (cf. Ponder, 1945; Kremkau and
Carstensen, 1973) show that if the molecular structure of haemoglobin is chemically altered, then a significant increase in absorption can result. It has been suggested that these ob'servations may be explained in terms of interactions between macromolecules of haemoglobin (Carstensen, 1979).
1. 5.6 Absorption by Macromolecules
Macromolecules are the structural components of living matter. They are polymers of smaller molecules, consisting of amino acids linked together in special ordered forms. The most important are nucleic acids, the proteins and some carbohydrates such as cellulose and starch. There is evidence that absorption in soft tissues and blood may be due to the interaction of ultrasound with the macromolecules.
Pauly and Schwan (1971) found that there is little difference between the magnitude of the absorption by whole liver and by that which has been homogenised to a subcellular level. This demonstrates that neither the ordered structure of liver tissue nor the structure of individual liver cells has any great influence on ultrasonic absorption.
Further evidence of macromolecular absorption is provided by the experiments of Kremkau and Carstensen (1972) and O'Brien and Dunn (1971). They demonstrate that a 10% solution of the amino acids which make up
haemoglobin has a much smaller specific absorption (i.e. absorption per gram solute) than do solutions of intact haemoglobin. They also report that after chemically treating haemoglobin to break it down into smaller units solutions of smaller specific absorption result. This has been shown to be true for ·other , nucleic acids and polysacchorides (cf. Kremkau and
Carstensen, 1972; Johnson et al., 1979).
results of these studies indicate that upon successive
.CHAPTER 2
MEDICAL ULTRASONIC H1AGING
2.1 INTRODUCTION
Medical ultrasonic imaging systems are usually designed to image internal organs by one of two techniques. These are the pulse-echo method and the transmission method.
this chapter.
Details of these techniques are discussed in
By far the most popular technique is the pulse-echo method pioneered by Wild (1950; Wild and Reid, 1952). With this technique, a series of
pulses of very high frequency sound are transmitted into a patient. An image is then formed from the echoes returning from organs within the patient.
The techniques of forming images using the pulse-echo method are reviewed in §2.2. Technical details of pulse-.echo imaging systems are discussed in §2.3.
The second method, transmission imaging is similar to ordinary shadow X-ray imaging. A beam of ultrasound instead of X-rays is directed through a patient to create an ~ltrasonic attenuation shadowgram' of the patient's internal structure. This was the first medical ultrasonic imaging technique (Dussik et al., 1947). It has not proven to be popular and few such systems
have been developed.
An obvious variation of transmission imaging is ultrasonic computed tomography. This technique is similar to X-ray computed tomography in that a map of the ultrasonic velocities or the ultrasonic attenuation coefficients within a patient are produced (Greenleaf et al. ,1981; Bates and Dunlop, 1977; Whiting et al., 1981). Transmission imaging techniques are discussed in §2.4.
2.2 THE ECHO LOCATION PRINCIPLE
The echo location principle is the basis of medical pulse-echo
imaging systems. The principle is illustrated in Figure 2.1. An ultrasonic probe is placed in contact with medium 1 and is directed towards the interface between medium 1 and medium 2. At a time t
o
a pulse of ultrasound is emitted by the probe into medium 1 in which it travels with velocity vI' At a time tl it impinges on the interface between medium 1 and medium 2. This interface is at a distance denergy of the pulse to be reflected back to the probe while the rest is transmitted into medium 2. At a time 2t1 the reflected pulse is received back at the probe. If the value of v
1 is known then the distance d1 to the interface from the probe is given simply by
(2.1)
medium 1 medium 2
K
dl )1t::O
prObe~~
·O"'t<tl
9
Yv
t=tl
9
t"'" t<2t, I ~
9
t=2t
I
·cf
Figure 2.1 Principles of echo location
2.2.1 The A-Mode Display
The amplitude modulated or 'A-mode' display is the simplest technique. It is illustrated in Figure 2.2.
oscilloscope
medium 1 medium 2 medium 3
::Obtfv-q
q
-\-tl
~
q
t2
ctr
Figure 2.2. The generation of the A-mode display
The transducer probe is connected to an oscilloscope to display the envelope of the echoes which it receives. The oscilloscope's timebase is triggered at the same instant as the transducer is excited. On excitation, a deflection is displayed on the oscilloscope trace. Later, at times t1 and t
2, echoes are received at the transducer. These are displayed as further deflections whose heights are proportional to the amplitudes of the echoes. The system
is usually retriggered to refresh the display at a rate of about 1 KHz.
simple studies such as brain midline localisation or measurements of the length of the optic axis of the eye. Such information is easily abstracted from the A-scan (Robinson et al.,1970).
2.2.2 The B-Mode Display and the B Scan
Consider now a cross sectional slice of a patient as depicted in Figure 2.3(a)
probe ...
patient's cross-section (a)
..
..
It "B-mode display (b)
2.3 Formation of the B-mode display
It is usual to empl.0Y a transducer excitation and reception system similar to that used for the A-mode display. However, further circuitry is employed to display the detected echoes as a series of dots on a screen. The
brightness of the dots is ideally proportional to the amplitude of the received echoes. Hence this is called a 'brightness modulated' or B-mode display.
The position and direction of the transducer is usually electronically encoded. Therefore it is possible to determine the relative origins of echoes from within the patient. Hence the dots representing received echoes can be displayed on the screen according to their origins. As the transducer is moved around the patient, the beam sweeps through the patient's anatomy. The dots displayed with the beam in different positions combine to form an image of the patient's anatomy. This is illustrated in Figure 2.4.
probe
Jf,
<
I, .
I •
I
\
,
,
,
.
,
,
\ .. l ,,'
patient's outline _ _ _ ~) B-mode display
,
I
Figure 2.4 Formation of the B-mode scan
The resulting image is called a 'B-mode scan'. Such two-dimensional images are of great use and have found many applications in abdominal imaging.
2.3.3 The H-Mode Display and the H Scan
Not all organs within the human body are stationary. It is often desirable to study the motion of some organs such as the heart. Abnormal motion of such organs is often an indicator of disease.
displaying motion is illustrated in Figure 2.5.
probe
n
skin
•
:t
..
~t
~
moving structures B-mode displayFigure 2.5 Formation of the M-mode display
A transducer probe is held against a patient.
A useful method of
~
)
M-scan
A B-mode display of structures in the path of the transducers beam is presented on a screen. The B-mode display is then swept across the screen. Any motion of the structures causes the B-mode display to change as it sweeps. The resulting image is called an H(motion) or TM (time-motion) scan. Often i t is
convenient to hold the B-mode display stationary, and to obtain a hand-copy by moving a strip of photographic paper past it.
Although M scans present motion information from only a single line into a patient, a clinician familiar with such scans can often readily recognise motion abnormalities in them.
2.2.4 The Real Time B Scan Display
While the H scan is a valuable tool for investigating structural motion, it is desirable to observe moving structures in real time on a two-dimensional display. This can be effected by arranging a transducer probe to scan its beam across the part of the patient's anatomy under investigation. The resulting B-mode scan is then displayed on a screen and the image is updated each time the beam rescans the patient.
The speed of sound in soft tissue is approximately 1500 m/sec.
Since structures up to 15 cm from the transducer must be scanned, the highest frequency at lt7hich the transducer may be excited must often be no higher
content of real-time B-scans is very-limited.
Beam scanning can be effected by tHO methods. First, it can be done mechanically by physically moving the transducer probe, such as by Hobbling it on its own axis. This makes the beam sweep through a sector. Various
mechanical scanning systems have been developed, (cf. Kambe et al., 1977; riatzuk and Skolnick, 1978). Second, it can be done electronically by
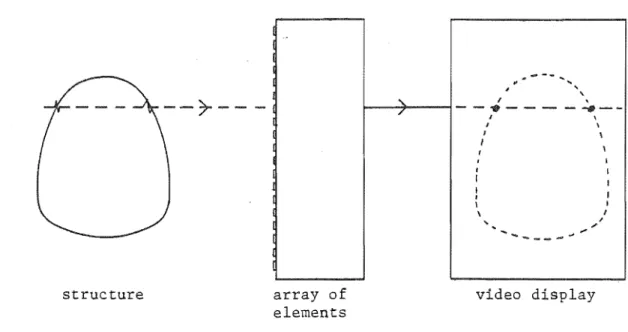
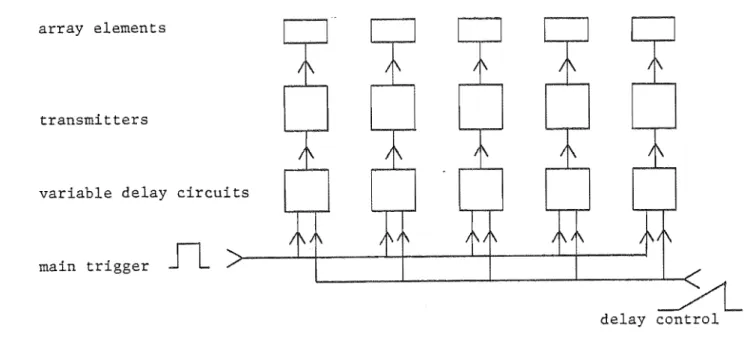
simultaneously pulsing adjacent members of a linear array of miniature transducers. The individual beams are combined to form a
by introducing an appropriate delay between the pulsing of The direction of the beam is changed by altering the delay. in detail in §2.3.
narrow beam acent transducers. This is covered
2.2.5 With B-mode scanning it is not always possible to move the tranducer's beam in the plane which a clinician w'ishes to image. C-mode scanning is a technique which is occasionally employed to investigate structures at a constant depth Hithin a patient. It -is illustrated in 2.6.
scanning
Figure 2.6 A basic C-scanning system
With this technique, a transducer is raster-scanned across a patient. The echoes from Hithin a short interval of duration t
2, after a constant delay t1, are stored and presented on a two-dimensional display. As the C-mode scan presents images in perpendicular to the transducer beam, it is possible to image in planes Hhich are inaccessible with B-mode scanning.