A multi-objective parameter
calibration approach
Master’s thesis
Industrial Engineering & Management
–
Master’s thesis (MSc)
Industrial Engineering & Management
University of Twente, Enschede, the Netherlands
Title
A multi-objective parameter calibration approach
Author
Daniel Sebastian Belter
Student number
0166871
[email protected]
Supervisors
Dr. ir. M.R.K. Mes, University of Twente
Dr. ir. J.M.J. Schutten, University of Twente
Ing. R. van der Zee, Vanderlande Industries B.V.
Date
Abstract
This master thesis presents a diagnostic study on scalarized, multi-objective automatic calibration of the bag-gage batching process of a Vanderlande system at Schiphol South Terminal. Several simulation and emulation steps are necessary within the design and implementation of such a system. The problem we study is how to incorporate feedback from later implementation stages into initial simulation or emulation models that are based on a high abstraction level. Our main objective is to automate the calibration methodology for large-scale simulation models that have to be matched with realistic values from follow-up project stages or the implemented on-site system itself. This automatic calibration can help to reduce overall project lead-time and enhance the validity of simulations and emulations. We test the performance of several calibration methodol-ogies according to their convergence speed and accuracy of parameter estimation in comparison to an initial parameter estimation based on histogram frequency matching. The test calibration methods are Random Search, Latin Hypercube Sampling, a Simulated Annealing adaptation, and a combination approach that merg-es Simulated Annealing with a Latin Hypercube (LHS-SA). All tmerg-est approachmerg-es performed significantly better than the initial, manual parameter estimation. The singular use of our Simulated Annealing modification shows the best convergence characteristics of all tested calibration algorithms regarding both speed and accuracy. However, its cooling scheme is vital for a successful calibration attempt. It was not possible to prove that syn-ergy effects of the LHS-SA method exist, but still we suspect them to be present. This might be due to the fact that the researched problem structure did not include many local minima. However, we cannot clearly verify this by our observations. Our Simulated Annealing adaptation has shown to be an effective automatic meth-odology for the calibration of multi-objective problems which include several tunable parameters.
Keywords
Summary
In the beginning of this research, we identify a calibration problem within Vanderlande Industries. Its solution may translate into significant time and financial savings in the execution of an arbitrary company project. Dur-ing the transition phases of such a project, a systematic calibration approach can help to make a difference by recurrently incorporating feedback of additional knowledge about the system.
In order to investigate more about the benefits of a useful automated calibration methodology, we examine the current situation and practice on calibration within Vanderlande. We noticed that often calibration at-tempts at Vanderlande are executed in a trial-and-error fashion. However, scientific literature shows that there are better ways to calibrate a system. In this research, we focus on the baggage batching process at the early-baggage-buffer (i.e., BagStore) at Schiphol South Terminal for further calibration testing. In particular, we look at the process of releasing early checked-in baggage from the baggage buffer to the in-cache lines near the make-up robots that automatically stack baggage into airplane load units (i.e., containers). We revise main-ly the delivery quality of luggage. Therefore, we develop our own simplified simulation model of the imple-mented baggage handling system to demonstrate that even a rather abstract model can be calibrated decently towards data from practice. Moreover, we show that a systematic automatic calibration method will outper-form manual attempts in this respect clearly.
After we specify our working point, we conduct a thorough literature study on calibration and related issues. In that section, we explain the distinction between verification, validation and calibration and what the need of the latter is. Moreover, we show how deviations between models or between a model and reality are quanti-fied and compared and what their reasons of existence are. Also we elucidate the benefits and trade-offs of automatic, in comparison to manual, calibration. In addition, we elaborate on single and multivariate calibra-tion approaches and follow the latter in our research. We then clarify a suitable mathematical problem formu-lation, explain general calibration limitations, and show what sense sensitivity analyses make in this regard. As for automatic calibration, we examine various combinatorial optimization schemes and illustrate why Simulat-ed Annealing is a popular sequential approach usSimulat-ed in calibration. Also Latin Hypercube Sampling is a wide-spread non-sequential method that appears to have positive effects on calibration performance. Due to this, we test both of the mentioned optimization algorithms for the situation at Vanderlande and also combine them to see if there exist any synergy effects when a non-sequential and a sequential approach are merged. Thereafter, we conduct a data analysis on various calibration input measures for our anticipated simulation model, as well as on benchmark measures from reality to assess how well the applied calibration approaches perform regarding their goodness-of-fit. We further describe the calibration model set-up, its scope and the included assumptions we make. In Chapter 6, we explain our four test calibration approaches in detail and how we implement the model set-up into the Plant Simulation software package from Tecnomatix Technologies Ltd. Additionally, we carry out a sensitivity analysis on the objective function weights and describe the experi-mental set-up to assess algorithm convergence behavior with the usage of power regression.
Afterwards, we explain the results that we conduct with our calibration model. This includes scattering pat-terns of candidate solutions per test calibration approach, regression of algorithm convergence and the aver-aging of those regression formulations. To assess the statistical substance of our regression, we perform a relative error evaluation, in which all test calibration methods achieve a relative error of less than 20%. Finally, we choose our adaptation of Simulated Annealing as the preferred choice for automatic calibration.
Preface
When I started this master’s thesis project around eight months ago, I realized that this would be my last big challenge as a student of the University of Twente – a period of my life that I really enjoyed with all its peaks and occasional downsides. Also, it is the conclusion of my graduation internship at Vanderlande Industries B.V., which gave me the extraordinary chance to prove myself scientifically and socially in a very exciting pro-fessional environment. It was a happy, but also very hard-working, period for me in that I learned a deeper meaning of the terms prioritization, out-of-the-box-thinking, and responsibility.
First of all, I want to deeply thank my company supervisor Mr. Remko van der Zee and the head of the Major Projects division Mr. Rudi Debets for taking me on board with this graduation project and the great opportuni-ty, which this represents to me. In particular, Mr. van der Zee was always there for me when I needed support for my project and tried to help me as much as he could with his knowledge and experience.
Of course, also very sincere thanks go to my university supervisors Dr. Martijn Mes and Dr. Marco Schutten. In my opinion, both of them were excellent academic sparring partners, whose professional opinion I personally value a lot. I was glad to work with them on this project and hope they will also keep me in good memories as an enthusiastic student.
Furthermore, I want to give thanks to my beloved wife Moon-hee, who always is an inspiration to me. Being totally alone executing this kind of a project can be quite a though experience on someone’s mind. In that sense, I am endlessly happy that she always supported me in these, sometimes hard, times with all her positiv-ity and love. In addition, I want to mention my friends who also helped me substantially with this thesis: Arturo Perez Rivera, Harm Hoeksema, Lara López and Mariana Goldak. Due to some of their creative ideas I was able to quickly escape several moments of doubts and hesitation. Also, I very deeply want to thank my parents for always supporting me, not just now during the conduction of my thesis, but throughout all my studies and far beyond.
This graduation is not the end, it is just the beginning! Sincerely,
List of abbreviations & Glossary
Throughout the text body, words written in “italic” can be found in this glossary.
Abbreviation
Brief description
70MB project Major project at Schiphol Airport to connect all piers and separated baggage han-dling areas with each other to be capable to handle 70 million passengers per year
BagStore Baggage storage unit at Schiphol South terminal that temporarily stores early checked-in bags of passengers and thus functions as a bag buffer
BHS Baggage Handling System
CDF Cumulative Density Function
Flow test A flow test is a end-of-project capacity test of a BHS to show the customer that negotiated baggage handling performance can be yielded within a certain amount of time
GOF Goodness-of-fit: A measure that statistically describes the difference between ob-served and expected values
IE&M Industrial Engineering & Management
In-cache line Conveyor lines in front of any make-up robot to buffer arriving baggage from the BagStore
LHS Latin Hypercube Sampling
LU Load unit: airplane container
Make-up robot A robot that automatically can load baggage into a container load unit
MSc Master of Science
PD file Project Definition file: An evolving digital record that contains crucial project infor-mation (e.g., system layout, equipment capacities, other constraints)
PDF Probability Density function
PLC Programmable Logic Controller: specified purpose computer designed for multiple input and output arrangements for lower level equipment control
RS Random Search
SA Simulated Annealing (and its adaptations)
Table of Contents
ABSTRACT ... I
KEYWORDS ... I
SUMMARY ... II
PREFACE ...III
LIST OF ABBREVIATIONS & GLOSSARY ... IV
CHAPTER 1: INTRODUCTION ... 1
1.1 RESEARCH MOTIVATION ... 1
1.2 PROBLEM IDENTIFICATION ... 1
1.3 RESEARCH SCOPE ... 3
1.4 RESEARCH GOAL ... 4
1.5 PROBLEM STATEMENT ... 4
1.6 RESEARCH QUESTIONS ... 4
1.7 CONTRIBUTIONS ... 5
CHAPTER 2: PROBLEM ANALYSIS ... 6
2.1 VANDERLANDE INDUSTRIES B.V. ... 6
2.2 CURRENT SITUATION ... 8
2.3 BAGGAGE BATCHING ... 10
2.3.1 Batching process implementation in practice ... 11
2.3.2 Abstraction deviations of the batching process in practice and simulation ... 14
2.4 DESIRED SITUATION ... 14
2.5 DISCUSSION ... 14
CHAPTER 3: LITERATURE REVIEW ... 15
3.1 DISTINCTION BETWEEN MODEL VERIFICATION, VALIDATION AND CALIBRATION ... 15
3.2 DEVIATION MEASUREMENTS FOR CALIBRATION... 16
3.3 CONCEPTS OF MODEL CALIBRATION... 18
3.4 CALIBRATION PROBLEM FORMULATION ... 20
3.5 MANUAL AND SEMI-AUTOMATIC CALIBRATION ... 21
3.6 AUTOMATIC CALIBRATION ... 22
3.7 SEARCH SCHEMES USED IN AUTOMATIC CALIBRATION... 24
3.8 SENSITIVITY ANALYSIS PRIOR TO CALIBRATION ... 26
3.9 DISCUSSION ... 27
CHAPTER 4: DATA ANALYSIS ... 28
4.1 SIMULATION MODEL INPUT ... 28
4.1.1 Batching hours per day ... 29
4.1.2 Batch composition / batch request inter-arrival time ... 29
4.1.3 Batch size ... 31
4.1.4 Destination robot allocation ... 31
4.1.5 Dispatch delay of a batch after batch composition ... 31
4.1.6 Travel times ... 32
4.2 CALIBRATION MODEL BENCHMARK DATA ... 34
4.2.1 Inter-arrival time between batches at in-cache lines ... 34
4.2.2 In-system time per batch ... 35
4.3 DISCUSSION ... 36
CHAPTER 5: MODEL SET-UP... 37
5.1 SCOPE &LEVEL OF DETAIL ... 37
5.2 TYPE OF SIMULATION MODEL ... 38
5.3 ASSUMPTIONS ... 38
5.4 PROCESS FLOW WITHIN THE MODEL ... 39
5.5 OBJECTIVE FUNCTION &CONSTRAINTS ... 40
5.6 MINIMUM NUMBER OF MODEL REPLICATIONS ... 41
5.7 DISCUSSION ... 41
CHAPTER 6: SOLUTION APPROACH & EXPERIMENTATION ... 42
6.1 AUTOMATIC CALIBRATION APPROACHES ... 42
6.2 MODEL IMPLEMENTATION ... 44
6.3 VERIFICATION &VALIDATION ... 45
6.4 SENSITIVITY ANALYSIS ... 47
6.5 EXPERIMENTAL SET-UP ... 47
6.6 DISCUSSION ... 48
CHAPTER 7: RESULTS & FINDINGS ... 49
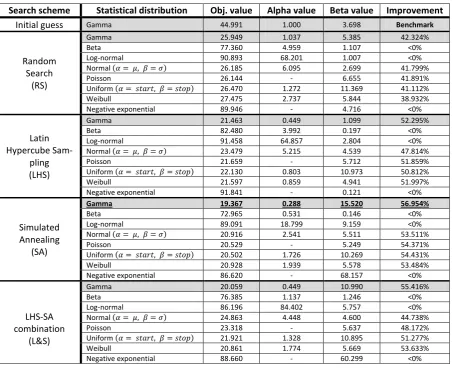
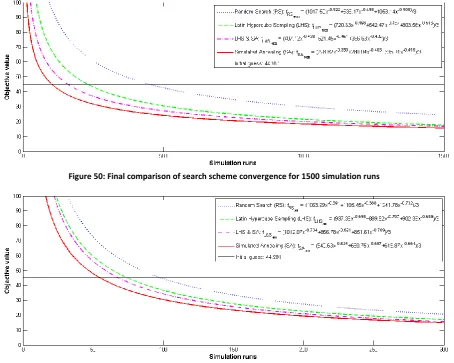
7.1 COMPARISON OF CALIBRATION METHODOLOGIES ... 49
7.1.1 Computational calibration results ... 49
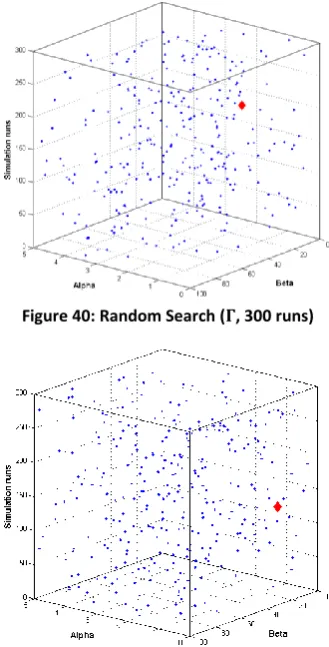
7.1.2 Scattering behavior of candidate solutions ... 50
7.1.3 Convergence speed & quality ... 53
7.2 DISCUSSION ... 57
CHAPTER 8: CONCLUSIONS & RECOMMENDATIONS ... 58
8.1 CONCLUSIONS ... 58
8.2 RECOMMENDATIONS ... 59
REFERENCES ... A
APPENDIX ... J
Chapter 1:
Introduction
The aim of this research is to improve the transition process between conceptual planning and actual imple-mentation of Major Projects within Vanderlande Industries. To this end, we strive to automate the calibration methodology for large-scale simulation models that have to be matched with realistic values from follow-up project stages or the implemented on-site system itself. Eventually, this can help to decrease overall project lead-time and to enhance the validity of simulations and emulations with which additional sensitivity analyses for later process optimization can be conducted. In the following sections we elaborate on the key framework aspects of this research. We divide this chapter into seven sections: research motivation (Section 1.1), problem identification (Section 1.2), research scope (Section 1.3), research goal (Section 1.4), problem statement (Sec-tion 1.5), research ques(Sec-tions (Sec(Sec-tion 1.6) and the contribu(Sec-tions that we expect to deliver (Sec(Sec-tion 1.7).
1.1
Research motivation
This study is initiated by the “integration group” within the Major Projects engineering department of the Baggage Handling division* at Vanderlande Industries† and is a graduation assignment for the Master of Sci-ence program of “Industrial Engineering & Management” at the University of Twente. We were approached by the integration group – which is the final problem owner‡ – to decrease cost and time efforts spent during the transition of project phases that occur during the implementation of a mid- or large-sized baggage handling system. In Section 1.2, we identify the main problem and brake it down into various underlying causes to find the most relevant problems that are connected to the observed key issue.
1.2
Problem identification
We determine the main problem that we will solve as:
The necessity for a decrease in lead-time throughout the final implementation stages of major projects, especially focusing on the on-site realization of large-scale baggage handling systems at airports, e.g., at Amsterdam Schiphol Airport.
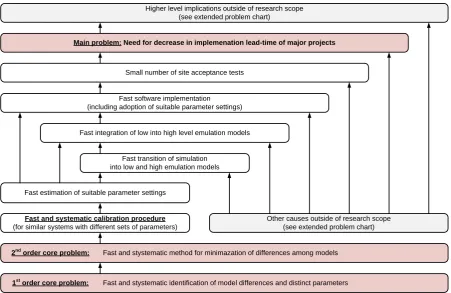
Figure 1 elucidates the classification and “localization” of the core problems. Essentially, this graph intends to establish a cause-and-effect relationship among issues that are relevant for the main problem, which the prob-lem owner experiences. As stated, the reduction of lead-time of a generic major project is the main issue we focus on. We leave higher level implications of this problem out of consideration, since they fall outside of the scope of this research, which we explain in the next section. Nevertheless, we can retrieve those implications from Appendix A4.
In order to be able to focus on lower level implications of the above-mentioned main problem, we look into the organization starting from the scope of a general project (see Appendix A2). First of all, a good coordina-tion of the realizacoordina-tion on-site will eventually decrease financial and temporal efforts spent. In case of the prac-tical realization, this is mainly due to a low number of flow or site-acceptance tests conducted at the end of a the implementation phase – these are stress tests of the built system to show that customer requirements can be met for extraordinary high volume instances. Fast and fault free hardware, as well as, software implemen-tation on-site mainly realizes this. The latter of both we follow further. Again, for a lean software implementa-tion, a fast estimation of important parameter settings is necessary - in particular during the transition period
* See Appendix A1 for more details about company and departmental specifics. † We provide an outline of the host company in the next chapter.
‡
among several project phases. This incurs that parameter settings can be adjusted correctly if an organized information feedback loop for achieved and planned system outcomes exits.
Figure 1: Problem chart
At Vanderlande baggage handling systems, performance tests are executed a-priori in two different ways: simulation and emulation. With simulation, they assess the achievement of promised capacity requirements the fictional system setup. In contrary, emulation tests actual system behavior with implemented Java code and the Programmable Logic Controller units (PLCs) that will be placed on-site later on. Further, emulation is split up into high and low level test scenarios. In the high level version, the logistical logic of the baggage han-dling is reviewed, while the low level emulation solely focuses on the testing of task instruction and report transfer of PLCs.
Taking this into account, an adequate software realization additionally depends on a fast and successful transi-tion from system simulatransi-tion and emulatransi-tion test models§ into the real-life system. However, this is tributary on a good integration of low level emulation into high level emulation, as well as an appropriate transition of the simulation model into both emulation model types. Thus conclusively, there is a need for a systematic calibra-tion methodology which can quickly identify and decrease deviacalibra-tions among different types of models or with the actual system.
Also other factors exist that can have significant influence on the software implementation or on its underlying aspects. However, we exclude these from this research, since they are not feasible within the timeframe given, or there exist deeper layers of acting problems whose exploration is too complex. For instance, extensive vali-dation procedures, component development and realistic requirement assessment are part of those excluded factors (see Appendix A4).
§ Emulation = simulation of test instances with parts of the already realized system or with its individual
com-ponents in-house at Vanderlande Industries.
Small number of site acceptance tests
Fast software implementation (including adoption of suitable parameter settings)
Fast integration of low into high level emulation models
Fast transition of simulation into low and high emulation models
Fast and systematic calibration procedure
(for similar systems with different sets of parameters)
Other causes outside of research scope (see extended problem chart)
Fast and stystematic method for minimazation of differences among models
Fast and stystematic identification of model differences and distinct parameters Higher level implications outside of research scope
(see extended problem chart)
2nd order core problem:
1st order core problem:
Main problem: Need for decrease in implemenation lead-time of major projects
Nevertheless, we believe that we can influence the main problem of the integration group significantly by a fast and systematic calibration procedure that initially recognizes inconsistencies in system performance of distinct models or the implemented system and then further minimize those deviations. Due to this, we chose to treat the two core problems visible in Figure 1 in-depth.
1.3
Research scope
The main constraining factors for this study are the temporal restrictions regarding the project horizon. This significantly influences the degree of realization, respectively implementation, our research outcomes. Moreo-ver, the main focus of this research is the automation of the calibration method of the baggage batching pro-cess which is implemented at Schiphol South, since this endeavor is generally considered non-trivial to solve. Due to the fact that suitable tuning of the parameters related to the batching algorithm is difficult to execute in the currently applied trial-and-error method, we strive to automate this process as much as possible. In the next paragraphs, we provide a brief outline of the basic idea behind the anticipated calibration methodology.
The baggage batching process and its calibration
We develop a suitable automatic calibration method for the baggage handling system of which we can retrieve the layout in Figure 5, p. 10. Especially, the baggage-delivery-performance-matching on the routes from the early-baggage-storage-unit, also called “BagStore”, and the baggage make-up robots** is of interest for Vanderlande Industries and, in particular, the integration group. An in-depth description of the batching pro-cess and its implementation in practice and in simulation is given in the next chapter.
A challenging issue regarding the calibration of this process is that the algorithms implemented in simulation and reality use noticeably distinct process steps and different parameter sets to imitate the same anticipated batching behavior. Thus, there exists a gap among the level of abstraction of the simulation and the real pro-cess. This is the reason why so far it is unclear to Vanderlande how to systematically match related system outcomes that are supposed to be nearly equal to each other.
The basic thought behind the anticipated calibration method is to generate similar process output from identi-cal input scenarios in case of systems with differentiated parameter sets. “Similar output” does not mean iden-tical though. Nevertheless, simulation results should meet a certain range of outcome in comparison to later-stage emulation model counterparts or practice. An acceptable range, or Goodness-of-fit (GOF) we specify later on. It is clear that one particular parameter setting cannot always generate similar output in comparison to other models or the actual system under the condition of identical input. Since, both simulation and reality have variability which cannot be exactly matched, there will always be certain uncertainty in comparison. In between computational models, a variance reduction technique called “Common Random Numbers” (Law, 2007) can be applied to decrease this gap, since the “same” randomness is used in the models that are com-pared. This implies that experiments can be carried out under the same “environmental conditions” such that other factors will be accountable for differences. However, between any type of model and reality, this can only be approached to a certain degree. It is our aim to find a calibration method that generates an acceptable Goodness-of-fit under the assumption that representative samples of observations have been taken from reality for calibration matching.
** A make-up robot is a device that is capable of automatically stacking pieces of luggage that sequentially
1.4
Research goal
Based on the problem chart (see Figure 1), we formulate the following research goal:
Reducing temporal and financial efforts of Vanderlande Industries with regards to the current-ly applied calibration procedure of major projects, focusing upon high level system behavior through identifying system performance deviations and their calibration optimization
There is a need for a systematic approach that reduces efforts spent during the “realize on-site” phase (Vanderlande Industries B.V., 2012f) – which includes lead-time reduction. The main focus is put on “high-level” system behavior, which refers to in the logistical process layer of a system, excluding the embedded controls and hardware components. Those are part of the low level system management.
1.5
Problem statement
From the prior-mentioned research goal, we derive the following problem statement:
How can a structured methodology be applied to the calibration process within Vanderlande Industries so that it is capable of identifying, measuring, and minimizing performance differ-ences among subsequent system models and practice automatically in a computationally inex-pensive manner?
Especially, we focus on the incorporation of feedback from later project phases and its integration into system models of earlier process stages. The identification and optimization of deviations between the simulated and the implemented system stands central.
1.6
Research questions
To answer the problem statement, we have to formulate several research questions. The chapter structure of this thesis follows the order of the research questions below, since, overall, the answer of a prior question delivers the input that is necessary to answer its successor.
Q1: What is the current calibration process for baggage batching at Vanderlande Industries?
a. What are the Key Performance Indicators (KPIs) that are relevant for calibration?
b. How is parameter calibration currently executed?
First, we assess the current situation regarding calibration of the baggage batching process. The goal of an-swering this question is to determine the gap between the current and the desired situation. Also, we try to discover important key performance indicators for later calibration.
Q2: What is currently known in the literature about automated model calibration?
a. What are suitable practices to identify relevant deviations between simulated
and real systems?
b. What optimization methods are appropriate for minimizing output deviations
between simulated and real systems incurring distinct sets of tunable parame-ters under the condition of identical input?
Q3: What suitable calibration methodologies can be developed from the practices known in the literature to fit the problem at hand?
After the revision of all relevant literature and proven techniques in the field of automated model calibration, we develop a calibration approach suitable for the baggage batching procedure that is implemented at Schiphol South terminal.
Q4: How well does the developed calibration method perform in a representative test case?
We test the proposed calibration methodology suitable test cases. Moreover, we assess whether and how the anticipated calibration procedure achieves its indented purpose of adequately matching model and system performance.
1.7
Contributions
Chapter 2:
Problem analysis
We outline the problem context in this chapter. This includes that we describe the organization Vanderlande Industries B.V. briefly (Section 2.1), as well as the baggage handling integration group, which is the research host. Subsequently, we elaborate on the current problem situation (Section 2.2) and the baggage batching process (Section 2.3) in detail. Thereafter, we present our view on the desired situation (Section 2.4) and con-clude essential findings of this chapter in a brief discussion (Section 2.5).
2.1
Vanderlande Industries B.V.
In the next paragraphs, we introduce Vanderlande Industries, headquartered in Veghel, The Netherlands. Af-terwards, we give some insights about the Major Projects Baggage Handling Systems division and relevant processes.
Public perception
Vanderlande Industries B.V. is a large mechanical engineering corporation that is specialized in manufacturing automation solutions for warehouse, parcel and postal automation, as well as sophisticated baggage handling systems for small and large airports. The contemporary departmental structure of the company can be found in Appendix A1. Currently, Vanderlande employs 2,300 people worldwide (Vanderlande Industries B.V., 2012a). Even though the company is headquartered in the Netherlands, it has stationed customer centers around the globe to provide fast hands-on service.
Project management
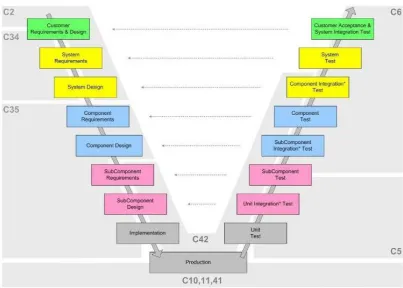
[image:16.595.96.500.465.753.2]The work that is done within Vanderlande Industries is mainly based on unique projects, which urges the or-ganization to be highly flexible with respect to its resources. Figure 2 depicts the main process steps of an arbi-trary project within Vanderlande Industries.
After a successful sales phase, project management at Vanderlande occurs in several phases. This phase divi-sion is derived from the “engineering V-model” (see Figure 2) that is often used in iterative technical processes. The V-model thus actually implies the existence and usage of feedback loops throughout the entire project process – however this is not self-evident for all involved processes during the engineering and implementa-tion. In general, a divisional structure works well if transition of knowledge is done systematically and stand-ardized – however that is not always the case in practice. Unintentionally, mistakes often happen in this kind of transition. Here the main issue seems to be that distinct functional groups with their own internal goals and mindsets are working on an evolving product, which impedes the avoidance of “hand-over errors” and the gain of knowledge throughout the course of time – in this case we consider the evolution from simulation models to low and high level emulations towards the actual system integration on-site.
Research-relevant processes & Definitions
In order to clarify what knowledge transitions comprise, Figure 3 visualizes the detailed test process flow in the development and implementation phase of a baggage handling system.
After knowing the basic requirements of a baggage handling system, the simulation group can start to build a simulation model, which considers the rough system layout and the adherence of minimum capacities (see the first two left-hand blocks in Figure 2). The basic requirements, as well as the simulation model and outcomes, are saved in a Project Definition file (PD file).
When lower level emulations are finished successfully, the tested components are again emulated, respective-ly “imitated”, at the overall system level (see the blocks “Component Test”, “Component Integration Test” and “System Test” in Figure 2). This is done for the testing of the logical layer of the baggage handling system, as e.g., the process step controller or the routing controller.
This logical layer has two inputs: the imitated technical component behavior, which is also referred as “PLC stubs”, and the rough-cut model from the simulation, which is extracted from the Project Definition file. This assessment level is critical, since here the main preparations regarding the on-site flow tests are considered and finally defined.
Figure 3: Engineering and implementation phases of major projects
Simulation
(Capacities & rough-cut system behavior)
Low level emulation
(Testing of PLCs)
High level emulation
(Testing of logical software layer)
On-site integration
(Capacity testing)
followed by
followed by
integrated into (behavior only)
followed by
Knowing requirements
While the logical layer is tested in-house, the hardware components are put into place on-site. Then, software and related updates are installed. Now the most difficult part of the implementation phase starts, the actual configuration of the overall system behavior. This normally consumes a lot of time and financial efforts – partly due to the fact that the installment of the final system is performed mostly during running airport operations. This issue makes a trial-and-error testing approach uncomfortable. Thus, towards the end of a project, many testing activities are re-located from in-house to on-site setups. The main activities in that respect are baggage flow tests, where the achievement of certain capacities and other objectives is evaluated in a pass-or-fail fash-ion. If these tests are conducted successfully, the project development and implementation phase finishes and the project is delivered to the customer. Thus, there exists an issue on how to improve the described multi-stage process transition, so that the efforts eventually spent on-site are minimized.
2.2
Current situation
Now we elaborate on the current situation regarding the calibration of the baggage batching process at Schiphol South terminal. By doing this, we intend primarily to answer research question Q1.
Current calibration practice
We notice from earlier company internal studies (Lith et al., 2012, Thoonen et al., 2012) and from several in-terviews with personnel involved in system implementation that, e.g., the 70MB†† and similar projects struggle with deadline compliance due to a lack of fast and successful calibration attempts. This issue occurs often in the transition from simulation towards high level emulation and later on again in the transition from high level emulation to on-site integration. Therefore, the actual implementation phase is lengthened unnecessarily. We suspect that this fact is caused by the lack of information feedback loops after the design phase of an arbitrary project (see Figure 4), as well as by difficulties in the comparison of system models on a multi-dimensional level which includes distinct sets of tunable parameters. This is due to issues in the identification and assessment of deviations in system performances, which normally accumulate throughout the development phases. Thus, a methodology that can clarify these differences between anticipated and realized system behavior, and that furthermore can minimize those deviations is necessary.
As outlined before, Vanderlande Industries follows specific project development and implementation guide-lines. The central project flow is surrounded by existing, as well as non-existing feedback loops. However, a substantial amount of “translation errors” is likely to occur during the process of information transfer. Since this transfer happens many times throughout an arbitrary project, the amount of errors accumulate “down-stream” in identification of high-level system performance deviations and their calibration optimization time – if no intervention is performed. Initially, this is the reason why feedback loops are installed within an imple-mentation procedure so that useful intermediate outcomes of earlier project phases are adapted with the knowledge gained in later stages. This should prevent that mistakes are passed on to later project phases where they become increasingly costly to be fixed.
Vanderlande Industries already tries to establish feedback loops between subsequent project phases. However these endeavors partially remained uncompleted. Most systematic feedback loops exist currently between simulation modeling and the required fit of the system buyers and, additionally, for the overall project evalua-tion. However, the feedback loops between simulation and low / high level emulation, between both types of emulation models, between emulation and on-site integration and, finally, between simulation and on-site integration are still not a practiced standard (see Figure 4).
††
We argue that the inclusion of such additional information loops by the means of a smart calibration method-ology will decrease the system deviations, which accumulate throughout the delivery of several model ver-sions. This can have added value for a reduction of lead-time – from which mainly the integration group would benefit, since on-site implementation and testing is one of its core responsibilities. In general, the project prin-cipal has a kind of calibration method in mind that functions as a tool that can detect inconsistencies of algo-rithm behavior and adapts these to a minimum. Thus, it is important to not just recognize where deviations occur, but also, in particular, how to minimize those deviations effectively.
Figure 4: Feedback loops within Vanderlande
P ro je ct in it ia ti o n : St ip u la ti o n o f re q u ir em en ts & c o n st ra in ts Sy st e m d e si gn p h as e : Si m u la ti o n o f an ti ci p at ed sy st em In te rn al t e st in g p h as e 1 : Lo w le ve l e m u la ti o n o f cr it ic al s ys te m co m p o n en ts (h ar d w ar e & s o ft w ar e) Im p le m e n ta ti o n p h as e : Te st in g & re al iz at io n o f sy st em o n -s it e Ev al u at io n p h as e : R ec ap o f fl aw s & q u al it ie s o f th e p ro je ct e xe cu ti o n 3
rd f
e e d b ac k lo o p : Fe ed b ac k o f in co n si st en ci es d u ri n g Lo w le ve l em u la ti o n 4
th f
e e d b ac k lo o p : Fe ed b ac k o f in co n si st en ci es d u ri n g in te gr at io n o f LL a n d H L em u la ti o n 5 th f e e d b ac k lo o p : Fe ed b ac k o f in co n si st en ci es d u ri n g th e o n -s it e re al iz at io n 1
st f
e e d b ac k lo o p : Fe ed b ac k o f in co n si st en ci es d u ri n g si m u la ti o n p ro ce d u re Ex is ti n g N o n -e xi st in g In te rn al t e st in g p h as e 2 : H ig h le ve l e m u la ti o n o f Sy st em lo gi c (I n te gr at io n o f LL em u la ti o n o ve ra rc h in g so ft w ar e) 2 n
d f
2.3
Baggage batching
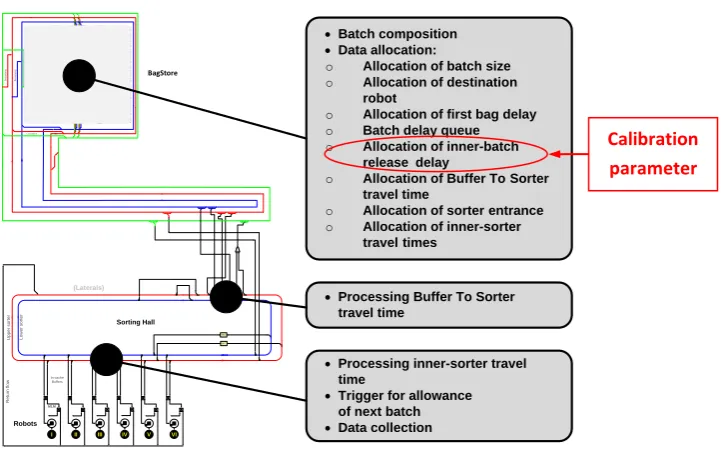
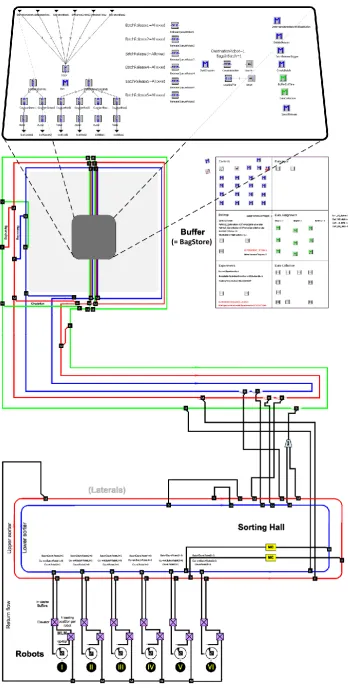
We focus on the calibration feedback loop between implemented system and a high abstraction simulation model of the baggage batching process at the Schiphol South terminal. Figure 5 shows the functional layout of the batching environment (Vanderlande Industries B.V., 2012d). Explanations follow in Section 2.3.1.
Figure 5: Operational layout of the baggage batching process Sorting Hall
M
erg
e
M
erg
e
M
erg
e
M
erg
e
M
erg
e
M
erg
e
Circulation
M
e
rg
e
MC
M
e
rg
e
M
e
rg
e
M
erg
e
M
erg
e
M
erg
e
M
erg
e
M
erg
e
M
erg
e
M
erg
e
L
in
e
b
a
la
n
c
in
g
So
rt
M
e
rg
e
M
erg
e
M
e
rg
e
M
e
rg
e
In-cache lines
1 loading position per robot
U
p
p
e
r
s
o
rt
e
r
L
o
w
e
r
s
o
rt
e
r
Elevator
‘op-top’ MLM
M
erg
e
M
e
rg
e
LML
Robots
(automatic handling)
Laterals
(manual handling)
I
20 19 18 17 16 15
II III IV V VI
14 13 12 11 10 Return flow
L
in
e
B
a
la
n
c
in
g
2
1 3 4 5 6 7 8
9
MC Buffer
(BagStore)
21 22
Manual coding
Schiphol
South Terminal
3 redundant transport lines
L
in
e
B
a
la
n
c
in
g
Tubtrax®
system
2.3.1
Batching process implementation in practice
Prior to the batching process, early check-in of pieces of luggage are stored in the BagStore, which can be un-derstood as a large baggage buffer. In case a flight schedule demands that bags are batched from this buffer, the designated make-up robots need to have a load unit available (normally an airplane container) to finally comply to the flight schedule request for initiating a batch. However, also a couple of other system compo-nents are involved in this process. If all of those sub systems comply to the batch request, the actual batching and transport process can start. The real baggage batching process strongly relates to the simulated process. However, due to the adaptations throughout the course of project implementation a couple of differences are incorporated in the algorithms used. We outline the practice of the on-site baggage batching in the following paragraphs. As a visualization help on the system components, we refer to Figure 6.
Figure 6: Illustration of several components of the baggage handling system at Schiphol South Terminal
Process description
BatchStatus Update
Batch Composition Manager BatchTask
List
Batch Command
TaskReport TaskReport
TaskInstruction TaskInstruction
Batch Overview
Report Batch
Overview
Request Batch
Instruction Batch
Bag Instruction
Batch Transport
Report
Batch Profile Report Process Control
Logistics Manager
Package Destination
Manager
Robot BaggageEvent
Load Unit Management
LU_Request
LU_Response
Figure 7: Software application environment of baggage batching by Van der Meulen (2010)
As we can see above, the decision making process on baggage batching is rather complex. The package desti-nation manager is the first entity that requests the initiation of batches, since it is directly linked to the infor-mation from the flight schedule. If this request has entered the BCM, the Robot has to be verified as ready for batching – also a load unit has to be connected to it. Then, a batch can be released and the Logistic Manager takes over to guide the bags within a batch throughout the inter-connected transport lines at the Schiphol South terminal. Figure 8 roughly shows how the baggage batching process is executed in practice.
Create Batch Job
Compose Batch Job
Released batch Batch
Created batch LU_Response
Composed batch Trigger from
previous batch
Mech. Loaded
batch
TopUp Loaded
batch TaskInstruction
Batch
Non batch Task Instruction OR
-Monitor LU Response
Job
Release Batch Job Release Batch Job Release Batch Job
BatchCommand Cancel
Monitor ghost batch
Job BaggageEvent RegionException
TaskReport Lost tracking BaggageEvent
BaggageEvent TaskReport BatchInstruction BatchBagInstruction
Figure 9: Batch release by subgroups, taken from Van der Meulen (2010)
An important aspect of the implemented batching process is the division and release of sub-groups of a batch. In Figure 9 we illustrate the splitting of a load unit (LU), which is normally an airplane container (upper trape-zoid-like shape). The LU is filled with up to four different types of luggage. This subgroup division is done by the criteria baggage weight and volume. The bag selection algorithm applied to determine the right composi-tion of bags within each subgroups is based on the idea of the Simulated Annealing algorithm (Kirkpatrick et al., 1983). The main features per subgroup are shown in Table 1.
Table 1: Subgroup division and planned start and release delays, taken from van der Meulen (2010)
Subgroup Description Aim Processing
sequence
Release sequence
A Most light, ordered by volume (descending)
The most light bags at the top. These bags can be loaded manually.
1 4
B Remaining ordered by volume (descending)
The remaining bags. The bags which are not selected by filter A, D or C.
4 3
C Most heavy, ordered by weight (descending)
The most heavy bags on top of a
smooth layer 3 2
D Average height, ordered by weight (descending)
A smooth layer of bags of average height on the bottom, the most heavy bags at the bottom
2 1
For further reference, the detailed control and component environment the batching process is embedded into can be found in Appendix A4. In addition, the detailed physical progression of the on-site implemented batching process can be viewed in Appendix A5.
2.3.2
Abstraction deviations of the batching process in practice and simulation
One of the reasons why calibration is a non-trivial endeavor, is the difference in abstraction that is incorpo-rated in later process stages in comparison to the initial simulation setup. We outline these deviations briefly. The detailed simulation setup of the BagStore and the connected baggage batching process at Schiphol South are specified in McMenamin and de Jongh (2006) and related documents, as e.g., in Thoonen et al. (2012).
Process description of baggage batching in simulation
Baggage batching starts after the storage of early checked-in bags based on available flight load files provided by the system buyer. Checked-in bags are divided into various categories from which only “Buffer bags” and “Batch bags” are eligible for batching. The difference among these two types is that the “Batch bags” are des-ignated for the batching by make-up robots, while “Buffer bags” are batch-wise sent to laterals where they are loaded manually. Other types of bags, such as oversized bags or those lost in tracking, are also considered in the simulation, but they do not play a significant role for the baggage batching procedure itself.
All in all, the simulated batching process appears to be similar to the implemented one, but, for instance, the subgroup division of batches is not considered. Furthermore, only automatic batching is possible, while in the practice application also operators can chose to handle batches manually or even in a semi-automatic manner. Measurements of volume and weight are also not taken into account.
Summary key differences in abstraction level
The main differences basically are that in the simulated system no subgroup processing is taken into account and that batch releases are only steered automatically. Also bag attributes such as dimensions and weight are not considered for the performance in the simulation model. For more details about this aspect, a summariz-ing graph of these deviations can be found in Appendix A8.
2.4
Desired situation
We strive to develop a calibration method that enables us to incorporate feedback information from the real-ized system quickly into a simplified simulation model that is based on a rather high abstraction level. Thus a simulation does not have all the options included that are available in later stages. Nevertheless, we believe that such a simulation can be tuned towards realistic behavior with benchmark information from the imple-mented system. Of course, often surrogates or combination parameters have to be used in that kind of simula-tion to approach the anticipated behavior as close as possible.
2.5
Discussion
Chapter 3:
Literature review
In this chapter, we discuss relevant literature for our research project and related works in the field of auto-matic calibration. In Section 3.1 we make a distinction between the definitions of verification, validation and calibration. Later on we explain how model deviations in comparison to benchmark data are in fact measured (Section 3.2) and which solution concepts exist for calibration (Section 3.3). Then we elucidate common math-ematical problem formulations for calibration (Section 3.4) and, later, show distinguishing features of manual, semi-automatic (Section 3.5) and automatic calibration approaches (Section 3.6). We further explain optimiza-tion schemes that exist to decrease deviaoptimiza-tions between models and benchmark data (Secoptimiza-tion 3.7). We then elaborate on the importance of sensitivity analysis for calibration modeling (Section 3.8) and conclude this chapter with a short discussion (Section 3.9) on essential findings in the literature that we incorporate into our research.
3.1
Distinction between model verification, validation and calibration
To create a realistic (simulation) model, Law (2007) suggests the use of the concepts “verification” and “valida-tion”, which he put into a linear order. By executing such a sequence correctly, the model can gain “credibil-ity”. Mazzotti and Vinci (2007) points out that validation and calibration are essential processes for the crea-tion of reliable models. Li et al. (2008) and Madsen (2003) state that validation and calibration are recurrent and thus iterative problems, which are seldom solved in a linear way. Since there exist different views on how to create realistic models, we first review the basic ideas behind verification, validation and calibration and how these approaches are related with each other. There exist many works which can be used as an in-depth reference about issues concerning verification and validation.‡‡
Verification is the process of ensuring that the computer program of the planned model and its implementa-tion are done correctly (Sargent, 2008, Schelsinger et al., 1979) or, according to Law (2007), that the assump-tions document of the concept model is correctly translated into a computer program – which related to de-bugging the simulation program. Thus with verification, mainly the technical realization of the model is put central. This does not include any attempt yet to assess whether the implemented process matches with the one from practice.
Validation, on the other hand, is defined by Law (2007) and Fishman and Kiviat (1968) as the process of deter-mining whether a simulation model is an accurate representation of the real system, to achieve particular objectives of a study. The difference between validation and calibration is that validation has the objective to confirm whether the computer model precisely represents the real process for a couple of critical instances, while calibration aims to adjust the unknown input parameters by comparing the computer model output with the real observed data (Yuan and Szu Hui, 2013). Additional information about the relationship between vali-dation and calibration can be found in Oberkampf and Roy (2010) and the references therein.
Regarding model calibration, several definitions exist in the literature. Li et al. (2010) and Van Griensven and Bauwens (2005) define it as the process of adjusting parameters until model outputs are sufficiently similar to observed values. Rykiel (1996) states similarly that calibration is the adjustment of parameters and constants to improve a model towards reality. In this respect, it is important to mention that the input parameters that are used for calibration are more conceptual. Thus often they cannot be determined directly from data (Bekele and Nicklow, 2007, Madsen, 2003). Generally, one looks at the tuning of ”unobservable parameters” that are
‡‡ For example, Balci (1998), Banks et al. (2005), Carson (1986, 2002), Feltner and Weiner (1985), Law (2005,
critical for the matching for the model performance to empirical data (Vanni et al., 2010, Weinstein, 2006). Also the calibration of assumptions is suitable for calibration (Vanni et al., 2010). The initial goal of calibration is to find an optimal, and thus an unique setting, of the parameters that are calibrated, which maximizes the fit between the model and the actual system (Moore and Doherty, 2006). However, this goal of a unique optimal setting for parameter values comes with an important trade-off, which we discus later in this chapter.
3.2
Deviation measurements for calibration
There are various reasons known for the deviation of model output in comparison to actual data measure-ments. Madsen (2000) mentions the most prominent of them:
(1) Errors in input data.
(2) Errors in recorded observations: Experimental results could be wrong due to set-up, process, or measurement errors (Byers et al., 2002)
(3) Errors and simplifications inherent in the model structure, that do not adequately describe physical realities (Byers et al., 2002)
(4) Errors due to the use of non-optimal parameter values.
In model calibration, only error source (4) should be minimized. However, the calibration of model parameters in general can compensate for the other error sources as well (Madsen, 2000). Beck (1991) concludes, that a calibrated model incurs collected knowledge about the system studied. Therefore, calibration does not only aim to find parameter settings that minimizes a given objective function. This is not an easy task since the models are frequently nonlinear (Kuczera (1997). Calibration also aims for reduction of uncertainties of pa-rameter values (Gaume et al., 1998). The need and the importance of calibration is recognized in many practi-cal models, e.g., nuclear radiation release (Kennedy and O’Hagan, 2001), hydrologic (Kanso et al., 2006), and biological models (Henderson et al., 2009), as is stated by Yuan and Szu Hui (2013). Similarly to Vanderlande Industries, the “predictive accuracy” (Campbell, 2006) of the models is essential. Furthermore, the use of cali-bration is valuable in other ways as well, e.g., the reusability of large-scale simulations for changing simulated environments (Huang et al., 2010). In that case calibration can be used as a sort of “feedback loop” (Campbell, 2006) that adapts simulation parameters to the new situation. As a benefit, temporal and financial efforts for simulations remain limited in comparison the initiation of entirely new modeling projects. Vanni et al. (2010) give another advantage of using model calibration to estimate the parameters of the model, the estimation process will induce correlation between the parameter estimates – this can be particularly useful if the correla-tion among parameters is not known yet and if this is up for identificacorrela-tion. This can be interesting for situacorrela-tions where non-linearity among parameters plays a significant role. However, other researches argue that correla-tion should be assessed in advance to any calibracorrela-tion attempt as much as possible by a thorough sensitivity analysis (Skahill and Doherty, 2006). Systematic methods on the conduction of such a sensitivity analysis are described later in this chapter.
How to compare outcome deviations of models and the real system
model is exposed to exactly the same input as the real system, such that output variance that is caused by randomness incurred in the data input is minimized as much as possible.
Several techniques to assess the goodness-of-fit between two sample data series exist. A subjective, but fast, manner of assessing the goodness-of-fit between a model and the actual system is the use of a Turing test (Kleijnen, 1995, Sargent, 1996). Here, a model receives “face validity” if experts perceive its results congruent with the actual system behavior (Law, 2007).
Graphical techniques to compare data samples are also useful and comprehensive to visually explore the ob-tained and comparison data and to search for differences among it (Balci, 1998, Montgomery and Runger, 2002). Furthermore, statistical methods and derived aggregation methods are used in practice. Graphical methods which are commonly known are histograms, density plots, and divers frequency comparisons (Sargent, 1996). Furthermore, also graphical comparison methods are used that rely on the visualization of cumulative distribution functions instead of the density distribution function, such as the Distribution-Function-Differences plot (Law, 2007). The main disadvantage of those techniques is, however, that they are not reliable as indicators for the distribution observed, unless the sample size that is used as a comparison base is large enough (Law, 2007). Moreover, a couple of other plots are available from the literature that am-plify the differences among distinct distributions, e.g., the Q-Q plot and the P-P plot (Gibbons and Chakraborti, 2003, Law, 2007).
Next to graphical methods, there are also numerous statistical data comparison methods known in the litera-ture, which, to a vast extent, we can find in the works of Balci (1998), Janssen and Heuberger (1995), Law (2007). Comparing the outcome means of two samples can be done with a two sample t-test, as for instance in Kong et al. (2009). Such a t-test can be divided into an independent test or a paired test (Larsen and Marx, 2006, Law, 2007). According to Larsen and Marx (2006), it can be more suitable to use the paired test over the independent test for parameter estimation. In the case of calibration, where the same input is used in both the real system and the model, observations can be paired per input instance. One of the most common and gen-eral statistical tests used to compare observed and expected data points is Pearson’s chi-square test (Pearson, 1900). The chi-square test compares frequency counts of histogram intervals. Law (2007) states that this test is useful for small and mid-scale sample sizes. However, when the number of observations becomes large, the chi-square test almost always rejects (Gibbons, 1985). This is due to the fact that normally variance is de-creased when the number of experimental trials increase, thus the confidence intervals of the model and the system output shrink as well. As a result, model and expected output “intersects” less, and the chi-square statistic rejects the null-hypothesis. The chi-square test, similar to the Anderson-Darling test, mainly focuses on the tail differences of the compared distributions (Law, 2007).
Another approach to assess the matching potential of data series is the Kolmogorov–Smirnov test (“K-S test”) developed by Kolmogorov (1933) and Smirnov (1948). The K-S test does not compare histograms such as the chi-square test, but the maximum distance between the cumulative distribution functions of the empirical and the hypothesized observations (Law, 2007). According to Stephens (1974), the K-S test is more powerful than the chi-square test, since the significance of the test statistic is independent of the sample size. Also the K-S test focuses more on the deviations in the middle of the distributions and less on those detected in the tails (Law, 2007).
There are some difficulties connected to statistical, respectively time series, techniques. Normally, it must be assumed that the assessment data is stationary. In a stationary process, the mean, the variance and the relat-ed auto-correlation is stable over time. As a consequence, conclusions drawn from these test can be invalid, if the conditions connected to auto-correlation and stationarity are not satisfied. However, if this assumption is categorically disqualified, only the graphical methods can be used to judge the fit of the observed and the expected values (Law, 2007).
Other test statistics that are common as objective functions in calibration studies are the Mean Absolute Error (MAE), the Mean Squared Error (MSE), the Root Mean Square Error (RMSE), the Mean Percentage Error (MPE), deviation coefficients, such as the Nash–Sutcliffe efficiency coefficient (NSE) or the log-transformation error (Yu and Yang, 2000). The formula of the RSME is depicted below:
, (1)
where is the total amount of observations and is an individual observation. “ ” refers to the out-put retrieved from the simulation model, while “ ” stands for the benchmark measure taken from a later model version or, even better, from practice.
The MSE, as well as the RMSE and the MPE, are linear scores that incur that all measured differences are equally weighted based on the total number of measurements (Hyndman and Koehler, 2006). Frequently ap-plied comparison functions in the field of automatic calibration are the MSE§§ and the RSME*** (Yu and Yang, 2000).
All of the above-mentioned objective functions are a good measure of accuracy, but only to compare forecast-ing errors of different models for a particular variable and not between variables, as it is scale-dependent (Hyndman and Koehler, 2006). Furthermore, they are error aggregations that give the errors in prediction a single measurement of predictive power. The RSME and MSE in comparison to the MAE attach a relatively big weight to errors of large magnitude. This is due to the fact that the error term is squared before the average is taken. In conclusion, MSE and RMSE are powerful if large errors are avoided in a model. This is probably one of the main reasons why RSME and MSE are often chosen for in the field of automatic calibration. In particular the RSME is useful, since it presents the statistical error in the same unit as the initial Key Performance Indica-tor (KPI) and therefore, can be interpreted as the extent of a “typical” error made by the model (Hyndman and Koehler, 2006).
3.3
Concepts of model calibration
Model calibration in general can be divided single and multivariate calibration, which considers the handling of one or several matching objectives. Furthermore a division can be made into three different calibration ap-proaches: manual, semi-automatic and automatic. At first the typology based on the amount of matching ob-jectives is elucidated; thereafter the implications due to the degree of automation are explained.
§§
For example, Chiu et al. (2010), Gupta et al. (2009), Ito et al. (2010), Kong et al. (2009), Moussu et al. (2011), Pokhrel et al. (2012), Rode et al. (2007), Yum and Lee (1991)
*** For example, Bekele and Nicklow (2007), Graefe et al. (2005), Liu and Liu (2011), Liu and Sun (2010),
Single- and multivariate calibration
In model calibration, one can try to match the value of a single goodness-of-fit objective function, which is called single-variate or single-objective calibration. Alternatively, it can be aimed to match several objective functions to comparison data, which is then called multivariate calibration (Gupta et al., 1998).
In the literature, various examples of single-objective calibration can be found, e.g., in Bendall and Skinner (1998), Jagner et al. (1993) and Nash and Sutcliffe (1970). The advantages of performing single objective cali-bration are obvious: it is relatively easy to implement a single measure comparison to an existing model and it is quite explicit about the found near-optimal value, since there are no trade-offs involved that are due to conflicting goodness-of-fit objective functions (Madsen, 2003). On the contrary, single-objective calibration incurs explicit drawbacks: Li et al. (2010), Liu and Sun (2010), Madsen (2000), Yapo et al. (1998) conclude that any single-objective function, no matter how carefully chosen, may not adequately measure the ways in which a model fails to match the important characteristics of the observed data. This ultimately led to the recent focus on multivariate calibration approaches. Also, there are doubts about the uniqueness of optimal parame-ter settings that can be found by a calibration procedure as insinuated earlier in this chapparame-ter. Moore and Doherty (2006) already stated that no matter which regularization methodology is employed, the inevitable consequence of its use is a loss of detail in the calibrated field. It is likely that no unique set of parameter val-ues exists that generates a significantly good fit of the model and the system for every possible system scenar-io. To avoid this, the optimization problem can be formulated as a multi-objective calibration problem that tries to fit a near optimal Pareto front of solutions (Moore and Doherty, 2006).
With regards to multivariate calibration, many example studies††† are available as well. The works of Gupta et al. (1998) and Yapo et al. (1998) and their consideration for multi-objective model matching shifted the focus for calibration in the hydrologist field of science, where a vast amount of automatic calibration approaches had been studied so far. Multivariate calibration has a number of advantages above single-objective calibration that are discussed in several publications:
Multiple criteria can be accommodated in a representative way (Geng et al., 2011).
Instead of giving a single ‘optimum’ design, which may not provide a good balance between multiple criteria, multi-objective methods lead to a set of designs that are diverse and non-dominated to each other. Thus, a set of optimum designs in the Pareto sense can be generated (Geng et al., 2011).
It allows for simultaneous optimization of even conflicting goodness-of-fit objectives (Madsen, 2003).
In most cases the simultaneous use of more than one model output variable can improve ‘parameter identifiability’” (Gupta et al., 1998).
Nevertheless, multivariate calibration also has several shortcomings:
Up to now, multiple objective heuristics are hard to solve in a reasonable amount of time due to the enormous dimensions of solution space. Therefore, most of the studies that consider multivariate cal-ibration approaches only include up to two goodness-of-fit objectives (Geng et al., 2011).
Higher dimensional objective calibration is hard to display comprehensively in a graphically way (Geng
et al., 2011).
It is more complex to implement than single-objective heuristics (Abraham and Goldberg, 2005). Ag-gregation approaches to combine multiple objectives into a single-variate heuristics, such as in Kong
et al. (2009), or pure single-objective calibration are a less complex alternative (Geng et al., 2011).
††† Bekele and Nicklow (2007), Li et al. (2010), Liu (2009), Madsen (2000, 2003), Moussu et al. (2011), Paulo et