ENVIRONMENTAL SENSITIVITY INDEX MAPPING OF CARBON STEEL CORROSION IN NDONI
RIVER, AHOADA RIVER, NEW CALABAR RIVER, TOMBIA RIVER, BUGUMA RIVER
*Ugboma C.J. and
Department of Microbiology Rivers State Univer
ARTICLE INFO ABSTRACT
Industrialization and modernization has led to high demand of energy resources thereby increasing the transportation and demand of crude oil and its products via different types of steel products which are prone to wear and tear leading to spillages of all forms in marine, brackish and fresh water habitats. This study is aimed at creating an environme
shorelines of Ndoni river, Ahoada river, New Calabar river, Tombia river, Buguma river and Bonny estuary as well as determine corrosion rates of carbon steel coupons on these shorelines. Different methods of shoreli
Atmospheric Administration (NOAA) and Nigeria Oil Producing Trade Sector (OPTS). A total of eight ESI types were found in the area and they include 1b, 3a, 4a, 6b, 9b, 9c, 1
prevalent faunas found in these shorelines include crocodile, iguana, sea turtle, jellyfish, tilapia, frog, snail, toad, white crab, shorebirds, earthworm and millipede. Spearman`s correlation coefficient (r) value of 0.93 was the resu
biological species along the shorelines. The corrosion rates of the carbon steel coupons in the various shorelines of Ndoni river, Ahoada river, New Calabar river, Tombia river, Buguma
estuary are 44.068g/yr, 69.912g/yr, 72.435g/yr, 86.559g/yr. 119.420g/yr and 191.591g/yr respectively. The carbon coupons had lower corrosion rates in freshwater habitats followed by brackishwater habitats and highest in the estuarine habit
quick reference point for oil spill responders as well as integral component of oil spill contingency planning, corrosion monitoring and decision making on type of steel to use on these various habitats.
Copyright © 2018, Ugboma and Ndubuisi-Nnaji. This unrestricted use, distribution, and reproduction in any medium,
INTRODUCTION
Environmental sensitivity index mapping is a method which provides a concise summary of coastal resources that are at risk if any oil spill occurs. According to NOAA (2008), these areas could be sensitive to development based on environmental and cultural assets present. Some of the risk resources include biological resources, sensitive shorelines and human use resources. The mapping of the sensitivit
environment to oil pollution is an essential step in oil pollution preparedness, response and cooperation efforts and these maps are crucial tools to assist responders during an incident (IPIECA/IMO/OGP, 2012). The work of Guam (2006) stated that ESI mapping could be used both to aid and explain decision making in consultation process. It could also serve as a quick reference for oil spill responders and coastal zone
*Corresponding author:Ugboma C.J.,
Department of Microbiology Rivers State Un Oroworukwo, Nigeria
ISSN: 0975-833X
Article History:
Received 20th February, 2018 Received in revised form 23rd March, 2018 Accepted 26th April, 2018 Published online 31st May, 2018
Citation: Ugboma C.J. and Ndubuisi-Nnaji U.U. 201
new calabar river, tombia river, buguma river and bonny estuary Key words:
Carbon Steel, Shoreline, Estuarine, Brackishwater, Freshwater, Corrosion.
RESEARCH ARTICLE
ENVIRONMENTAL SENSITIVITY INDEX MAPPING OF CARBON STEEL CORROSION IN NDONI
RIVER, AHOADA RIVER, NEW CALABAR RIVER, TOMBIA RIVER, BUGUMA RIVER
AND BONNY ESTUARY
Ugboma C.J. and Ndubuisi-Nnaji U.U.
Department of Microbiology Rivers State University Npolu- Oroworukwo, Nigeria
ABSTRACT
Industrialization and modernization has led to high demand of energy resources thereby increasing the transportation and demand of crude oil and its products via different types of steel products which are prone to wear and tear leading to spillages of all forms in marine, brackish and fresh water habitats. This study is aimed at creating an environmental analysis index corrosion map of the shorelines of Ndoni river, Ahoada river, New Calabar river, Tombia river, Buguma river and Bonny estuary as well as determine corrosion rates of carbon steel coupons on these shorelines. Different methods of shoreline sensitivity were used in this study which includes that of National Oceanic and Atmospheric Administration (NOAA) and Nigeria Oil Producing Trade Sector (OPTS). A total of eight ESI types were found in the area and they include 1b, 3a, 4a, 6b, 9b, 9c, 1
prevalent faunas found in these shorelines include crocodile, iguana, sea turtle, jellyfish, tilapia, frog, snail, toad, white crab, shorebirds, earthworm and millipede. Spearman`s correlation coefficient (r) value of 0.93 was the result of the relationship between the number of socioeconomic features and biological species along the shorelines. The corrosion rates of the carbon steel coupons in the various shorelines of Ndoni river, Ahoada river, New Calabar river, Tombia river, Buguma
estuary are 44.068g/yr, 69.912g/yr, 72.435g/yr, 86.559g/yr. 119.420g/yr and 191.591g/yr respectively. The carbon coupons had lower corrosion rates in freshwater habitats followed by brackishwater habitats and highest in the estuarine habitat. Results from this study can serve as a quick reference point for oil spill responders as well as integral component of oil spill contingency planning, corrosion monitoring and decision making on type of steel to use on these various habitats.
This is an open access article distributed under the Creative Commons medium, provided the original work is properly cited.
Environmental sensitivity index mapping is a method which provides a concise summary of coastal resources that are at According to NOAA (2008), these areas could be sensitive to development based on environmental and cultural assets present. Some of the risk resources include biological resources, sensitive shorelines and The mapping of the sensitivity of the environment to oil pollution is an essential step in oil pollution preparedness, response and cooperation efforts and these maps are crucial tools to assist responders during an incident The work of Guam (2006) stated ESI mapping could be used both to aid and explain decision making in consultation process. It could also serve as a quick reference for oil spill responders and coastal zone
Department of Microbiology Rivers State University Npolu-
managers in identifying vulnerable coastal locations establish protection priorities and identify clean up strategies (ESI map 2010, NOAA 2010). Oyedepo and Adeofun (2011) reported that shorelines are ranked on the sca
(1) show the minimum vulnerability and ten (10) maximum vulnerability in case of an oil spill. Another useful method which has been used to describe and evaluate the coastline is IMO/MEPC, 2006 method for ranking of sensitivity c
areas. This method has been widely used in Iranian coastlines mostly for identification and ranking of protected areas (Rouzbehi, 2009).Three information are gotten from an ESI map if an oil spill occurs they include
Human use resources which in
recreational areas, protected beaches, archeological or cultural resources and natural reserves or marine sanctuaries.
Shoreline habitats. According to Gundlach and Hayes (1978) these are classified by rank depending on how easy the garet would be to clean up, how long the oil
International Journal of Current Research Vol. 10, Issue, 05, pp.69703-69711, May, 2018
2018. “Environmental sensitivity index mapping of carbon steel corrosion in ndoni river, ahoada river, new calabar river, tombia river, buguma river and bonny estuary”, International Journal of Current Research, 10, (05), 69703
ENVIRONMENTAL SENSITIVITY INDEX MAPPING OF CARBON STEEL CORROSION IN NDONI
RIVER, AHOADA RIVER, NEW CALABAR RIVER, TOMBIA RIVER, BUGUMA RIVER
Oroworukwo, Nigeria
Industrialization and modernization has led to high demand of energy resources thereby increasing the transportation and demand of crude oil and its products via different types of steel products which are prone to wear and tear leading to spillages of all forms in marine, brackish and fresh water ntal analysis index corrosion map of the shorelines of Ndoni river, Ahoada river, New Calabar river, Tombia river, Buguma river and Bonny estuary as well as determine corrosion rates of carbon steel coupons on these shorelines. Different ne sensitivity were used in this study which includes that of National Oceanic and Atmospheric Administration (NOAA) and Nigeria Oil Producing Trade Sector (OPTS). A total of eight ESI types were found in the area and they include 1b, 3a, 4a, 6b, 9b, 9c, 10a and 10b. The most prevalent faunas found in these shorelines include crocodile, iguana, sea turtle, jellyfish, tilapia, frog, snail, toad, white crab, shorebirds, earthworm and millipede. Spearman`s correlation coefficient (r) lt of the relationship between the number of socioeconomic features and biological species along the shorelines. The corrosion rates of the carbon steel coupons in the various shorelines of Ndoni river, Ahoada river, New Calabar river, Tombia river, Buguma river and Bonny estuary are 44.068g/yr, 69.912g/yr, 72.435g/yr, 86.559g/yr. 119.420g/yr and 191.591g/yr respectively. The carbon coupons had lower corrosion rates in freshwater habitats followed by at. Results from this study can serve as a quick reference point for oil spill responders as well as integral component of oil spill contingency planning, corrosion monitoring and decision making on type of steel to use on these various habitats.
Commons Attribution License, which permits
managers in identifying vulnerable coastal locations establish protection priorities and identify clean up strategies (ESI map 2010, NOAA 2010). Oyedepo and Adeofun (2011) reported that shorelines are ranked on the scale of 1 to 10 in which one (1) show the minimum vulnerability and ten (10) maximum vulnerability in case of an oil spill. Another useful method which has been used to describe and evaluate the coastline is IMO/MEPC, 2006 method for ranking of sensitivity coastline areas. This method has been widely used in Iranian coastlines mostly for identification and ranking of protected areas (Rouzbehi, 2009).Three information are gotten from an ESI map if an oil spill occurs they include
Human use resources which include high use recreational areas, protected beaches, archeological or cultural resources and natural reserves or marine
Shoreline habitats. According to Gundlach and Hayes (1978) these are classified by rank depending on how easy the garet would be to clean up, how long the oil
INTERNATIONAL JOURNAL OF CURRENT RESEARCH
would persist and how sensitive the shoreline is. In 1995, the United States National Oceanic and Atmospheric Administration extended ESI maps to lakes, rivers and estuary shorelines (NOAA, 2002).
The exposure the shoreline has to wave energy and tide, substrate type and slope of the shoreline are also taken into account in addition to biological productivity and sensitivity (NOAA, 2008). Some countries outside the United States have adopted the ESI approach to classify their own shorelines for similar oil spill contingency planning, the resulting maps being referred to as Regional Environmental Sensitivity Index (RESI) maps (Aps et al., 2016). Biological resources; habitats of plants and animals that may be at risk from oil spill are referred to as “Elements”. The different element groups include fish, reptiles, invertebrates, birds, amphibians, plants, marine mammals and terrestrial mammals. Consideration when ranking biological resources include the observation of sizeable number of individual in a tiny area, whether nesting or molting occur ashore and whether there are species present that are threatened or endangered (IMO/IPIECA, 1994). The need for environmental sensitivity index corrosion mapping arose due to corrosion of metals used in conveying oil and its products which has led to spillages of various forms in the Niger Delta giving rise to oil pollution affecting the ecosystem of the areas (Odokuma and Williams 2010, Akpabio et al., 2011, Belmonte et al., 2009). Oil pollution which could be resulting from corroding facilities in these areas has been so unremitting that repeated loss of lives and ecological devastation has been recorded (Oyedepo and Adeofun, 2011).
Since environmental/ecological degradation from oil spill results in gradual erosion of biodiversity pools and species, which forms the basis for the survival of the human species, prevention of this kind of disaster via rapid and precise response action is not negotiable (Fabiyi 2002, Gundlach et al., 2001). Comprehensive information on the sensitivity levels of each category of a susceptible environment is an important requirement for effective oil spill disaster management. Regrettably, the ESI corrosion document that could support the development of good robust oil spill contingency plan for the study areas are not available. In Nigeria ESI mapping began (Gundlach et al., 1981) as attempt by oil and gas operators to characterize the environment in their respective areas of operation by providing detailed and consistent sources of information as a critical tool in oil spill response. Although nuances exist between versions of sensitivity maps from zone to zone, the basic principles of the mapping have remained constant. This paper is a Nigerian example of ESI calculation. The paper adopted a modified Oil Producing Trade Sector Protocol (OPTS, 2001) and National Oceanic Atmospheric Administration (NOAA, 1996) methodology respectively for ESI corrosion mapping of study area. A new technique for validating shoreline sensitivity was added in Margalef’s specie richness computation. Metal coupons namely carbon steel was buried in these shoreline study areas susceptible to corrosion and spillage so that we could access how biological and human use resources impact on the pipelines carrying the oil products in the Niger Delta.
MATERIALS AND METHODS
The field site logistic plan was developed to determine among other things; the primary spatial data which include: a count of plants and animal species,
soil/substrate and socioeconomic features during field work. Also types of primary data to be collected, location of data collection and data size.
The metal coupons namely carbon steel was buried in the various shorelines and corrosion monitored by average weight loss of metal coupons at monthly intervals and the shorelines with the highest corrosion rates per year in each of the locations were used to develop the ESI corrosion map plot.
Stations were created at intervals of 400 meters along the coastlines namely from left to right Ndoni river, Ahoada river, New Calabar river Tombia river, Buguma river and Bonny estuary respectively. In-situ data such as substrate type, shore slope, exposure to wave energy, number of flora and fauna species present and socio economic features present were collected. Geographical coordinates of all features and points of interest were taken with the aid of a hand held GPS device. The in-situ data gathered were used to build up a data base for the shorelines on the updated Digital Base Map (UDBM) to derive level 1 GIS map modified into ESI map after including biological and socio-economic features as point symbols on the map then copied into Google map.
Results of rapid assessment (field notes and observations) along the shorelines were compared with the standard ESI look up table prepared for Nigerian Shoreline by the OPTS for validation.
Statistical Analysis
The relationship between shoreline biological productivity, human influence via the number of socioeconomic features were measured using Spearman’s rank correlation thus
= 1 − 6 ∑
( − 1)
Where n is the number of observation and d is the difference between the ranked variables.
Rules for Sensitivity Determination
Although there is yet to be a unified yard stick for shoreline categorization in Nigeria, the Oil Producing Trade Sector (OPTS) in Nigeria have adopted some rules which have been adopted in this study for determining the sensitivity rank of particular shoreline. Table1 is the standard ESI validation table with which to compare the results of rapid assessment along the shoreline. In Nigeria what qualifies a shoreline as an ESI type is tabled out clearly. In this paper, the distributions of biological features encountered along the shoreline were used to ascribe sensitivity values to the shores according to their richness in biodiversity. This was achieved using Margalef’s species richness.
Da =S-1/logN.
Where S equals the number of species and N equals total number of individual sampled.
RESULTS
Table 1. Standard ESI validation table for shorelines
ESI Shore Type Dominant sediment type and slope Slope Exposure
1a Exposed rocky shores or banks Rocky = boulders (>256mm) Banks = marked by
scarping, clay (<0.625mm) are common
Moderate-high Moderate-High
1b Exposed sea walls and solid man-
Made structures
Vary from Boulders and cobbles (>64 mm) to sand bags, solid concrete, sheet pileq or wood
Moderate-high Moderate-High
2a Unvegetated/Eroding bank Silt and Clay (<0.0625 mm) Very low slope Moderate
2b Exposed wave-cut platform Bedrock or boulders (>256mm) Low slope backed by bluff or
cliff
Moderate-High
2c Rocky shoals, bedrock ledges Bedrock or boulders (>256mm) Low slope Moderate-High
3a Fine sand beach Fine sand (0.0625-2.0mm) Low slope, (<50) Low-High
3b Scarps or steep slope in sand Sand = 0.0625-2.0mm Marked by scarp or steep slope Moderate-High
4a Medium to coarse sand beach Grain size =0.25-2.0mm Low to moderate Moderate-High
5 Mixed sand and gravel beach, bar
or bank
Grain size =1-64mm Low to moderate slope (8-150) Moderate-High
6a Gravel beach or bar Grain size <2mm, moderate Steep slope (10-200) Moderate-High
6b Riprap Boulders (<256mm) Moderate to steep slope (>200) Moderate-High
7 Exposed tidal flat Coarse sand-mud (<2mm) Low slope (30) Low-Moderate
8a Vegetative steeply sloping bluff Soil (sand-mud) (< 1 mm), boulders (>256 mm). Moderate to steep slope (>15o) Low
8b Sheltered Riprap Boulders (>256mm) Moderate to steep slope (>20o) Low
8c Sheltered rocky shore or scarp Bed rock or boulders (>256mm) Moderate to steep slope (>150) Low
9a Sheltered tidal flat or sand mud Medium sand-mud (<0.5mm) Low slope (30) Low
9b Vegetated low banks Soils (sand to mud (1mm Low to moderate slope (200) Low
10a Mangrove Nympa palm Mud (0.625mm) vegetation will indicate shore type Low slope (30 Low
10b Brackish/fresh water swamp Low slope (30 Low
10c Marsh Low slope (30) Low
Source OPTS (2001).
Table 2. Rules for assigning sensitivity values to habitats based on species Richness and Species Diversity
Score Range Points to be Assigned Remarks on Value Remarks on Value Assign no point No sensitivity If score is > 0 - 0.5 Assign 1 point Very low sensitivity If score is 0.51 - 1.0 Assign 3 points Very low sensitivity If score is 1.1-2.0 Assign 4 points Low sensitivity If score is 2.1-4.0 Assign 6 points Moderate sensitive
[image:3.595.71.520.495.781.2]If score is 4.1-6 Assign 7 points High sensitivity If score is 6.1-8.0 Assign8 points High sensitivity If score is 8.0->10 Assign 10 points Very high sensitivity
Table 3. Shore location, types of shore description and exposure to wave energy
Shore location Dominant substrate type (mm) Shore description Slope Exposure to wave energy
Ndoni (Imonita) Solid concrete Sea wall/Structures 0.83 Moderate
" (Utuechi) Grain size 0.25-2.0 Mangrove 0.22 Low
" (Aseazaga) " Medium to coarse sand beach 0.17 High
" (Ogbegene) Fine sand beach Fine sand beach 0.14 Moderate
" (Onuiku) Sandy loam soil (0.0625-0.25) Sheltered vegetative low bank 0.24 Low
Ahoada F (East) Sandy loam soil (0.0625-0.25) sheltered vegetative low banks 0.18 Moderate
“ F (West) Fine sand (0.0625-0.25) Fine sandy beach 0.13 High
" F (North) Grain size (0.25-2.0) Mangrove 0.14 Low
" F (South) Sandy loam soil (0.0625-0.25) Sheltered vegetative low banks 0.18 Moderate
" (Central) Solid concrete Seawall/Structures - Moderate
NCR F (Choba) Sand mud (< 0.0625) Brackish/Freshwater - -
" (Emuoha) " " - -
" (Aluu) Grain size 0.25-2.0 Mangrove 0.15 Low
" (Ogbogoro) Sandy loamy soil (0.0625-0.25) Sheltered vegetative low bank 0.20 Low
" (Ahia oha) " " 0.17 Low
Tombia F (East) Sand mud (< 0.0625) Brackish/Freshwater - -
" " (West) " " - -
" " (North) " " - -
" " (South) Grain size( 0.25-2.0) Mangrove 0.18 Moderate
“ " (Central) Sandy loam soil (0.0625-0.25) Huts along shore line 0.18 Low
Buguma (Northeast) Sand mud (< 0.0625) Brackish/Freshwater - -
" (Horse fall Ama) " " - -
" F (West) Boulders Riprap 0.85 Very High
" F (South) " " " "
" (Central) " " " "
Bonny F (Enyamba) Boulders Riprap 0.92 Very High
" " (Oputambi) " " 0.88 "
" " (Peterside) " " 0.92 "
" " (South) " " 0.92 "
" (Central) Solid concretes Seawall/Structures 0.88 "
Table 4. Represents the shoreline by category
ESI type Shore types Location
1b Sea walls/Solid manmade structures Ahoada (Central), Ndoni (Imonita), and Bonny (Central)
3a Fine Sand beach Ndoni (Ogbogene), Ahoada (West)
4a Medium to coarse sand beach Ndoni (Ogbogene)
6b Riprap Buguma (West, Central & South), Bonny (South, Enyamba, oputambi & Peterside
9b Sheltered vegetative low banks Ndoni (Onuiku), Ahoada F (East, South), NCR F (Ogbogoro, Ahiaoha)
9c Huts or settlements along shoreline Tombia (Central)
10a Mangrove/Swamp Ndoni (Utuechi), Ahoada F (North), NCR, F (Aluu) & Tombia F (South)
10b Brackish/Freshwater swamps NCR F (Choba), Tombia F (East, West, North), Buguma (North East), Horse fall Ama
[image:4.595.81.509.203.498.2]NCR: New Calabar River, F: Facing
Table 5. Biological & Socio-economic features per shore location
Location ESI type Number of socio-economic features Number of species of biota observed
Ndoni (Imonita) 1b 1 10
" (Utuechi) 10a 1 12
" (Aseazaga) 4a 3 11
" (Ogbogene) 3a 1 12
" (Onuiku) 9b 3 10
Ahoada F (East) 9b 2 10
" " (West) 3a 2 11
" " (North) 10a 2 12
" " (South) 9b 3 12
" (Central) 1b 1 10
NCR F (Choba) 10b - 13
" " (Emuoha) 10b - 13
" " (Aluu) 10a 1 14
" " (ogbogoro) 9b 2 13
" " (Ahia oha) 9b 1 13
Tombia F (East) 10b 1 13
" " (West) 10b 2 14
" " (North) 10b 2 19
" " (South) 10a 1 17
" (Central) 9c - 19
Buguma (North East) 10b 2 24
" (Horse fall Ama) 10b 2 22
" F (West) 6b 1 24
" F (South) 6b - 24
" (Central) 6b - 21
Bonny F (Enyamba) 6b 1 25
" " (Oputuambi) 6b 1 25
" " (Peterside) 6b - 29
" " (South) 6b - 27
" (Central) 1b - 25
NCR: New Calabar River F: Facing
Table 6. Sensitivity of shoreline with respect to specie richness
Location Number of biota (Da = S-1 /logN) Score Sensitivity
Ndoni (Imonita) 10 2.000000000 4 Low sensitivity
" (Utuechi) 12 2.073371592 4 "
" (Aseazaga) 11 2.039747432 4 "
" (Ogbogene) 12 2.073371592 4 "
" (Onuiku) 10 2.000000000 4 "
Ahoada F (East) 10 2.000000000 4 "
" " (West) 11 2.039747432 4 "
" " (North) 12 2.073371592 4 "
" " (South) 12 2.073371592 4 "
" (Central) 10 2.000000000 4 "
NCR F (Choba) 13 3.102288282 6 Moderate sensitive
" " (Emuoha) 13 3.102288282 6 "
" " (Aluu) 14 3.12749713 6 "
" " (ogbogoro) 13 3.102288282 6 "
" " (Ahia oha) 13 3.102288282 6 "
Tombia F (East) 13 3.102288282 6 "
" " (West) 14 3.12749713 6 "
" " (North) 19 3.217988517 6 "
" " (South) 17 3.187288491 6 "
" (Central) 19 3.217988517 6 "
Buguma (North East) 24 3.275473225 6 “
" (Horse fall Ama) 22 3.25507814 6 "
" F (West) 24 3.275473225 6 "
" F (South) 24 3.275473225 6 "
" (Central) 22 3.25507814 6 "
Bonny F (Enyamba) 25 4.284661721 7 "
" " (Oputuambi) 25 4.284661721 7 "
" " (Peterside) 29 4.316191624 7 "
" " (South) 27 4.301365575 7 "
" (Central) 25 4.284661721 7 "
[image:4.595.117.472.512.800.2]Tombia River, Buguma River and Bonny Estuary. Table3 is the result of physiographic characteristics of the shorelines in Ndoni River, Ahoada River, New Calabar River, Tombia River, Buguma River and Bonny Estuary. It shows the potential behavior of oil slick along shores and the ESI types each shoreline belongs. From Ogbogene (Ndoni) to Ahoada (West) the grain size are finer (0.0625-0.25mm) than those of Aseazaga in Ndoni (medium size grain 0.25-2.0mm). Along Imonita (Ndoni) to Buguma (West, Central and South) to Bonny (Enyamba, Oputambi, Peterside and South), heavy quarry rocks were used for shoreline protection and fortification.
This is the largest in terms of substrate size (>256mm).With respect to slope and exposure to wave energy, they have the highest. The deepest slope 0.92% was observed in Bonny (Enyamba, Peterside and South). The flattest slope (0.13%) was observed in Ahoada facing (West) with finer substrate size. This trend is typical of the geomorphology Nigerian coastline (Gundlach et al., 2001, Nosakhare et al., 2004). Note that the shore types in Nigeria are quite different from the ones found in some temperate countries; therefore a slight difference can be seen in the ESI classification in this paper.
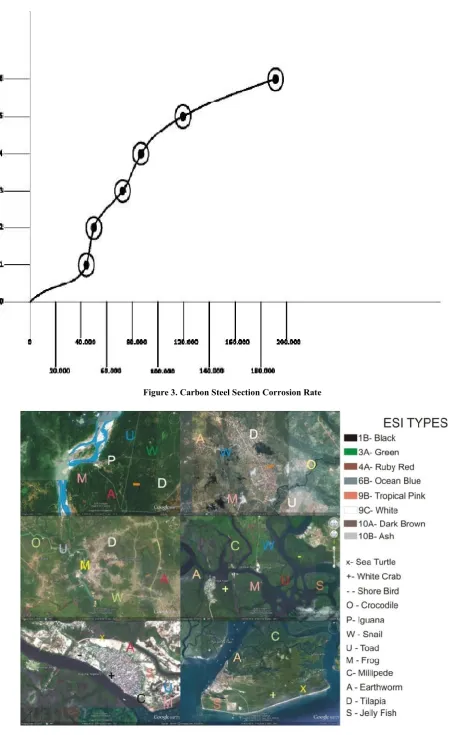
Table5 shows the distribution of Socio-economic and biological features along the shorelines the richness of each shoreline with respect to biodiversity is shown here. To ascertain this statement, Spearman’s rank correlation was used to test the level of association. Figure2 below is the result of Environmental Sensitivity Index Map of Carbon Steel Corrosion in Ndoni River, Ahoada River, New Calabar River, Tombia River, Buguma River and Bonny Estuary. Figure 3 below is the Carbon Steel section corrosion rate. Here we can see that corrosion rates increased from Ndoni River to Bonny estuary. We can say that the corrosion rates were higher in Bonny estuary than the brackish water Rivers namely New Calabar, Tombia and Buguma respectively. Corrosion rates were least in the fresh water Rivers namely Ndoni and Ahoada. Figure 4 below is the Environmental Sensitivity Index Map of the study areas.
DISCUSSION
The confusion and speculation created by environmental sensitivity index map and activities in the shoreline are made easier by including metal coupons namely carbon steel buried in the study area along the shorelines and their corrosion rates
determined alongside biodiversity distribution pattern and shore types. This study will give an insight to spill responders and coastal zone managers on pre-methods of preventing oil spills from taking place as well as post methods of combating the oil spill when it eventually occurs and identifying areas unavoidably prone to corrosion which could lead to oil spill in the Niger Delta shorelines. From the study we can see that mangrove and brackish water swamp ranked highest with score of 10a and 10b respectively. Studies by Gundlach et al., (2001) in the Niger Delta agree that mangrove and wetlands are the most sensitive in terms of oil spill on biodiversity in shoreline.
[image:6.595.96.502.75.604.2]Figure 3. Carbon Steel Section Corrosion Rate
importance in several industrial processes such as oil and gas production and transportation, petroleum refining and petrochemical processing Mendi et al., (2014). The work of Sidorin et al., (2005) showed that carbon steel is less resistant to corrosion and corrode faster in marine and brackish habitats than freshwater habitats as also shown in this study and when these carbon steel are exposed to the soil, they begin to corrode which could be defined as the capacity of producing and developing corrosion phenomenon which could lead to oil spill (Chalker and Palmer, 1989, Hamdy et al., 2008). It will be an unwholesome to say that this will be a threat to the ecosystem because the vegetation will stick and trap oil and if not immediately removed, may smoother and kill the animals. The use of vacuum low pressure flushing and containment should be considered. Looking at the water habitats we can see that sheltered vegetative low banks were found along the banks of Ndoni River, Ahoada River and New Calabar River. These were predominantly filled with terrestrial trees. Oil spillage occurring due to corrosion of carbon steel pipe lines conveying oil or any other cause, will lead to oil sticking to vegetation along the waterlines. They may be very high level of accumulation along shore lines. In case of oil spillage occurring, all free oil must be removed by vacuum or low pressure flushing. If the vegetation is heavily accumulated with oil, it may be necessary to remove them.
Ripraps as seen in Buguma River and Bonny Estuary are highly exposed to wave energy. In the case of Bonny Estuary the influence of Atlantic Ocean makes the wave energy very high. Oil can sip between the boulders especially where the riprap is located along the waterline. Asphalt deposits resulting from serious leaching caused by oil sticking to surfaces of boulders may occur. If there is spillage and the oil is fresh and liquid, high pressure spraying and or water flooding can be used, making sure that all the released oil is recovered. Hot water spraying and or scraping may be used where the oil has weathered and seems heavy. Replacement of densely oiled Riprap becomes necessary if the oiling has gone out of control. The fine sand beach and medium to coarse sand beach found in Ndoni and Ahoada Rivers could be accreting in nature. In case of oil spillage due to corroding pipes or other factors, Oyedepo and Adeofun (2011), noted that oil will most likely concentrate in bands along sandy beaches. Maximum penetration of oil into fine grain sand will be less than 15cm while penetration into coarse grain sand can reach 25cm and burial of oiled layers by clean sand within the first few weeks after the spill will be limited usually to less than 30cm whereas burial up to 60cm on coarse grain is possible.
If the oil is stranded on shore at the beginning of an accretion period, such as wave, the deepest burial will occur but much of the oil will be removed during the next wave. Heavy accumulation of residual oil can form tar mats. Impact on biota will likely be low unless the beaches are used for foraging and nesting. The beaches are always in use by people living in the mainland; cleanup must be done with care. Use of heavy equipment for oil removal could impact on the shores and sand removal could lead to erosion. Preferably, manual cleanup is recommended. The biocorrosion of carbon steel used in the transportation of crude oil and its products leading to spillages across the length and breadth of the Niger Delta cannot be over discussed. Lots of work done by different people including Jaganathan et al., (2011), Rybalka et al., (2006), Sidorin et al., (2005) showed that carbon steel is less resistant to corrosion than other steel metals like stainless steel and mild steel.
In this study from the sensitivity of shoreline with respect to specie richness, we can see that the score and sensitivity of Margalef’s specie richness increased in accordance with corrosion rate of carbon steel coupons buried from Ndoni River via Ahoada River, New Calabar River, Tombia River, Buguma River and Bonny Estuary respectively. From corrosion rates of carbon steel, Ndoni and Ahoada Rivers had values of 0.053g and 0.059g respectively being fresh water. New Calabar River, Tombia River and Buguma River had values of 0.109g, 0.125g, 1.630g respectively being brackish water. Bonny Estuary had value of 2.680g. From these data, we can see that Ndoni and Ahoada Rivers had lower corrosion rates as well as score of 4 and low sensitivity from Margalef’s specie richness in table4 while New Calabar River, Tombia River and Buguma River had moderate corrosion and score of 6 as well as moderate sensitivity from Margalef’s specie richness. Bonny Estuary had the highest corrosion rate as well as score of 7 with the highest sensitivity from Margalef’s species richness.
This shows that corrosion rates of the carbon steel coupons are proportional to the Margalef’s specie richness in score and sensitivity. This also implies that corrosion rates and specie richness in score and sensitivity were lowest in the freshwater followed by the brackish water areas and highest in the estuarine. This may be related to the higher proliferation of Sulfur Reducing Bacteria especially in estuarine and brackish water environments than in the freshwater areas in respect to bio-corrosion. Going by the higher corrosion rates in the estuarine habitat than the brackish water habitat down to the fresh water habitat, it is also likely that the spillage flow will follow that trend. According to Moller et al., (2003), West Africa where Nigeria is a big coastal nation, has a very low level of preparedness in combating oil pollution. Showing that the level of risk outweighs that of preparedness.
Conclusion
The environmental sensitivity index mapping of carbon steel corrosion will furnish environmental managers as well as federal government and agencies whose duties are consigned with protecting the environment as well as cleaning up spills best methods to adopt when confronted with these menacing problems. It provides a choice of when and where to use this carbon steel especially in the fresh water habitats where the corrosion rates are lower. The environmental sensitivity index mapping of carbon steel corrosion of these water habitats when looked into properly can assist in environmental impact assessment and base environmental studies as well as coastal and recreational planning and assessment of area of interest. From the finding of this study, response agencies like National oil Spill Detection and Response Agency (NOSDRA), National Emergency Management Agency (NEMA), Nigeria Environmental Study Team (NEST) and Department of Petroleum Resources in conjunction with the Federal government as a matter of urgency should set up a team that will constantly monitor corrosion rates of facilities conveying oil products in these area in order to have a regular assessment of the trend and manner of how they are affected as this will help in reducing the occurrence of these spills.
REFERENCES
Aps. R., Tonissom. H., Suursaar. V. and Orviku. K. 2016. Regional Environmental Sensitivity Index (RESI) Classification of Estonia Shoreline. Journal of coastal research, special issue, 75,972-976, coconut creek (Florida), ISSN 0749-0208.
Belmonte. H.M.S, Mulheron. M.J, Smith. P.A. 2009. Fatigue and Fracture of Engineering materials and structure, vol.32, no11, p.916-925.
Chaker. V. and Palmer. J.D. 1989. ASTM Committee G-J on Corrosion of Metal. “ Effect of Soil Characteristics on Corrosion”. ASTM International pp.81.
“Environmental Sensitivity Index (ESI) Maps”. Retrieved 2010-05-27.
Fabiyi. O.O. 2002. Real Time Space Remote Sensing Data and GIS for Oil Spill Disaster Management in Nigeria Niger Delta: A call for paradigm change. Report of UN/ECA workshop on disaster management in Africa
Guam. 2006. Environmental Sensitivity Index Map.
Gundlach. E., Imevbore. V.O., Witherspoon. B. and Ainodion. J. 2001. Incorporating biodiversity into sensitivity maps of the Niger Delta. International Oil Spill Conference, American Petroleum Institute, Wash. DC.p391-403. Gundlach. E.R., Hayes. M.O. and Getter C.D. 1981.
Sensitivity of Coastal Environment to oil spill. Proc. Seminar, Petroleum Industry and the Nigerian Environment, Warri, Nigeria. P.82-88.
Gundlach. E.R. and Hayes. M. 1978.Classification of Coastal Environment in terms of Potential Vulnerability to Oil Spill Damage, Marine Technology Society Journal, 12(4), 18-27. Hamdy. A., Shoelb. M.A., Saehand. A.G. and Baraket. Y. 2008. The electochemical behavior of mild steel in sulfide polluted Nacl at different velocities. International Journal
of Electrochemical Science, 3, 1142-1148.
IMO/IPIECA 1994. Sensitivity Mapping for Oil Spill Response. International Maritime Organization/
International Petroleum Industry Environmental
Conservation Association Report Series, Volume 1. 22p.
IPIECA/IMO/OGP, 2012. Sensitivity Mapping for oil spill response, 40.
Jaganathan. U., Nick. S. Roger. N. 2011. Improvement of passivity of Fe-xCr alloys (x<10%) by cycling via the reactivation potential, J. Appl. Electrochem, 41(7):873-879. Mendi. Y.E., Abdelouas. A. and Bardeau. J. (2014). The corrosion behavior of carbon steel in sulfide aqueous medium at 300C. JMEPG,23,1350-1351.
NOAA. 2002. Environmental Sensitivity Index Guidelines, Version 3.0. NOAA Technical Memorandum NOS OR and R11. Seattle: Hazardous Response and Assessment Division, National Oceanic and Atmospheric Administration, 129p.
NOAA. 2008\. Introduction to Environmental Sensitivity Index Guidelines. Version 3.0 NOAA Technical Manual Seattle. Hazardous Response and Assessment Division, National Oceanic and Atmospheric Administration, 56p. “NOAA’s Ocean Service Office of Response and Restoration.”
Response. restoration. noaa. gov. Retrieved 2010-06-16. Nosakhere E., Fairbairn, D. and Taiwo, L. 2004. Mobile
Handling of Environmental Sensitivity Index (ESI) Dataset.
Odokuma. L.O. and Williams .J.O. 2010. Mathematical modeling of the fate of oil spill by coupling Nigerian oil spill model with solid phase continuous flow method. Oyedepo. J.A. and Adeofun. C.O. (2011). Environmental
Sensitivity Index Mapping of Lagos shorelines. Global Nest
Journal, vol. 13, No3, 277-287.
Rouzbehi, M. 2009. Qeshm coastline zonation and determination of ecological sensitivity. Journal of
environmental science and technology, 11(4):237.
Rybalka. K.V., Beketaeva. L.A. and Davydov. A.D. 2006. Electrochemical behavior of stainless steel in aerated Nacl solutions by electrochemical impedance and rotating disk. Sidorin, D., Pletcher, D and Hedges, B. 2005. The
electrochemistry of 13% chromium stainless steel in oil field brines. Electrochim. Acta, 58:4109-4116.