A systematic search for changing-look quasars in SDSS
Chelsea L. MacLeod,
1‹Nicholas P. Ross,
1Andy Lawrence,
1Mike Goad,
2Keith Horne,
3William Burgett,
4Ken C. Chambers,
5Heather Flewelling,
5Klaus Hodapp,
5Nick Kaiser,
5Eugene Magnier,
5Richard Wainscoat
5and Christopher Waters
51Institute for Astronomy, University of Edinburgh, Royal Observatory, Edinburgh EH9 3HJ, UK 2Department of Physics and Astronomy, University of Leicester, University Road, Leicester LE1 7RH, UK 3SUPA Physics and Astronomy, North Haugh, St Andrews KY16 9SS, UK
4GMTO Corp., 251 S. Lake Ave, Pasadena, CA 91101, USA
5Institute for Astronomy, University of Hawaii, 2680 Woodlawn Dr., Honolulu, HI 96822, USA
Accepted 2015 December 22. Received 2015 December 22; in original form 2015 September 28
A B S T R A C T
We present a systematic search for changing-look quasars based on repeat photometry from Sloan Digital Sky Survey (SDSS) and Pan-STARRS1, along with repeat spectra from SDSS and SDSS-III Baryon Oscillation Spectroscopic Survey. Objects with large,|g| >1 mag photometric variations in their light curves are selected as candidates to look for changes in broad emission line (BEL) features. Out of a sample of 1011 objects that satisfy our selection criteria and have more than one epoch of spectroscopy, we find 10 examples of quasars that have variable and/or ‘changing-look’ BEL features. Four of our objects have emerging BELs, five have disappearing BELs, and one object shows tentative evidence for having both emerginganddisappearing BELs. With redshifts in the range 0.20< z <0.63, this sample includes the highest redshift changing-look quasars discovered to date. We highlight the quasar J102152.34+464515.6 atz=0.204. Here, not only have the Balmer emission lines strongly diminished in prominence, including Hβall but disappearing, but the blue continuumfν∝ν1/3
typical of an active galactic nuclei is also significantly diminished in the second epoch of spectroscopy. Using our selection criteria, we estimate that>15 per cent of strongly variable luminous quasars display changing-look BEL features on rest-frame time-scales of 8 to 10 yr. Plausible time-scales for variable dust extinction are factors of 2–10 too long to explain the dimming and brightening in these sources, and simple dust reddening models cannot reproduce the BEL changes. On the other hand, an advancement such as disc reprocessing is needed if the observed variations are due to accretion rate changes.
Key words: accretion, accretion discs – galaxies: active – quasars: emission lines – quasars: general.
1 I N T R O D U C T I O N
Due to modern photometric, spectroscopic, and time-domain sky surveys, we are now able to distinguish between the ubiquitous prop-erties of quasars and rare, discrepant behaviour, suggestive of new physics. The continuum variability of a quasar1is typically 0.2 mag
on time-scales of∼months to years and has been well characterized for large quasar samples using the Sloan Digital Sky Survey (SDSS;
E-mail:[email protected]
1We use the term quasar to mean a bolometrically luminous,1046erg s−1, active galactic nucleus (AGN).
e.g. Vanden Berk et al.2004; Wilhite et al.2005; Sesar et al.2007; Schmidt et al.2010; Butler & Bloom2011; MacLeod et al.2012) and more recently Pan-STARRS1 (PS1; Morganson et al. 2014, 2015; Simm et al.2015). A common interpretation of this vari-ability involves localized accretion disc instabilities, but the precise mechanisms are still under debate (e.g. Dexter & Agol2011; Kelly, Sobolewska & Siemiginowska2011; Kokubo2015, and references therein). For example, the colour dependence and near simultane-ity of variabilsimultane-ity pose severe problems (see Lawrence2012, and references therein). In Seyfert galaxies, time lags of hours to days suggest that the optical continuum variability is driven at least in part by reprocessing of extreme-UV (EUV) or X-ray light (e.g. Collier et al.1998; Sergeev et al.2005; Cackett, Horne & Winkler
2016 The Authors
at University of St Andrews on April 27, 2016
http://mnras.oxfordjournals.org/
2007; Shappee et al.2014; Edelson et al.2015) but this may be due to inner cloud reprocessing rather than the disc itself (Lawrence 2012), and the reliability of the interband lags has been questioned (Korista & Goad2001; Gaskell2007).
While the UV/optical continuum varies ubiquitously among quasars, typically in a ‘bluer-when-brighter’ fashion (e.g. Wilhite et al.2005; Schmidt et al.2012; Ruan et al.2014), the broad emis-sion lines (BELs) seen in quasar spectra are usually less variable and lagged with respect to the continuum, as seen in reverberation mapping (RM) studies (e.g. Clavel et al.1991; Peterson1993,2014; Grier et al.2012; Shen et al.2015). Results from such studies in-dicate that the BELs are formed by photoionization by continuum photons, and that the broad line region (BLR) spans a range in density, ionization state, and distance from the central black hole, which is typicallyR/c≈0.1 d(L/1046erg s−1)1/2. Some BELs show
a Baldwin effect, where the line equivalent width (EW) decreases with increasing continuum luminosity (Baldwin et al.1978; Kinney, Rivolo & Koratkar1990). In general, it seems that the underlying spectral energy distribution (SED) influences the wind structure and the high-ionization BEL parameters (Richards et al.2011). Be-cause Hβin particular, and to some extent MgIIbasically count
the number of ionizing photons and are less sensitive to changes in the AGN SED than the high-ionization lines, neither line shows a particularly strong global Baldwin effect (Dietrich et al.2002). However, an intrinsic Baldwin effect is seen and expected in an individual source (for Hβ, see Gilbert & Peterson2003; Goad, Ko-rista & Knigge2004; Cackett & Horne2006). Furthermore, BELs may respond differently to changes in ionizing continuum flux if the average formation radius is different. For example, Goad, O’Brien & Gondhalekar (1993) and O’Brien, Goad & Gondhalekar (1995) show that MgIIresponds less to continuum changes relative to the
other BELs (e.g. Hβ) due to its larger average formation radius and weak intrinsic response.
Emerging or disappearing BELs have been discovered in sev-eral relatively local AGN (Khachikian & Weedman1971; Tohline & Osterbrock 1976; Penston & Perez 1984; Cohen et al. 1986; Aretxaga et al. 1999; Bischoff & Kollatschny 1999; Eracleous & Halpern 2001; Denney et al. 2014; Shappee et al. 2014; Li et al. 2015), and recently in a higher redshift z = 0.3 quasar SDSS J015957.64+003310.4 (hereafter, J0159+0033; LaMassa et al. 2015). These BEL changes are often associated with large, factor10 changes in the continuum flux; the two are probably linked to the same physical mechanism, as such BEL and contin-uum changes are rare in AGN. This ‘changing-look’ behaviour is valuable for understanding the structure of the accretion disc and BLR. One possible physical scenario that could explain this be-haviour is variable obscuration by dust or gas clouds passing across the line of sight (e.g. Goodrich1989; Tran, Osterbrock & Martel 1992; Risaliti et al.2009). While strong arguments exist for vari-able absorption of the X-ray-emitting region in some AGN (Risaliti et al. 2009), it is relatively difficult to explain variable obscura-tion of the much larger UV/continuum region, as it is unclear what population of clouds would exist at sufficiently large radii (e.g. Nenkova et al.2008a,b). Indeed, a simple change in extinction fails to explain the observations of J0159+0033 (LaMassa et al.2015). Instead, the transition might be due to a change in available ion-izing flux from the central engine. LaMassa et al. (2015) suggest that such a change would be consistent with the disc-wind scenario of Elitzur, Ho & Trump (2014), where a decrease in the accretion rate, and consequently the level of ionizing flux, would cause the BELs to disappear as the system evolves from type 1 to 1.2/1.5 to
1.8/1.9.2An alternative scenario was proposed by Merloni et al.
(2015) in which J0159+0033 underwent a flaring episode due to a tidal disruption event (TDE) of a star by the supermassive black hole.
Motivated by the discovery of a single changing-look quasar in SDSS by LaMassa et al. (2015), in this paper we undertake a systematic search for similar objects with candidate ‘changing-look’ quasars being selected from their light curves over the course of SDSS and PS1. Our search is sensitive to emerging or disappearing BELs that may be associated with strong increases or decreases in flux in quasars which were more luminous thanMi= −22.0 with i>15.0 roughly 10 yr ago. In particular, what is being observed and reported here is the (dis)appearance of broad Balmer emission lines, and a strengthening (weakening) of MgIIemission.
The outline of the paper is as follows. In Section 2, we describe the SDSS and PS1 data used in this study. In Section 3, we de-scribe the sample selection. We present the results from our search in Section 4, describing a set of 10 quasars, five of which have disappearing BELs, four of which have appearing BELs, and one object that potentially has evidence for both disappearing and ap-pearing BEL behaviour. In Section 5, we discuss the time-scales associated with the changing-look BEL phenomenon, and calculate probabilities of observing the quasar BEL changes as a function of (rest-frame) time-scale. We conclude in Section 6. All photometric measurements are normalized to the AB-magnitude system. Where needed, we adopt a flatcold dark matter cosmology withH0=
70 km s−1Mpc−1andm=0.30.
2 DATA
For our search of candidate changing-look quasars, we utilize three imaging data sets as well as spectroscopy from the SDSS-I/II and SDSS-III surveys.
2.1 Imaging data
We use imaging data from the SDSS, SDSS-III, PS1, and Catalina Sky Survey. As a guide to the baseline of the observations, SDSS started its imaging campaign in 2000 and concluded in 2007, hav-ing covered 11 663 deg2. These data are part of the SDSS-I/II
survey and are described in Abazajian et al. (2009) and references therein. SDSS-III added another∼3000 deg2of new imaging area
in 2008. Pan-STARRS imaging commenced in 2009 and continued through to 2013. Hence, the addition of the PS1 photometry to the SDSS photometry increases the baseline of observations from≈8 to≈14 yr.
2.1.1 SDSS
The SDSS (York et al.2000) uses the imaging data gathered by a dedicated 2.5 m wide-field telescope (Gunn et al.2006), which collected light from a camera with 30 2 k×2 k CCDs (Gunn et al. 1998) over five broad-bands –ugriz(Fukugita et al.1996) – in order to image 14 555 unique deg2of the sky. This area includes
7500 deg2 in the North Galactic Cap (NGC) and 3100 deg2 in
the South Galactic Cap (SGC). The imaging data are taken on
2We follow the classical definitions of optical types, where the total flux in Hβrelative to [OIII] decreases going from type 1.2 to 1.8, and type 1.9 is defined as having broad Hαbut lacking any broad Hβ(Osterbrock1981).
at University of St Andrews on April 27, 2016
http://mnras.oxfordjournals.org/
dark photometric nights of good seeing (Hogg et al.2001) and are calibrated photometrically (Smith et al. 2002; Ivezi´c et al. 2004; Tucker et al.2006; Padmanabhan et al. 2008), and astro-metrically (Pier et al.2003) before object parameters are mea-sured (Lupton et al.2001; Stoughton et al.2002). The Eighth Data Release (DR8; Aihara et al.2011) provides updated photometric calibrations.
The Stripe 82 region of SDSS (S82; 22h24m<R.A.<04h08m
and|Dec.|<1.27 deg) covers∼300 deg2and has been observed
∼60 times on average to search for transient and variable objects (Abazajian et al.2009). These multi-epoch data have time-scales ranging from 3 h to 8 yr and provide well-sampled five-band light curves for an unprecedented number of quasars (see Sesar et al. 2007, Schmidt et al.2010, Ai et al. 2010, MacLeod et al.2010, Meusinger et al.2011, and Butler & Bloom2011for examples of quasar variability studies based on S82 photometry).
In addition to the DR8 photometry provided on the SDSS web site, our analysis utilizes the S82 data base of quasars in MacLeod et al. (2012), which includes observations taken in non-photometric conditions and recalibrated using the improved method of Ivezi´c et al. (2004). While the latter data set only includes point sources, we consider both resolved and unresolved observations from DR8, adopting point spread function (PSF) magnitudes in each case.3
We define a source to be in S82 if it is in the S82 data base of MacLeod et al. (2012) or in the (R.A., Dec.) range defined above.
2.1.2 Pan-STARRS1 3πSurvey
Our analysis includes imaging from the PS1 3πsurvey (Kaiser et al. 2002), in particular the Processing Version 2 catalogue available in a local Desktop Virtual Observatory (DVO) data base (released 2015 January). PS1 comprises a 1.8 m telescope equipped with a 1.4 gigapixel camera. Over the course of 3.5 yr of the 3πsurvey, up to four exposures per year in five bands,gP1,rP1,iP1,zP1,yP1
have been taken across the fullδ >−30◦sky (for full details, see Tonry et al.2012and Metcalfe et al.2013). Each nightly obser-vation consists of a pair of exposures 15 min apart to search for moving objects. For each exposure, the PS1 3πsurvey has a typical 5σ depth of 22.0 in thegband (Inserra et al.2013). The overall system, photometric system, and the PS1 surveys are described in Kaiser et al. (2010), Stubbs et al. (2010), and Magnier et al. (2013), respectively.
2.1.3 Catalina Sky Survey
While not included in our analysis, where instructive, we also show data from the Catalina Sky Survey second release (CRTS; Drake et al.2009). The CRTS magnitudes are based on unfiltered light but calibrated to aV-band zero-point. We average the CRTS data in segments of 10 d for visual clarity, and apply a constant offsetm0so that the data match any simultaneous SDSSg-band observations.
3We adopt PSF magnitudes throughout our analysis, although ideally CMODEL (KRON) magnitudes should be used for extended sources in SDSS (PS1). Since we are only interested in large magnitude changes in the central regions of any object, the differences in magnitude types should not appreciably affect our results. Also, we do not correct the magnitudes for Galactic absorption, as we are only interested in magnitude differences.
2.2 Spectroscopic data
We use the spectroscopic observations of quasars that are given in the SDSS Data Release Seven catalogue (DR7Q) from Schneider et al. (2010).
As described by Richards et al. (2002), quasar target candidates are selected for spectroscopic observations based on their optical colours and magnitudes in the SDSS imaging data or their detection in the FIRST radio survey (Becker, White & Helfand1995). Low-redshift,z3, quasar targets are selected based on their location in
ugri-colour space and the quasar candidates passing theugri-colour selection are selected to a flux limit ofi=19.1. High-redshift,z 3, objects are selected ingriz-colour space and are targeted to
i=20.2. Furthermore, if an unresolved,i≤19.1 SDSS object is matched to within 2 arcsec of a source in the FIRST catalogue, it is included in the quasar selection.
The final quasar catalogue from SDSS-I/II, based on the Seventh Data Release of SDSS (DR7; Abazajian et al.2009), is presented in Schneider et al. (2010). This catalogue contains 105 783 spectro-scopically confirmed quasars that have luminosities larger thanMi = −22.0.
In order to look for significant changes in the BELs, we require (at least) a second epoch of spectroscopy. This is supplied by the Baryon Oscillation Spectroscopic Survey (BOSS; Dawson et al. 2013) which was part of the third incarnation of the SDSS (SDSS-III; Eisenstein et al.2011).
We apply no selection to the type of BOSS spectroscopic target that is utilized for the later epoch of spectroscopy; i.e. a DR7 SDSS quasar that is a ‘changing-look’ candidate can be classified as a BOSS galaxy. Indeed, of the final sample of 10 objects presented in this work, only 3 are actually in the SDSS-III BOSS DR12 Quasar catalogue of Pˆaris et al. (in advanced preparation). We give further details of the repeat spectroscopic targeting in the appendix.
The BOSS spectrographs and their SDSS predecessors are de-scribed in detail by Smee et al. (2013). In brief, there are two double-armed spectrographs that are significantly upgraded from those used by SDSS-I/II. Exposed to a minimum signal-to-noise ratio of √10 in g and √20 in i (∼1.6 h/plate; Dawson et al. 2013), they cover the wavelength range 3600 to 10 400 Å with a resolving power of 1500 to 2600 (Smee et al. 2013). In addi-tion, the throughputs have been increased with new CCDs, grat-ings, and improved optical elements, and the 640-fibre cartridges with 3 arcsec apertures have been replaced with 1000-fibre car-tridges with 2 arcsec apertures. Ultimately, the throughput of the BOSS spectrographs are considerably greater (in the red and the blue), and span a greater wavelength range, than the original SDSS instruments.
The BOSS spectra presented in this work all haveLAMBDA_EFF
= 5400 Å (Dawson et al.2013), i.e. the SDSS plate holes were drilled to maximize the signal to noise at 5400 Å, and there-fore do not need the spectrophotometric corrections from Mar-gala et al. (2015). Also, the BOSS spectra presented here do not have the PROGRAM=APBIAS target flag, which would indicate
an offset in the fibre position with respect to the earlier SDSS spectrum.
2.3 Multiwavelength coverage
We cross-matched our superset of quasars with various radio and X-ray catalogues. We use the combined radio catalogue of Kimball & Ivezi´c (2014), which includes sources from five radio catalogues (FIRST, NVSS, GB6, WENSS, and VLSSr), to help identify blazar
at University of St Andrews on April 27, 2016
http://mnras.oxfordjournals.org/
contaminants in S82 during the selection process. We check the latest release of theXMM–Newtonserendipitous source catalogue (Rosen et al.2015) and theChandraSource Catalogue (CSC; Evans et al.2010) for archival X-ray observations of any interesting objects from our search.
3 S A M P L E S E L E C T I O N
Our superset is any object listed in the DR7Q catalogue of spec-troscopically confirmed quasars, which includes both point sources and resolved objects withMi<−22. To select quasars that may have varying spectral features, we quantify the photometric properties of this spectroscopic quasar data set and assume that significant BEL changes will be associated with a significant change in flux. We use theg-band SDSS photometry and extend the time baseline from 10 to 15 yr by includingg-band PS1 photometry in our analysis.4Since
our aim is to find changing-look quasars, we search for quasars that, along with the earlier spectrum in SDSS DR7, have a later spectrum in BOSS.
Initially, we limit our sample to the S82 region, so that a well-sampled light curve exists for each object, making it easier to iden-tify true large-amplitude photometric variability. There are 9474 quasars in S82, including extended sources which are not in the point source catalogue of MacLeod et al. (2012). Motivated by the light curve for J0159+0033, we search for quasars that show at least a 1.0 mag dimming or brightening in theg-band among any observations in the combined SDSS and PS1 light curve.5For
ob-jects with at least 10 photometric data points, light-curve outliers are flagged as being 0.5 mag away ingfrom the light curve running median (∼30 per cent of the sample). Since our aim is to find large, gradual changes in flux without a significant amount of contami-nation due to poor photometry, we reject these light-curve outliers during the variability selection. This selects 1692 objects with|g|
>1 mag and photometric uncertaintiesσg<0.15 mag. Approx-imately 15 per cent of these were observed again with the BOSS spectrograph; we focus on these 287 objects. 36 objects in this sub-sample are detected in the radio, and of these, 3 were clearly blazars, as they were radio sources and exhibited fast and large-amplitude variability (2–3 mag within months; e.g. Ruan et al.2012). We do not consider these three objects in our further analysis, as we are in-terested in BEL changes unrelated to blazar activity. After visually searching through all SDSS/BOSS spectra for BELs that are clearly present in one epoch but not another, we identify seven quasars from S82 in which at least some BELs satisfy this criterion.
We then extend our search to the entire SDSS footprint, which contains 105 783 quasars in DR7Q. Of the 105 746 quasars (>99 per cent) which have PS1 detections, 6348 have shown at least a 1.0 mag change in theirg-band light curves. Of these, 1011 have BOSS spectra, which includes the 287 quasars from S82. After visually inspecting each spectrum, we find three additional quasars with disappearing BELs. The final yield is higher for the S82 sam-ple due to the improved cadence; we are able to more efficiently identify high-amplitude variability as well as more reliably
iden-4The SDSSgfilter is close enough to theg
P1filter in overall response that we can ignore any colour terms.
5For a similar search but for large-amplitude (1.5 mag) nuclear bright-ening in resolved SDSS galaxies, see Lawrence et al. (2012), which uti-lizes results from the PS1 Faint Galaxy Supernova Survey available at
[image:4.595.305.543.51.422.2]http://star.pst.qub.ac.uk/sne/ps1fgss/psdb/.
Figure 1. Distribution of the maximum magnitude difference|g|max ver-sus time lag|t|. The black contours show the distribution for the superset of quasars (DR7Q), which is based on SDSS and PS1 photometry. The white contours are the same but for the subsample of quasars in S82, which are shown as grey data points (one point per S82 quasar). The contours show regions containing 5, 10, 25, 50, and 75 per cent of the data. The subsample of DR7Q with repeat spectra and|g|>1 photometric changes are shown by open red circles, but now showing the|g|maxspanned by the spectro-scopic epochs versus the corresponding time between spectra. For objects with multiple spectra, we choose the two epochs spanning the largest|g| for display here. While the data are clumped into ‘seasons’ in the top panel, the distribution is smoothed out when switching to rest-frame time lag in the bottom panel. Our final selection is limited to quasars with repeat spectra with|g|max>1 (indicated by the horizontal dashed line). The final sample of 10 objects are plotted as blue crosses.
tify spurious data points.6The distributions of the time-scales and
magnitude changes involved are shown in Fig.1. This selection algorithm skews our search to those objects showing BEL changes over roughly 10 yr, since this is the timespan between SDSS and BOSS spectra, although the rest-frame time-scales probe down to shorter time-scales (bottom panel). The improved time coverage of the S82 regions can also be seen from the contours in the panels; the
6Without having a well-sampled light curve, outliers due to poor photometry are more difficult to identify by our algorithm and therefore can cause the object to pass the|g|>1 mag criterion.
at University of St Andrews on April 27, 2016
http://mnras.oxfordjournals.org/
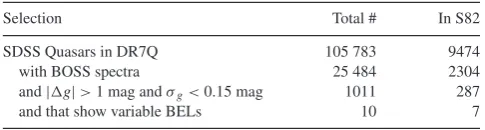
Table 1. Selection of spectroscopically variable quasars.
Selection Total # In S82
SDSS Quasars in DR7Q 105 783 9474
with BOSS spectra 25 484 2304
and|g|>1 mag andσg<0.15 mag 1011 287
and that show variable BELs 10 7
S82 sample (in white) fills in gaps in|t|while reaching to larger |g|.
Our sample selection is given in Table1.
4 T H E C H A N G I N G - L O O K Q UA S A R S
Our initial search through the S82 quasars yielded the following results: (i) significant BEL changes are seen on long time-scales (∼2000 to 3000 d in the rest frame) in the selected sample; (ii) these changes are associated with large (|g| ∼1) amplitude changes in the photometry, and (iii) emerging (disappearing) BEL features correspond to continuum brightening (dimming). Given the extra temporal information provided by S82 light curves, our selection algorithm could more easily identify large-amplitude outbursts and reliably reject spurious data points, yielding seven objects of interest in S82.
When extended to the full SDSS footprint, where the inclusion of the PS1 3πphotometry generated light curves for>99 per cent of the DR7Q quasars, our combined search yielded three additional objects (Table1). We present all 10 objects here: four that show
appearingBEL features, five that showdisappearingBELs,7and
one that shows evidence for both.
Our final sample of changing-look quasars is listed in Table2, and the redshift distribution is compared to the full quasar sample in Fig.2. We note that all of our objects are atz <0.63, but this is potentially a selection effect, as we discuss in Section 5. However, this sample extends the range of known changing-look AGN toz= 0.63 at quasar luminosities. In Fig.3, the 5007 Å [OIII] luminosity
is shown as a function of redshift for the full DR7Q sample and our final objects. Examples of previously studied changing-look AGN are also shown for comparison. The [OIII] luminosity is often used
as a proxy of the intrinsic AGN luminosity (e.g. Kauffmann et al. 2003; Heckman et al.2004), so that Fig.3is a comparison of the intrinsic brightness and redshift of changing-look AGN.
In the following sections, we compute the flux deviation between two spectra at any given wavelength, Nσ(λ)=(f2−
f1)/σ2 2+σ
2
1 (e.g. Filiz Ak et al.2012), to determine the
sig-nificance (in units ofσ per spectral pixel) of a BEL change. In particular, we assess the significance of a BEL change by com-paring its flux deviation to that of the underlying continuum at that wavelength. Note that the significance of BEL changes will be higher than that quoted here whenNσ(λ) is integrated over the pixels spanning the BEL. In the few cases where there are more than two spectra available, we adopt the two spectra with the largest time lag unless otherwise stated.
In each case, the difference spectrum|fλ| = |fBOSS−fSDSS|is presented.|fλ|is fit as a power-law after masking out the Hα, Hβ, Hδ, Hγ, MgII, and HeIBELs and allowing the normalization
7One object, SDSS J214822.25+011217.6, is not considered part of our sample although it exhibited a disappearing BEL; the disappearance was due to the appearance of a broad absorption line, which is a different phenomenon than the changing-look behaviour studied here (see Filiz Ak et al.2012).
to vary. The best-fitting power-law indicesβare listed in Table2 and are based on the spectra listed in the preceding columns. We compare the best fits to afν∝ν1/3 power law since this form is
expected if the variable component resembles a standard thin disc (Shakura & Sunyaev1973).
4.1 Appearing BELs
Four objects that show evidence of appearing BELs are plotted in Fig.4. In all cases, the flux increased dramatically (|g|>1 mag). The light curves in the top two panels of Fig.4show a ‘flat-topped’ behaviour, i.e. rising over ∼1000 d in the observed frame to a constant luminosity. J214613.31+000930.8 (second panel) is the only object from our final sample that has a radio detection. In all cases, Hβis absent from the first spectrum while MgIIis observed
at low signal to noise. In general, however, the significance for appearing BELs in our sample is not very high (3σ per spectral pixel for all Hβtransitions) for two reasons. First, in order to be included in our search, the source must be a BEL quasar in the initial DR7 spectrum, thus making any further BEL brightening less significant. Secondly, the improved BOSS spectrograph provides higher quality spectra than the SDSS spectrograph, so if the source is faint in the earlier spectroscopic epoch, its spectrum will be correspondingly relatively noisy. However, with these caveats in mind, it is notable that our search produced a similar number of appearing and disappearing BEL cases.
4.2 Disappearing BELs
The five objects that show evidence of disappearing BELs are plot-ted in Fig.5. In all cases, theg-band flux dropped significantly from the SDSS spectroscopic epoch to the BOSS epoch.
We recover J0159+0033 in our search (top panel of Fig. 5), which shows a vanishing Hβat 4σ significance. Among our 10 final objects, this is the only one present in the XMMor Chan-dracatalogue. J022652.24−003916.5, shown in the second panel, showed a similar behaviour, and multiple BOSS spectra reveal the object in an intermediate phase between MJD≈55200 and 56250 (cyan and purple spectra). In this case, the MgII BEL is barely
present. However, the BEL disappearance in this object is at low significance (<2σ) since the source is faint (20.5<g<22). The remaining panels show three objects from outside S82 where Hβ vanishes at >3σ significance. The object J102152.34+464515.6 (hereafter J1021+4645), shown in the third panel, demonstrates a highly significant (8σ) change from a type 1.0 to a type 1.9 AGN, and we elaborate on this object in Section 5. In the dim-state spec-trum for SDSS J100220.17+450927.3, the broad MgIIline is still
present, but the Hβline is absent.
The BOSS spectrum for J132457.29+480241.2, shown in the last panel, was unrecoverable redwards of Hβdue to data extrac-tion issues associated with that particular BOSS fibre. However, an additional spectrum was obtained in January 2015 (MJD=57036) by Ruan et al. (2015) using the 3.5m telescope at the Apache Point Observatory (APO), and it is presented in the appendix of that pa-per. The HβBEL is present in the APO spectrum but diminished with respect to the SDSS spectrum. However, assuming that the measured BOSS flux is accurate, the APO spectrum was obtained when the object had rebrightened.
4.3 Both appearing and disappearing BELs
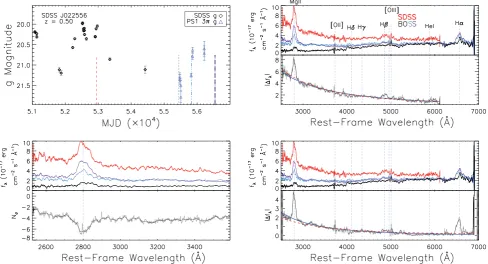
One object, SDSS J022556.07+003026.7 (hereafter J0225+0030), shows a significant evolution of the BELs as the source dims
at University of St Andrews on April 27, 2016
http://mnras.oxfordjournals.org/
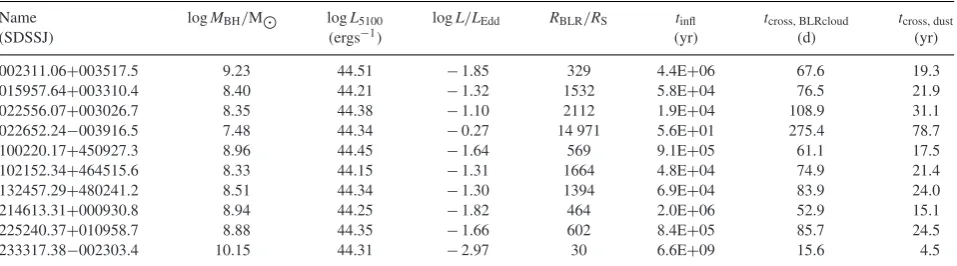
Table 2. SDSS Quasars with emerging or disappearing BELs.gis the largest magnitude change observed, andtRFis the time span for this change in the rest frame of the quasar. J015957.64+003310.4 is the (first) changing-look quasar discovered by LaMassa et al. (2015). Max(g) is defined such that positive values imply a dimming in the light curve. The last column lists the best-fitting power-law indexβfor the difference spectrum.
Name z Max(g) tRF BEL (MJD|plate|fibre)1 (MJD|plate|fibre)2 |fν| ∝νβ
(SDSS J) (d) behaviour
[image:6.595.44.282.515.685.2]002311.06+003517.5 0.422 −1.50±0.04 3072 Appear 51816|0390|0564 55480|4219|0852 0.04±0.02 015957.64+003310.4 0.312 1.16±0.06 1985 Disappear 51871|0403|0549 55201|3609|0524 0.27±0.02 022556.07+003026.7 0.504 1.81±0.14 1985 Both 52944|1508|0556 55445|3615|0617 0.16±0.03 022652.24−003916.5 0.625 1.75±0.09 2242 Disappear 52641|1071|0281 56577|6780|0339 0.2±0.1 100220.17+450927.3 0.400 1.41±0.07 2134 Disappear 52376|0943|0310 56683|7284|0122 −0.20±0.02 102152.34+464515.6 0.204 1.44±0.04 3313 Disappear 52614|0944|0603 56769|7386|0410 0.175±0.007 132457.29+480241.2 0.272 1.27±0.07 2923 Disappear 52759|1282|0045 56805|7406|0527 0.86±0.02 214613.31+000930.8 0.621 −1.57±0.08 1597 Appear 52968|1107|0358 55478|4196|0774 0.1±0.1 225240.37+010958.7 0.534 −2.06±0.06 2596 Appear 52174|0676|0442 55500|4294|0045 −0.45±0.08 233317.38−002303.4 0.513 −2.26±0.07 2164 Appear 52199|0681|0114 55447|4212|0312 0.75±0.07
Figure 2. Normalized redshift distributions for the sample of changing-look quasars (in blue), the full sample ofNtot=6348 highly variable quasars (purple), the subset with BOSS spectra (dashed red;Ntot=1011), and the entire DR7 quasar catalogue (dotted; Ntot = 105, 783).n indicates the number of points in a bin divided by the bin width, and each histogram has unit area.
Figure 3. [OIII] luminosity versus redshift for the DR7Q sample (contours), our final sample of 10 (blue crosses), and examples of previously known changing-look AGN (black points; cf. fig. 1 in LaMassa et al.2015). For the DR7Q sample, we adopt values from Shen et al. (2011).
and rebrightens (see Fig.6). The multiple BOSS spectra8reveal
a complete disappearance and re-emergence of Hβ, although this is at low significance due to low signal to noise. MgII shows a
similar behaviour, but it retains a broad component throughout. While outside the range of the SDSS spectrum, in the BOSS spectra the broad Hαcomponent shows a clear increase over the course of just one year, going from MJD =55445 (in black) to 55827 (in cyan). Similar rapid BEL changes have also been ob-served in Seyfert galaxies such as NGC 7603 (Tohline & Oster-brock1976) and Mkn 110 (Bischoff & Kollatschny1999). In the MgII BEL profile shown in the lower left panel, the red wing diminishes faster than the blue wing which is broadly consis-tent with infalling gas. Such profile changes may provide a tool to study the structure of the BLR and warrants a future detailed study.
Here, we are interested in the response of the MgIIline to the
underlying near-UV continuum in comparison to what is typically observed, since atypical behaviour may indicate a rare, more ex-treme event. We measure the EW of MgIIand find it to be constant
(≈100 Å) over the large drop in local continuum flux going from 5.2×10⁻¹⁷erg cm−2s−1Å−1in MJD=52944 to 0.9×10⁻¹⁷erg
cm−2s−1Å−1in 55 445. For the few reverberation mapped sources
with MgIIcoverage, the MgIIline is typically unresponsive (e.g.
Clavel et al.1991; Krolik et al.1991; Goad et al.1993; Cackett et al.2015), meaning that the line flux is constant as the continuum level varies. The result is an intrinsic Baldwin effect where the EW decreases with increasing continuum flux in a given AGN. Since the MgIIEW remains constant (leading to a negligible Baldwin effect,
as seen for an ensemble of objects in Dietrich et al.2002), it seems that the MgIIBEL response in J0225+0030 is more pronounced
than in typical AGN.
We elaborate on J0225+0030 in Appendix A3.
4.4 Continuum changes
While the majority of highly variable quasars in our search did not exhibit emerging or disappearing BELs, they often showed clear changes in the continuum slope in a bluer-when-brighter fashion,
8J0225+0030 was observed multiple times due to it being on the ex-tra deep BOSS plates 3615 and 3647, see http://www.sdss.org/dr12/ spectro/special_plates/. There were 12 additional epochs of spectroscopy which are not shown in Fig.6.
at University of St Andrews on April 27, 2016
http://mnras.oxfordjournals.org/
Figure 4. Quasars that show evidence for emerging BELs. The light curves in the left-hand panel show the SDSSg-band (black diamonds), PS1g-band (blue triangles), and CRTS photometry (red dots). The right-hand panels show the SDSS and BOSS spectra in red and black, respectively, with epochs indicated by the (colour-coded) vertical dotted lines in the light curve. The flux difference|fλ|between the BOSS and SDSS spectra is shown in the right lower subpanels, where the blue curve is the best-fitting power lawfν∝νβ, and the red-dashed curve is a power law withβ=1/3 which is expected for a standard thin disc.
as is expected for quasars9(e.g. Schmidt et al.2012). In the 10 cases
presented here, clear continuum slope changes were observed along with the BEL changes based on the ratio between spectra.
The difference spectra, shown in the lower right subpanels of Figs 4–6, eliminate any underlying host galaxy light which is present in both spectra and reveal the SED of the variable component. Aside from the features resulting from the BEL change, the|fλ|curves are well described by a power law of the formfν∝νβ, and the best-fitting power law is shown as a blue curve. The median best-best-fitting power-law index for the sample isβ= 0.2, with an root-mean-square value 0.4. The red dashed curves show afν∝ν1/3power law
expected for a standard thin disc, and the difference spectra for all 10 objects appear qualitatively consistent with this form. Note that in some cases,|fλ|deviates from the power law at the shortest
9We do not quantify the colour changes for the overall sample of 1011 objects, as this is outside the scope of this work. For such a study, we refer readers to Ruan et al. (2014).
wavelengths (e.g. top two panels of Fig.5), but this is likely due to a relatively increased noise level in the SDSS spectrum.
It is well known that AGN spectra do not typically follow the
fν∝ν1/3form expected for a standard thin disc in the optical; only the
near-infrared (NIR) polarized continuum has been shown to agree with this prediction (Kishimoto, Antonucci & Blaes2003). This is true for our final sample as well (the medianβ≈ −1 in the high-luminosity state). However,|fλ|for all 10 objects follows a power law that is much more consistent withfν∝ν1/3than the individual
spectra. This implies that the variable component is related to the thermal accretion disc, which might be expected if there was a change in the temperature structure of the accretion disc due to a change in viscous heating or irradiating flux.
4.5 Comparison to previously reported changing-look quasars
In Table3, we list four previously reported changing-look quasars (atz >0.1), including J0159+0033. J012648.08−083948.0, and J233602.98+001728.7 are not in DR7Q and therefore are not in our
at University of St Andrews on April 27, 2016
http://mnras.oxfordjournals.org/
Figure 5. Quasars with disappearing BELs. The top panels show J0159+0033, which was discovered in LaMassa et al. (2015). The cyan and purple spectra in the second (right-hand) panel show additional BOSS epochs at MJD=55209 and 56267, respectively.
parent sample. These two objects were found by Ruan et al. (2015) in an archival search for objects whose pipeline spectroscopic classi-fications changed between epochs of spectroscopy. Therefore, their search was sensitive to only the most dramatic changes in spec-tral state, whereas our variability-based selection is sensitive to dramatic transitions as well as more subtle changes in AGN type. However, while J233602.98+001728.7 shows enough variability to be included in our sample, J012648.08−083948.0 only shows a
0.78 mag dimming going from SDSS to PS1. This suggests that our variability criterion of|g|>1.0 mag is too restrictive.
The Ruan et al. (2015) sample selects objects that change their ‘CLASS’ classification, where theCLASS parameter is from the 1-D SDSS pipeline (see section 5; Bolton et al.2012). All the objects in our sample except for two are originally classified as ‘QSO’ and stay classified asCLASS=QSO in their later epoch pipeline classification. The two exceptions are J0159+0033 and
at University of St Andrews on April 27, 2016
http://mnras.oxfordjournals.org/
Figure 6. A quasar exhibiting disappearing and reappearing BELs. In the lower left panel, a zoom-in on the MgIIline shows profile changes, and the flux deviationNσ=(f2−f1)/
σ2
2 +σ12between the early BOSS (black,f2) and SDSS (red,f1) spectra is shown in the bottom panel. The lower right panel is identical to the upper right panel except that the flux differencef3−f2between the latest BOSS (purple,f3) and earlier BOSS (black,f2) spectra is shown. The epochs for the red, black, cyan, and purple spectra are MJD=52944, 55445, 55827, and 56544, respectively.
Table 3. Previously reported changing-look quasars (z >0.1).
Name z Max(|g|) DR7 Found
(SDSS J) (mag) QSO? here?
012648.08−083948.0a 0.198 0.78±0.03 × ×
015957.64+003310.4b 0.312 1.16±0.06 √ √
101152.98+544206.4c 0.246 1.51±0.02 √ ×
233602.98+001728.7a 0.243 1.59±0.13 × ×
Notes.aFound by Ruan et al. (2015).bFound by LaMassa et al. (2015). cFound by Runnoe et al. (2015).
J132457.29+480241.2. However, the latter source was not consid-ered in the end to be a changing-look quasar by Ruan et al. due to reasons described in the appendix of that paper.
The Time Domain Spectroscopic Survey of SDSS-IV (TDSS; Morganson et al.2015) is obtaining repeat spectra for quasars show-ing|g|>0.7 mag variability, and is likely to find a more complete sample of changing-look quasars. J101152.98+544206.4, discov-ered by TDSS (Runnoe et al.2015), is in DR7Q but does not have a spectrum in DR12. Had it been observed in SDSS-III, we would have recovered this object since it is 1.5 mag dimmer in PS1 (g=
19.879±0.014 at MJD=55838.170) with respect to SDSS.
5 D I S C U S S I O N
AGN are known to be variable phenomena. However, it is only relatively recently that multiple spectra of the same AGN at high-z have become available, mainly due to large spectroscopic surveys such as the SDSS. Moreover, notingchangesin these spectra of
AGN gives direct observational evidence and insight to the physical processes that are happening in the AGN.
One key result from our systematic search is that using a vari-ability cut seems to be one effective way of finding changing-look quasars. Our base sample is DR7Q, of which 6348 (6 per cent) satisfy the photometric selection described in Section 3. Of these, 1011 objects are reobserved with BOSS, and 10 (1 per cent) show BEL (dis)appearances and reside in the redshift range 0.20< z < 0.63. We may be biased towards finding changing-look behaviour atz <0.8 since beyond this the Hβline is no longer in the SDSS spectrum, and significant changes were most commonly seen in this line. The lack of significant changes in the CIVand MgIIlines may
be due to the fact that CIVis affected by winds (Richards et al. 2011) and that MgIIhas a relatively weak responsivity (Goad et al. 1993; Cackett et al.2015).
A second key result from our study is that the difference spectra for our final sample of 10 changing-look quasars are more consistent with the naively expectedfν∝ν1/3power law for a thin disc (Shakura
& Sunyaev 1973) than the individual spectra. This suggests that the variable component has an SED similar to an accretion disc, and that the reddening in the quasar host galaxy must be small. Furthermore, whatever is causing a BEL (dis)appearance must be linked to an emerging (diminishing) continuum. Indeed, the BELs track the blue continuum change on rest-frame time-scales as short as 255 d in J0225+0030 (Section 4.3).
‘Outbursts’ associated with BEL appearance could be due to changing obscuration, changing accretion rate, or transient be-haviour such as a TDE or microlensing. Presumably because of the relatively low redshifts, these are not microlensing events (see Lawrence et al.2012, for larger amplitude and typically more dis-tant AGN flares). While a TDE could explain J0159+0033 (Merloni
at University of St Andrews on April 27, 2016
http://mnras.oxfordjournals.org/
[image:9.595.45.286.409.483.2]Figure 7. Probability,p, of BEL (dis)appearance as a function of rest-frame time lag, based on our sample (see the text). The errors inpare computed asp/√Nbin, whereNbin(shown as the normalized, dotted histogram) is the number of highly variable quasars with repeat spectra (red open data points in Fig.1) which fall in each time bin. None of our 10 objects have|t|< 1000 d, so for this bin we only show an upper limit corresponding to<1 object. The ratio of changing-look objects toNbinis listed in each bin.
et al.2015), such a flaring episode is ruled out for at least some other objects presented here. For example, the light curve in the top panel of Fig.4shows that the luminosity has remained in the high state for the last 2000 d (observed frame) instead of decaying with at−5/3
form expected for a TDE (e.g. Evans & Kochanek 1989; Gezari et al.2012; Guillochon, Manukian & Ramirez-Ruiz2014). Further-more, TDEs should only remain in the high state for a few months (e.g. Gezari et al.2012), unlike what is observed here. In addition, the narrow emission lines are present in the early states for each source, which would be too fast of a large-scale response for a TDE (as pointed out by Runnoe et al.2015; Ruan et al.2015). Therefore, we limit the following discussion to the first two possible scenarios.
5.1 Observed time-scales for BEL (dis)appearance
One feature which may help guide physical interpretations is the time-scale associated with a spectral state change. As such, we would like to place an upper limit on thefastesttime-scales associ-ated with BEL (dis)appearance. Due to the nature of the SDSS and PS1, we lack a complete sampling of time-scales and are prone to selection effects imposed by the timing of both the photometric and (especially the) spectroscopic observations. In Fig.7, we show the probabilitypwhich is simply the ratio of changing-look quasars to the highly variable sample with repeat spectra, i.e. the ratio of blue crosses to red open circles in each of the four time bins shown in the bottom panel of Fig.1. Out of the highly variable objects with repeat spectra, we find the highest probability for changing-look be-haviour on rest-frame time-scales of 2000–3000 d and 3000–4000 d (p=0.076±0.009 andp=0.15±0.03, respectively). When re-stricted to the redshift range 0.2< z <0.63,pincreases top=
0.113±0.016 andp=0.18±0.04, respectively. Note thatpwill be higher for the subsample withspectroscopicepochs spanning a>1 mag change (i.e. those showing a>1 mag change from one spectral epoch to the next, shown by the red open circles above the dashed line in Fig.1) – this subsample is more representative of the objects in which we could have observed changing-look be-haviour. However, the size of this subsample is too small to make any statistical conclusions. Along with being biased by the sparse sampling of spectroscopic epochs, we are also likely biased towards
long rest-frame time-scales given that Hβis only visible atz <0.8. Fig.7suggests that the fraction of changing-look quasars rises to 0.2 att∼10 yr; therefore, future surveys are needed to determine if the fraction of changing-look quasars continues to rise on even longer time-scales.
While the time-scales for BEL changes explored in Fig.7are limited to the timing of spectroscopic observations, seven of our objects have S82 light curves, which provide more information on the time-scales over which the transitions may have occurred. In general, the light curves show strong increases in flux over 1000 d in the observed frame (or roughly two years in the quasar rest frame; Fig.4), but strong decreases in flux over considerably longer time-scales (several years in the observed frame; top two panels of Fig. 5). The light curve for J0225+0030 (Fig.6) shows a rise over less than a year in the quasar rest frame following a slow decline over 5 yr in the rest frame.
5.2 A change in the central engine?
To explore a physical scenario where the amount of available ion-izing flux from the central engine has changed, we must consider both the time-scale for BEL response as well as the time-scale for the continuum variability. In the first case, since BELs result from photoionization (e.g. Peterson1993), they should respond on the light crossing time-scaletlt=RBLR/cdays, whereRBLRis the ra-dius of the BLR. Using theR−Lrelation calibrated by Bentz et al. (2013), the BLR size is estimated to beRBLR=2954RSM−1
8 L
0.533 44 ,
whereM8=MBH/(108M ) is the mass of the central supermassive
black hole in units of 108M ,L44=λL
λ(5100 Å)/(1044erg s−1),
andRSis the Schwarszchild radiusRS = 2GMBH/c2. This gives tlt=34L0.533
44 d, similar to the observed BEL lags in RM, although
the lags are typically shorter since the majority of the∼50 AGN studied through RM have lower luminosities.
One assumption in RM studies is that the structure of the BLR remains stable over the duration of the experiment. For Seyferts, the optical continuum variations are typically a factor 1.3 over rest-frame time-scales of approximately months (e.g. Edelson et al. 2015). The photometric variability presented here is more dramatic in comparison: on average by a factor 4 ing-band flux over seven years in the rest frame. Furthermore, we observe a stronger MgII
re-sponse in J0225+0030 over 4.5 yr in the rest frame (Section 4.3) than typical in RM studies (e.g. Cackett et al.2015), which might be expected if the source of ionizing photons has significantly di-minished. In this case, the BLR may have time to adjust its overall structure in response to such large changes in ionizing flux, and BEL changes might be expected on the dynamical time-scale of the BLR. For typical Seyfert galaxies,tdyn≈RBLR/V≈3 to 5 yr (Peterson2006), whereVis a typical cloud velocity. This time-scale will be slightly longer for higher-luminosity quasars, since
tdyn∝L3/4M−1/2
BH , assuming Keplerian rotation and thatRBLR∝L1/2
for photoionized lines. The time between SDSS and BOSS spectra is long enough so that a dynamical response of the BLR cannot generally be ruled out for our sample.
Regardless of what is happening in the BLR, it is clear that the BELs track a large change in continuum level flux. The time-scale that might be associated with an accretion rate change is the viscous, or ‘radial inflow’ time-scale (see e.g. Krolik1999). Indeed, Elitzur et al. (2014) provide a scenario where AGN evolve naturally from type 1 to 1.2/1.5 to 1.8/1.9 as the accretion rate diminishes. Using equation 5 in LaMassa et al. (2015) and scaling the Eddington parameterλEdd andMBHto the measured values for J1021+4645
at University of St Andrews on April 27, 2016
http://mnras.oxfordjournals.org/
[image:10.595.46.279.56.211.2]from Shen et al. (2011), we obtain:
tinfl=5×10⁴
α
0.1
−1λEdd
0.05
−2 η
0.1
2 r
50RS
7/2M8
2.1
yr.
(1)
Here,αis the disc viscosity parameter,ηis the accretion efficiency, andris the accretion disc radius (assumed to be 50RSfor optical disc emission). The value oftinfl may be a several times shorter based on magnetohydrodynamical simulations (e.g. Krolik, Haw-ley & Hirose2005), but this is still too long to explain the contin-uum variability of all sources presented here (see the appendix for the individual physical parameters andtinflestimates). The source J022652.24−003916.5 has a relatively low mass and therefore is expected to have a relatively shorttinfl of∼56 yr, still an order of magnitude too long to explain the observed optical variability. Furthermore, LaMassa et al. (2015) point out thattinfl should be considerably longer in the dim state sincetinfl∝λ−Edd2, and thus the
dimming time-scale should be shorter than the recovery time-scale. However, the S82 light curves suggest the opposite behaviour: the objects with appearing BELs show brightening on much shorter time-scales than is plausible for the optical viscous time-scale in the dim states of these AGN.
Nevertheless,tinfl might still be an appropriate time-scale if the optical flux contains reprocessed emission from the EUV, where
tinfl may be orders of magnitude shorter. In the disc reprocessing scenario, the disc surface is irradiated by EUV/X-ray photons com-ing from a central source on the light travel time-scale, and the re-emitted UV/optical flux can vary on the shorter time-scales asso-ciated with the central region. This ‘lamp post’ model (e.g. Berkley, Kazanas & Ozik2000; Martocchia, Matt & Karas2002) is sup-ported by observations of quasar microlensing (e.g. Morgan et al. 2008; Mosquera et al.2013; MacLeod et al.2015), which show that the X-rays originate from projected radii near the inner edge of the accretion disc. Indeed, multiwavelength observations of NGC 4051 indicate that∼25 per cent of the UV variance is caused by thermal reprocessing (Alston, Vaughan & Uttley2013). In the disc reprocessing model of Cackett et al. (2007), the disc temperature
T0at a fiducial radiusR0is regulated by both local viscous heating and irradiation:
T4
0 =T
4 infl+T
4 irr=
3GMBHM˙ 8πσ R3
0
+ LX(1−A)h 4πσ R3
0
, (2)
whereLXis the lamp post luminosity at a heighthabove the black hole, andAis the disc albedo. In this case, the temperature–radius profile of the disc would rise and fall with changes in either local accretion rate or irradiation, and this would produce a difference spectrum that remains anfν∝ν1/3power law (Cackett et al.2007), similar to what we observe in the objects presented here. Note that the fraction of reprocessed flux that is re-emitted towards the interior of the disc can modify its internal structure, but this effect is negligible unlessLXis similar to the bolometric luminosity of the quasar (Collin2001).
5.3 Variable obscuration?
In the case of variable extinction, a passing cloud may obscure the BLR on a characteristic crossing time-scaletcross. In the simplest scenario, such an event must account for the disappearing BELs and thermal continuum. One possibility is a passing isolated BLR cloud obscuring the continuum emitting region as seen by us and by the (remainder of the) BLR. While this scenario is viable in the X-rays where the continuum emitting source is relatively compact
(e.g. Risaliti et al.2009), the UV/optical continuum emitting region being significantly larger makes this scenario less likely. But the time-scale for such a crossing event is reasonable:tcross,BLRcloud=
84M8−1/2L 3/4
44 d assuming a Keplerian orbit for a BLR cloud passing
atrorb=RBLR=2954RSM8−1L 1/2
44 in front of the continuum source,
where the latter has a radius rsrc = RBLR/60 (see equation 4 in LaMassa et al.2015).
Another possibility is that the entire UV/continuum emitting re-gion and BLR is obscured; this might be expected if the distribution of dust lying at the outskirts of the BLR is patchy (e.g. Nenkova et al.2008a,b; Elitzur2012). In this case, reasonable values would bersrc=RBLR=2954RSM8−1L
1/2
44 androrb=3RBLRfor dust atrorb
to obscure a significant portion of the BLR (LaMassa et al.2015). This givestcross,dust=24M−
1/2
8 L
3/4 44 yr.
Thetcrossestimates are listed in TableA1for each source. The
tcross, BLRcloud estimates are shorter than the observed brightening and dimming time-scales for all sources, but since the size and structure of BLR clouds is uncertain, these time-scales may be longer than predicted. Thetcross, dustvalues are too long to explain the light-curve behaviour of these sources but are in many cases of the same order as the observed time-scales. For example, the source SDSS J233317.38-002303.4 has the shortesttcross, dustestimate of 4.5 yr (based on the luminosity in the bright state), but the observed brightening happens over 2.7 yr in the rest frame (top panel of Fig. 4). For the densely monitored object J0225+0030, the predicted dust crossing time-scale is an order of magnitude too long to ex-plain the rebrightening around MJD=55500 (Fig.6). Nevertheless, we further investigate the plausibility of variable obscuration by considering simple dust reddening models.
5.3.1 Dust reddening test
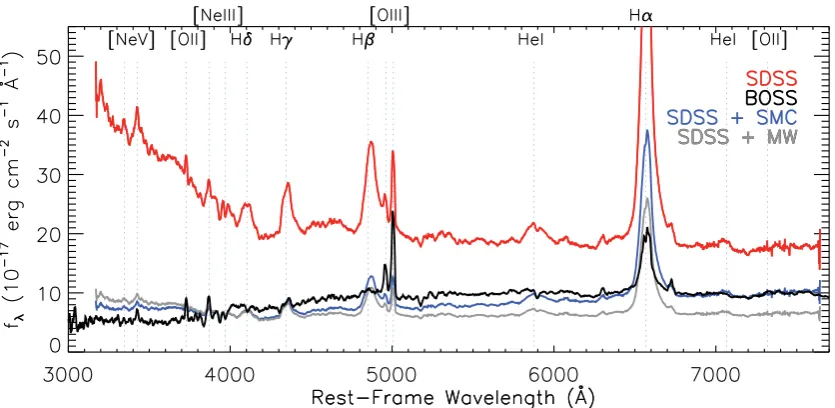
We consider whether an obscuration event can account for the spec-tral changes by applying dust reddening to the observed spectra. In particular, we simply apply Milky Way (MW) and Small Magellanic Cloud (SMC) dust reddening curves to the bright-state spectra and see whether we can reproduce the BEL disappearance in the faint-state spectra. This test is demonstrated here for SDSS J1021+4645, which has high quality spectra that show the most dramatic tran-sition from a type 1.0 AGN in SDSS to a type 1.9 AGN in BOSS among our objects.
Assuming the SDSS spectrum for SDSS J1021+4645 is the in-trinsic, unabsorbed flux, we estimateAV=0.95 by taking the magni-tude difference between the SDSS and BOSS spectra at the effective wavelength of the JohnsonVband. The SDSS spectrum is then mul-tiplied by a factor 10−Aλ/2.5, whereA
λ=E(λ−V)+AV,E(λ− V)=k(λ)E(B−V), andk(λ) is an extinction curve. For SMC-like extinction, we tried the four different models in table 5 of Gordon & Clayton (1998), which use the parametrization in equation 2 of Fitzpatrick & Massa (1990). We find that the AzV 214 model (RV= 2.75) produces an absorbed spectrum most similar to the observed BOSS spectrum among the four fits, and the result is shown in Fig.8. We also try an MW-like extinction curve (RV=3.1; Seaton1979), and assumeAV=0.95 as before. Note that the SDSS spectrum will contain a host galaxy component that is not modelled here. How-ever, we are not interested in reproducing the detailed continuum shape of the BOSS spectrum but rather the BEL change, so we leave a detailed spectral modelling for a future study as it is should not affect our final conclusions.
There are two points to note from the simple extinction tests in Fig.8. First, the SMC-like extinction curve does a better job than the
at University of St Andrews on April 27, 2016
http://mnras.oxfordjournals.org/
Figure 8. SDSS J1021+4645, showing a dramatic transition from a type 1.0 AGN in SDSS (shown in red) to a type 1.9 AGN in BOSS (shown in thick black). The red spectrum shows the observed SDSS flux; the grey and blue spectra show extinguished versions of the SDSS spectrum using an MW and an SMC extinction curve, respectively (see the text for details). Applying reddening to the SDSS spectrum is inadequate for reproducing the BOSS spectrum, such that a simple extinction scenario can be ruled out as an explanation for the transition.
MW-like extinction curve at removing the blue part of the continuum in the SDSS spectrum. Secondly, while the SMC-like extinction model can qualitatively explain the continuum change going from SDSS to BOSS, neither dust model can explain the disappearance of the BELs. In particular, the HβBEL remains prominent in the absorbed versions of the SDSS spectrum. This latter point is similar to what LaMassa et al. (2015) find for J0159+0033, where the observed HαBEL is much stronger than it should be if reddening alone is responsible for the spectral change. LaMassa et al. (2015) also find that archival X-ray spectra in the bright and faint states of J0159+0033 both appear unabsorbed.
We reach the same conclusion when repeating the above exercise for the other nine sources, using each pair of spectra listed in Table2: if reddening alone could account for the observed spectral changes, then the broad component of Hβshould be present in the faint-state spectrum on top of the host galaxy flux. However, the broad line flux is instead negligible in each case. Therefore, simple dust reddening models fail to simultaneously account for the diminished continuum and broad Balmer line components in all ten sources. In principle, one could employ a differentAVfor the BELs than for the continuum to explain the optical spectral change, but this leads to a more complicated physical scenario than we explore here.
6 C O N C L U S I O N S
We have presented the first systematic search for changing-look quasars using data from the SDSS and PS1 3π. Out of 6348 quasars from DR7Q that exhibit|g|>1 mag variability over the SDSS and PS1 photometric epochs, 1011 have been reobserved with BOSS. Of these, we visually identify 10 changing-look quasars, extending the known population of changing-look AGN toz=0.63.
Our search has yielded the following:
(i) four objects with appearing BELs corresponding to>1 mag increases in flux in theg-band;
(ii) five objects with disappearing BELs and declining light curves, which includes the changing-look quasar discovered in LaMassa et al. (2015), and an even more dramatic transition from a
type 1.0 to 1.9 AGN in the object J1021+4645 (with a flux deviation per spectral pixel of 8σfor Hβ);
(iii) one object showing evidence of both disappearing and ap-pearing BELs on time-scales less than a year in the quasar frame;
(iv) an SED of the variable component resembling thermal emis-sion from an accretion disc;
(v) that∼15 per cent of quasars that have varied by|g|>1 mag at some point in their light curve display changing-look behaviour on rest-frame time-scales of 3000–4000 d;
(vi) that a change in ionizing flux from the central engine coupled with disc reprocessing is a more likely explanation than variable obscuration in all cases, based on time-scale arguments and simple dust reddening models.
While the detailed physical mechanisms behind BEL changes may be complicated to understand and model, changing-look AGN can provide a laboratory to study the relationship between emission at different wavelengths, as the entire system may respond to a strong increase or decline in available ionizing flux. As a prime example, following an outburst in the X-ray emission in the local Seyfert NGC 2617, Shappee et al. (2014) were able to use the variability across several wavebands (spanning X-rays–NIR) to map out the structure of the accretion disc and argue for illumination of the disc by the X-ray source. The observations presented here support this scenario, although we cannot rule out a change in obscuration without more complex models for the structure and size of the intervening material.
Our results indicate that photometric variability might be one of the best ways to efficiently find changing-look quasars in current data sets. Furthermore, with well-sampled light curves provided by the S82 survey, extreme behaviour can be more readily identified, as demonstrated by the higher yield of changing-look objects from S82 presented here. Therefore, future time domain surveys such as the Large Synoptic Survey Telescope (Ivezic et al.2008; LSST Science Collaboration et al.2009), PS1 and PS2 (Chambers2014), as well as the ongoing All-Sky Automated Survey for SuperNovae (Shappee et al.2014), should provide excellent data sets in which to search for interesting targets for spectroscopic follow-up. Based on
at University of St Andrews on April 27, 2016
http://mnras.oxfordjournals.org/
the observations in Shappee et al. (2014) and LaMassa et al. (2015), extreme X-ray variability may also help identify changing-look AGN candidates among samples of extremely optically variable quasars. Furthermore, a multiwavelength monitoring campaign of these objects would be useful for interpreting the nature of such transitions. However, since it is unclear how rare these transitions are at any given time-scale, further work is necessary for determining the best strategy for follow-up monitoring. The TDSS project of SDSS-IV (Morganson et al.2015) has already initiated a similar search to the one presented here, extending the search criteria down tog> 0.7 mag, and should place more stringent limits on the frequency of such events. On the longer term, the Dark Energy Spectroscopic Instrument will survey∼2.4×10⁶ quasars (Levi
et al.2013), providing ample opportunity for obtaining additional spectroscopic epochs for highly-variable AGN.
AC K N OW L E D G E M E N T S
We acknowledge Marco Lam and Nigel Hambly for assistance with and maintaining the local PS1 DVO data base. We also acknowledge Isabelle Pˆaris for help with checking which of our objects were in the SDSS-III BOSS Quasar catalogue. We thank the reviewer for valuable suggestions that improved the paper. CLM acknowledges support from the STFC Consolidated Grant (Ref. St/M001229/1). NPR acknowledges support from the STFC and the Ernest Ruther-ford Fellowship scheme. KH acknowledges support from STFC grant ST/M001296/1.
Funding for the SDSS and SDSS-II has been provided by the Alfred P. Sloan Foundation, the Participating Institutions, the Na-tional Science Foundation, the US Department of Energy, the National Aeronautics and Space Administration, the Japanese Monbukagakusho, the Max Planck Society, and the Higher Ed-ucation Funding Council for England. The SDSS web site is http://www.sdss.org/.
The SDSS is managed by the Astrophysical Research Consor-tium for the Participating Institutions. The Participating Institu-tions are the American Museum of Natural History, Astrophysical Institute Potsdam, University of Basel, University of Cambridge, Case Western Reserve University, University of Chicago, Drexel University, Fermilab, the Institute for Advanced Study, the Japan Participation Group, Johns Hopkins University, the Joint Institute for Nuclear Astrophysics, the Kavli Institute for Particle Astro-physics and Cosmology, the Korean Scientist Group, the Chinese Academy of Sciences (LAMOST), Los Alamos National Labora-tory, the Max Planck Institute for Astronomy (MPIA), the Max Planck Institute for Astrophysics (MPA), New Mexico State Uni-versity, Ohio State UniUni-versity, University of Pittsburgh, University of Portsmouth, Princeton University, the United States Naval Ob-servatory, and the University of Washington.
Funding for SDSS-III has been provided by the Alfred P. Sloan Foundation, the Participating Institutions, the National Science Foundation, and the US Department of Energy Office of Science. The SDSS-III web site ishttp://www.sdss3.org/.
SDSS-III is managed by the Astrophysical Research Consor-tium for the Participating Institutions of the SDSS-III Collabo-ration including the University of Arizona, the Brazilian Partici-pation Group, Brookhaven National Laboratory, Carnegie Mellon University, University of Florida, the French Participation Group, the German Participation Group, Harvard University, the Instituto de Astrofisica de Canarias, the Michigan State/Notre Dame/JINA Participation Group, Johns Hopkins University, Lawrence Berkeley National Laboratory, MPA, Max Planck Institute for Extraterrestrial
Physics, New Mexico State University, New York University, Ohio State University, Pennsylvania State University, University of Portsmouth, Princeton University, the Spanish Participation Group, University of Tokyo, University of Utah, Vanderbilt University, Uni-versity of Virginia, UniUni-versity of Washington, and Yale UniUni-versity. The PS1 have been made possible through contributions of the Institute for Astronomy, the University of Hawaii, the Pan-STARRS Project Office, the Max-Planck Society and its participating insti-tutes, MPIA, Heidelberg and the Max Planck Institute for Extrater-restrial Physics, Garching, The Johns Hopkins University, Durham University, the University of Edinburgh, Queen’s University Belfast, the Harvard-Smithsonian Center for Astrophysics, the Las Cumbres Observatory Global Telescope Network Incorporated, the National Central University of Taiwan, the Space Telescope Science Institute, the National Aeronautics and Space Administration under Grant No. NNX08AR22G issued through the Planetary Science Division of the NASA Science Mission Directorate, the National Science Foun-dation under Grant No. AST-1238877, the University of Maryland, and Eotvos Lorand University (ELTE).
The CSS survey is funded by the National Aeronautics and Space Administration under Grant No. NNG05GF22G issued through the Science Mission Directorate Near-Earth Objects Observations Pro-gramme. The CRTS survey is supported by the US National Science Foundation under grants AST-0909182 and AST-1313422.
This research has made use of data obtained from the CSC, provided by the Chandra X-ray Center (CXC) as part of the Chandra Data Archive.
Facilities:SDSS, BOSS, and Pan-STARRS1.
R E F E R E N C E S
Abazajian K. N. et al., 2009, ApJS, 182, 543
Ai Y. L., Yuan W., Zhou H. Y., Wang T. G., Dong X.-B., Wang J. G., Lu H. L., 2010, ApJ, 716, L31
Aihara H. et al., 2011, ApJS, 193, 29 Alam S. et al., 2015, ApJS, 219, 12
Alston W. N., Vaughan S., Uttley P., 2013, MNRAS, 429, 75
Aretxaga I., Joguet B., Kunth D., Melnick J., Terlevich R. J., 1999, ApJ, 519, L123
Baldwin J. A., Burke W. L., Gaskell C. M., Wampler E. J., 1978, Nature, 273, 431
Becker R. H., White R. L., Helfand D. J., 1995, ApJ, 450, 559 Bentz M. C. et al., 2013, ApJ, 767, 149
Berkley A. J., Kazanas D., Ozik J., 2000, ApJ, 535, 712 Bischoff K., Kollatschny W., 1999, A&A, 345, 49 Bolton A. S. et al., 2012, AJ, 144, 144
Butler N. R., Bloom J. S., 2011, AJ, 141, 93 Cackett E. M., Horne K., 2006, MNRAS, 365, 1180
Cackett E. M., Horne K., Winkler H., 2007, MNRAS, 380, 669
Cackett E. M., G¨ultekin K., Bentz M. C., Fausnaugh M. M., Peterson B. M., Troyer J., Vestergaard M., 2015, ApJ, 810, 86
Chambers K. C., 2014, AAS/Division for Planetary Sciences Meeting Abstracts. 214.06
Clavel J. et al., 1991, ApJ, 366, 64
Cohen R. D., Puetter R. C., Rudy R. J., Ake T. B., Foltz C. B., 1986, ApJ, 311, 135
Collier S. J. et al., 1998, ApJ, 500, 162
Collin S., 2001, in Aretxaga I., Kunth D., M´ujica R., eds, Advanced Lectures on the Starburst-AGN Connection. World Scientific, Singapore, p. 167 Dawson K. et al., 2013, AJ, 145, 10
Dawson K. S. et al., 2015, preprint (arXiv:1508.04473) Denney K. D. et al., 2014, ApJ, 796, 134
Dexter J., Agol E., 2011, ApJ, 727, L24
Dietrich M., Hamann F., Shields J. C., Constantin A., Vestergaard M., Chaf-fee F., Foltz C. B., Junkkarinen V. T., 2002, ApJ, 581, 912
at University of St Andrews on April 27, 2016
http://mnras.oxfordjournals.org/