doi:10.4236/wsn.2011.31003 Published Online January 2011 (http://www.SciRP.org/journal/wsn)
Modeling of Node Energy Consumption
for Wireless Sensor Networks
Hai-Ying Zhou, Dan-Yan Luo, Yan Gao, De-Cheng Zuo
School of Computer Science and Technology, Harbin Institute of Technology, Harbin, China E-mail: {haiyingzhou, zuodc}@hit.edu.cn, {luody, gaoyan}@ftcl.hit.edu.cn
Received January 4, 2011; revised January 7, 2011; accepted January 9, 2011
Abstract
Energy consumption is the core issue in wireless sensor networks (WSN). To generate a node energy model that can accurately reveal the energy consumption of sensor nodes is an extremely important part of protocol development, system design and performance evaluation in WSNs. In this paper, by studying component energy consumption in different node states and within state transitions, the authors present the energy mod-els of the node core components, including processors, RF modules and sensors. Furthermore, this paper re-veals the energy correlations between node components, and then establishes the node energy model based on the event-trigger mechanism. Finally, the authors simulate the energy models of node components and then evaluate the energy consumption of network protocols based on this node energy model. The proposed model can be used to analyze the WSNs energy consumption, to evaluate communication protocols, to de-ploy nodes and then to construct WSN applications.
Keywords: Wireless Sensor Networks, Energy Model, Event-Trigger
1. Introduction
Currently, researches on the basic theories and system models of WSN (Wireless Sensor Networks) are not perfect, especially due to lack of a set of WSN models that can accurately reveal WSN characteristics [1]. Tra-ditional sensor networks address the system QoS, in which the node energy supply is unlimited and the en-ergy issue is not the main problem for its application [2]. In WSN applications, in views of limited power resource (batteries) and long lifetime requirement, the energy consumption becomes the core issue in WSN designs. Most of studies focus on the energy efficiency and opti-mization techniques for the design of WSN platforms, system software and protocols. Some WSN system mod-els and simulation technologies have been studied, but these studies generally focused on the development of simulation platforms and modeling of communication protocols, being lack of the basic system model for plat-forms and protocols. Some typical simulation tools and platforms, such as OPENET, NS2, SHAWN, SensorSim, EmStar, OMNet, GloMoSim, TOSSIM, PowerTOSSIM etc., are implemented basing on the traditional mathe-matical models of wireless network, which can not accu-rately reflect the features of WSN applications, resulting
in low precision simulation. In addition, current studies are lack of modeling of WSN energy consumption, and thus cannot evaluate the key performance indicator of WSN-system lifetime. Traditional energy modeling me-thod is to deduce the node energy consumption by ana-lyzing and modeling the energy consumption of each node module based on the theoretical energy consump-tion data or model of different modules. This method cannot analyze and evaluate the node energy situations from the views of the energy supply module (battery)
and the energy consumption modules, i.e., processor
module (PM), transceiver module (TM) and sensor mod-ule (SM), in different operation mode [3].
19
n
2. Node Energy Modeling
WSN nodes consist of several functional modules: Micro-processor, Transceiver, Sensor, and power supply modules. By studying the energy consumption issues of node com-ponents in different component states and during state transitions, this section presents the energy models of the processor module, communication module and sensing module of WSN nodes, and then establishes the node en-ergy model by adopting the event-driven mechanism.
2.1. Processor Energy Model (PEM)
1) Processor Operation State: The processor module is the node control and data processing center, being re-sponsible for sensor controlling, protocol communicating and data processing, and etc. The microprocessor nor-mally supports three operation states (sleep, idle, run) and has five state transitions [4], shown in Figure 1:
2) Processor Energy Function: Processor energy con-sumption
Ecpu is the sum of the state energy con-
Esumption and the state-transition energy
consumption , as in (1), while ,
-cpu state
Ecpu c-hange i1, 2,,mi is the processor operation state and m is the number of
the processor state ; j is the type
of state transition and n is the number of the
state-transition
m3
j1, 2,, ,
5
En .
1 1
( ) ( ) ( ) ( )
cpu cpu state cpu change
m n
cpu state cpu state cpu change cpu change
i j
E E
P i T i N j e j
(1)where is the power of state i that can be
found from the reference manual, and
cpu state
P i
cpu stateT i
j
is the time interval in state i which is a statistical variable that can be calculated in this processor energy model.
is the frequency of state transition j, and
cpu change is the energy consumption of one-time
state transition j. To simplify the processor energy
mod-eling, which can be expressed as in (2).
hange j
j
cpu change e cpu c N e( ) ( )( ( ) ( )) / 2
cpu change init end init end
[image:2.595.311.541.241.405.2]e j T j P j P j (2)
Figure 1. State transition diagram of PM.
where Pinit
j and Pend
j are the power of state initand end in the state transition j, is the time
interval for the state transition j from the init state to the
end state. The power of state transition is considered as the average power of state init and end.
init endT j
E
2.2. Transceiver Energy Model (TEM)
1) Transceiver Operation State: The communication module includes baseband and RF, being responsible for nodes data sending and receiving. The transceiver nor-mally has six states (Tx, Rx, Off, Idle, Sleep, CCA/ED)
and nine state transition [5], shown in Figure 2.
2) Transceiver Energy Function: Being similar to the processor energy function, Transceiver energy consum- ption (Etrans) is the sum of state energy consumption (Etrans-state) and state-transition energy consumption (Etrans-change). Etrans-state can be expressed as in (3).
1 1 1 1 / / / / ( ) TX RX TX RX
trans state TX RX Idle sleep CCA
N N
TX i RX i Idle Idle
i i
sleep sleep CCA CCA
N N
tr TX i tr RX i
i i
tr Idle Idle sleep sleep CCA CCA
E E E E E
P L R P L R P T
P T P T
V I L R V I L R
V I T I T I T
(3)where Ex, Px, Ix, and Tx are the energy consumption, the power, the electric current and the time interval of transceiver in state x. Vtr is the working voltage, Li is
the size length of the ithpacket of receiving or sending,
R is the data transferring rate, Ntx and Nrx are the total numbers of sending and receiving packets. Etrans-change
can be expressed as in (4), where , j is the
type of state transition and n is the number of the
state-transition (n = 9). trans c is the
fre-quency of state transition j, and
1, 2, ,
j
hange N j n
trans changee j
j
is the
energy consumption of one-time state transition j,
which can expressed as in (5).
1
( ) ( )
n
trans transition trans change trans change j
E N j e
(4)( ) ( )( ( ) ( )) / 2
( )( ( ) ( )) / 2
trans change init end init end
tr init end init end
e j T j P j P j
V T j I j I j
(5)
2.3. Sensor Energy Model (SEM)
sig-nal modulation, etc. The sensing module can operate either in burst or periodic mode.
In this paper, the sensing module is supposed to oper-ate in the periodic mode, in which sensors are opened and closed periodically and then the module enters the ‘on’ and ‘off’ states alternately. Supposing the energy consumptions of the ‘open’ and ‘close’ operations are constant, the sensor energy consumption (Esensor) can be expressed as in (6).
( )
sensor on off off on sensor run
on off off on s s s
E E E E
N e e V I T
(6)
where eon-off is the one time energy consumption of clos-ing sensor operation, eoff-on is the one time energy con-sumption of opening sensor operation, Esensor-run is the energy consumption of sensing operation. Vs and Is are the working voltage and current of sensors, Ts is the time interval of sensing operation, N is the number of sensor opening and closing operation.
2.4. Nole Energy Model (NEM)
In real systems, the processor, transceiver and sensor components of WSN nodes must work cooperatively to perform a task, and thus have mutual relationships espe-cially concerning with the energy issue.
[image:3.595.314.534.82.159.2]The node modules perform tasks and state transitions triggered by different external or internal events. When taking into account the origination of events, they can be classified into two types: events coming from outside and inside of the node energy model. The external events are triggered by external requests or commands, for example, external clock interrupts, sending packet requests, packet arriving action, channel detection commands and etc; the internal events are triggered by internal responses or ac-tions come, such as sending packet action, receiving packet action and periodical data collection. The node overall energy consumption model is shown in
Figure 2, and the event-driven mechanism of different node modules is as follows:
Event trigger in the sensor module: The sensor
en-ergy model (SEM) enters the ‘on’ state periodically triggered by the external clock event. After sensing and statistically calculating sensor energy con-sumption, the senor module enters ‘off’ state auto-matically.
Event trigger in the processor module: The
proces-sor energy model (PEM) enters the ‘run’ state trig-gered by the following three events: the periodical data collection event generated by the sensor energy model; the sending packet requests generated by external applications or protocols; the packet arriv-ing action generated by the transceiver energy
Figure 2. Event trigger mechanism of NEM.
model (TEM).
Event trigger in the transceiver module: The
trans-ceiver energy module (TEM) enters the ‘Tx’ state triggered by the sending packet event generated by PEM, enters the ‘Rx’ state triggered by the external packet arriving action, and enters the ‘CCA/ED’ state triggered by channel detection commands.
3. Simulation of Energy Models
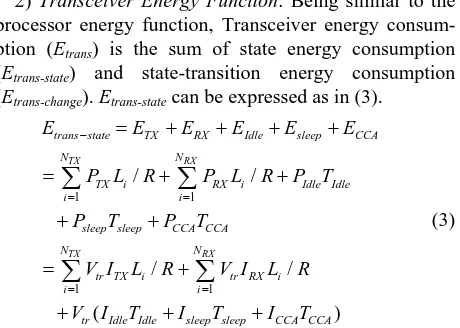
In order to simulate and evaluate the node energy model in OPENET simulation environment [6], we suppose a WSN node that consists of a Intel Strong ARM SA-1100 Microprocessor [7], a Chipcon CC2420 transceiver [8] and a Dallas digital temperature DS18B20 [9]. Table 1
presents the state power and state transition time of Intel Strong ARM SA-1100 and Table 2 lists the state current and state transition time of Chipcon CC2420. The work voltage (Vs) and current (Is) of DS18B20 are 5V and1mA, and the conversion time is 750 ms. Supposing the switch energy consumption of DS18B20 are eoff-on = 0.0002 J
and eon-off = 0.0001 J.
[image:3.595.308.538.578.717.2]In this simulation, the node model adopts the AODV routing protocol [10]. The simulation time length is set to 200 s: in 0 – 50 s, data is sent with 1s period; in 50 – 130 s, data is sent by Possion distribution with the expected value of 10 s; after 130 s, data is sent with 1s period. The range of wireless communication is 200 m. The analysis of en-ergy consumption is based on a random selecting node.
Table 1. State power and transition time of Strong ARM SA-1100.
State Power(mW)
Run 400
Idle 50
Sleep 0.16
State transition Class State transition time
Trun-idle 10 µs
Tidle-run 10 µs
Tidle-sleep 90 µs
Trun-sleep 90 µs
21
Table 2. State current and transition time of CC2420.
State Current
Ioff 0.02 µA
Itx 17.4 mA
Irx 19.7 mA
Iidle 426 µA
Icca/ed 17.4 mA
Isleep 20 µA State transition Class State transition time
Toff-idle 1 ms
Tcca/ed-idle 2 µs
Tidle-cca/ed 192 µs
Tsleep-idle 0.6 ms
Tidle-sleep 192 µs
Ttx-idle 2 µs
Tidle-tx 192 µs
Trx-idle 2 µs
Tidle-rx 192 µs
3.1. Simulation of PEM
This test is to evaluate the energy consumption tendency of PEM in different states. In the simulation results
shown in Figure 3, ARM SA-1100 consumes the energy
of 65J when running 200 seconds. The trend of PM en-ergy consumption depends on the processes tasks: packet transmission and route maintenance. PM has different energy consumption in different states: the Run one has a majority of energy consumption which determines the energy change trends, the Idle one follows and the SLEEP one is at least. Furthermore, the energy con-sumption for state transitions is very small, which is al-most negligible. Hence, increasing sleep time and low-ering power consumption in the state is the main solu-tions for reducing processor energy consumption.
3.2. Simulation of TEM
This experiment is to evaluate the energy consumption tendency of TEM in different states. Figure 4 explores that the system load conditions determines the trends of energy consumption, while the data packet sending has a great impact on the system loads. In this experimental load conditions, TM has the largest energy consumption in the RX state, followed by the TX state. The RX one has more than half of the total energy consumption, hav-ing the greatest impact on the energy trend curve. That because, in this experiment, all packets within the sens-ing area will be received by nodes and the node deter-mines to accept or discard the packet, so that the number of packet receiving is much greater than the number of packets sent. The energy consumption of TM is similar in the states of IDLE, CCA/ED and state transition, and the Sleep one is at least. Therefore, to meet the needs of
WSN applications, TM should adopts multi-hop short- range wireless communication, so that more nodes can be in the sleep state to reduce power consumption and to decrease the single-hop communication distance.
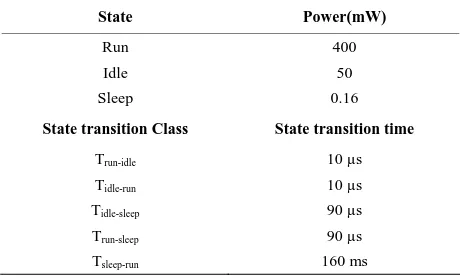
3.3. Simulation of SEM
This experiment compares the energy consumption of SM in different sensing periods (Ts = 5 s and 10 s).
Figure 5 indicates that the SEM energy consumption curve is a straight line, while the slope of the 10 s line is twice than the 5 s one, that is, the energy consumption in the 10 s period is twice than the 5 s one. Figure 5 further reveals that the energy consumption of SEM is inversely proportional to the sensing period, which has no related to the protocol and load traffics.
3.4. Evaluation of NEM
The experiment evaluates the influence of PM, TM and SM to the overall energy consumption of the node, and analyze the node energy consumption in certain circum- stances within different locations. This experiment adopts MSP430f149 microprocessor [11], CC2420 communica-tion module, and DS18B20 temperature sensor.
0 20 40 60 80 100 120 140 160 180 200 220 0
10 20 30 40 50 60 70
Energ
y
(J)
[image:4.595.331.515.393.538.2]Time(S) change_energy cpu_energy idle_energy sleep_energy run_energy
Figure 3. PEM state energy consumption.
0 20 40 60 80 100 120 140 160 180 200 220 -0.2
0.0 0.2 0.4 0.6 0.8 1.0 1.2 1.4 1.6 1.8 2.0 2.2 2.4 2.6
E
n
ergy
(J)
Time(S) CCA_energy idle_energy TX_energy sleep_energy RX_energy radio_energy change_energy
[image:4.595.324.519.435.706.2]0 20 40 60 80 100 120 140 160 180 200 220 0.00
0.01 0.02 0.03 0.04 0.05 0.06 0.07 0.08 0.09 0.10 0.11 0.12 0.13 0.14 0.15 0.16 0.17
En
erg
y(J)
[image:5.595.59.280.57.439.2]Time(S) sensor_10sec_energy sensor_5sec_energy
Figure 5. SEM energy consumption.
0 50 100 150 200 250 300
0.0 0.2 0.4 0.6 0.8 1.0 1.2 1.4 1.6 1.8
E
ner
gy(
J
)
Time(S) cpu_energy
node_energy radio_energy sensor_energy
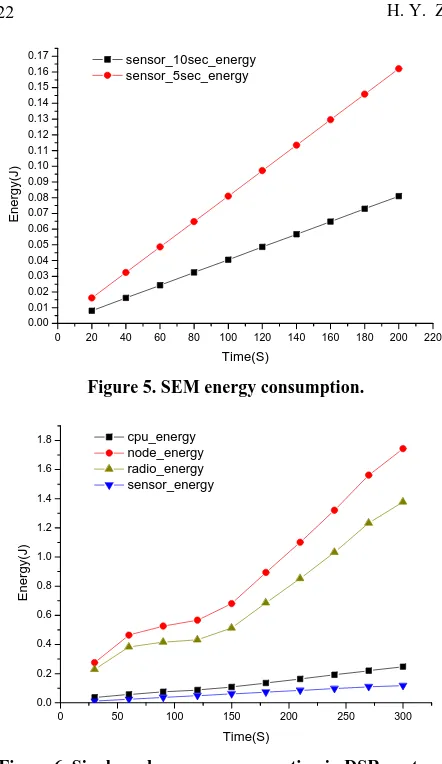
Figure 6. Single node energy consumption in DSR protocol.
[image:5.595.313.532.77.242.2]This experiment deploys a 1000 × 500 WSN sensing area within a random distribution of 20 nodes. The WSN nodes employ the routing protocols with DSR [12], the system tasks including sending data packets and main-taining routing protocol. The simulation time length is set to 300 s: from 0 – 50 s, data is sent with 3 s period; from 50 – 130 s, data is sent by a passion distribution with the expected value of 10 s; from 130 s to 230 s, data is sent with 1s period; from 230 – 300 s, data is sent by a passion distribution with the expected value of 5 s. The range of wireless communication is 200 m. The analysis of energy consumption is based on a random selecting node.
Figure 7 shows the energy consumption of node and modules under the DSR protocol, in which TM has the largest energy consumption, followed by PM, and SM has the least consumption. Hence, TM is the main energy unit in a WSN node. In DSR protocol, the energy consump-tion situaconsump-tion from node 0 to node 19 is shown in Figure 7, in which we can find that the edge nodes consume less energy than the center nodes because the center nodes carry more routing tasks in WSN networks.
0 5 10 15 20
0.6 0.8 1.0 1.2 1.4 1.6 1.8
Energy(J
)
[image:5.595.312.533.293.462.2]Node ID node_energy
Figure 7. Multi-node energy consumption distribution in DSR protocol.
0 5 10 15 20
0.6 0.8 1.0 1.2 1.4 1.6 1.8
Energy
(J
)
Node ID node_energy
Figure 8. Multi-node energy consumption distribution in DSR protocol.
4. Conclusion
23
5. Acknowledgements
The authors would like to thank all the colleagues and copartners who have contributed to the study. The work was supported by the grants from the Doctoral Fund of Ministry of Education of China (200802131024), the Harbin Science and Technology Development Funds (2009RFLXG009), the National Key Technologies R & D Program of China (No. 2011BAH04B03), and the In-ternational scientific cooperative research program of China (2010DFA14400).
6. References
[1] I. F. Akyildiz, W. Su, Y. Sankarasubramaniam and E. Cayirci, “Wireless Sensor Networks: A Survey,” Com-puter Networks, Vol. 38, No. 4, March 2002, pp. 393-422. doi:10.1016/S1389-1286(01)00302-4
[2] I. Howitt and J. Wang, “Energy Efficient Power Control Policies for the Low Rate WPAN,” Sensor and Ad Hoc Communications and Networks, Vol. 10, 2004, pp. 49-52.
[3] B. Han, D. Z. Zhang and T. Yang, “Energy Consumption Analysis and Energy Management Strategy for Sensor Node,” International Conference on Information and Automation, Proceedings of the 2008 IEEE, Vol. 6, 2008, pp. 211-214.
[4] F. Lu, G. Z. Xu and R. D. Ying, “Power Consumption Simulation Model Based on the Working Status of Intel PXA250 Processor,” Control & Automation, Vol. 21, No. 1, 2005, pp. 131-132.
[5] X. F. Wang, J. Xiang and B. J. Hu, “Evaluation and Im-provement of an Energy Model for Wireless Sensor Net-works,” Chinese Journal of Sensors and Actustors, Vol. 22, No. 9, 2009, pp. 1319-1321.
[6] X. Li, “Network Modeling and Simulation with OPNET Modeler,” Xidian University Press, Xi’an, 2006, pp. 1-15.
[7] Intel Corp., “Intel StrongARM SA-1100 Microproces-sor,” Developer’s Manual, August 1999.
[8] V. Tsiatsis, S. Zimbeck and M. Srivastava, “Architecural Strategies for Energy Efficient Packet Forwarding in Wireless Sensor Networks,” Proceedings of the 2001 In-ternational Symposium on Low Power Electronics and Design, Vol. 3, 2001, pp. 25-31. doi:10.1145/383082.383 102
[9] T. H. Jiang and Z. W. Jiang, “Characteristics and Appli-cation of the Digital Temperature Sensor DS18B20,” Electronic Technology, Vol. 12, 2003, pp. 46-49.
[10] Y. Bin and S. Bin, “Modify AODV for MANET/INTER- NET Connection through Multiple Mobile Gateways,” Advanced Communication Technology, Vol. 11, No. 3, 2009, pp. 1519-1523.
[11] Q. Yang, X. H. Chen and J. H. Shi, “Low Power Design of the Terminal Node for Wireless Sensor Network,” Journal of Xiamen University (Natural Science), Vol. 47, No. 3, 2008, pp. 357-358.