1
Modeling
p
N2 Through Geological Time:
Implications for Planetary Climates and Atmospheric
Biosignatures
E.E. Stüeken
1,2,3,4*, M.A. Kipp
1,4, M.C. Koehler
1,4, E.W. Schwieterman
2,4,5, B. Johnson
6, R. Buick
1,41. Dept. of Earth & Space Sciences and Astrobiology Program, University of Washington, Seattle, WA 98195, USA 2. Dept. of Earth Sciences, University of California, Riverside, CA 92521, USA
3. Department of Earth & Environmental Sciences, University of St Andrews, St Andrews KY16 9AL, Scotland, UK 4. NASA Astrobiology Institute’s Virtual Planetary Laboratory, Seattle, WA 981195, USA
5. Dept. of Astronomy and Astrobiology Program, University of Washington, Seattle, WA 98195, USA 6. School of Earth & Ocean Sciences, University of Victoria, Victoria, BC V8P 5C2, Canada
* corresponding author ([email protected])
Astrobiology, Volume 16, Number 12, doi: 10.1089/ast.2016.1537
Abstract
Nitrogen is a major nutrient for all life on Earth and could plausibly play a similar role in extraterrestrial biospheres. The major reservoir of nitrogen at Earth’s surface is atmospheric N2, but recent studies have proposed that
the size of this reservoir may have fluctuated significantly over the course of Earth’s history with particularly low levels in the Neoarchean – presumably as a result of biological activity. We used a biogeochemical box model to test which conditions are necessary to cause large swings in atmospheric N2 pressure. Parameters for our model are constrained
by observations of the modern Earth and reconstructions of biomass burial and oxidative weathering in deep time. A 1-D climate model was used to model potential effects on atmospheric climate. In a second set of tests, we perturbed our box model to investigate which parameters have the greatest impact on the evolution of atmospheric pN2 and
consider possible implications for nitrogen cycling on other planets. Our results suggest that (a) a high rate of biomass burial would have been needed in the Archean to draw down atmospheric pN2 to less than half modern levels, (b) the
resulting effect on temperature could probably have been compensated by increasing solar luminosity and a mild increase in pCO2, and (c) atmospheric oxygenation could have initiated a stepwise pN2 rebound through oxidative
weathering. In general, life appears to be necessary for significant atmospheric pN2 swings on Earth-like planets. Our
results further support the idea that an exoplanetary atmosphere rich in both N2 and O2 is a signature of an
oxygen-producing biosphere.
1. Introduction
Life as we know it is implausible without nitrogen. It is an essential major nutrient for all living
things because it is a key component of the nitrogenous bases in the nucleic acids that store, transcribe, and translate genetic information, a necessary ingredient of the amino acids constituting the proteins responsible for most cellular catalysis and at the core of the ATP molecule that is the principal energy transfer agent for biological metabolism. As nitrogen’s cosmic abundance is only slightly less than that of carbon and oxygen and because it condenses at moderate distances in circum-stellar disks, it should have been available to other potential exoplanetary biospheres. However, N2 gas, the most likely
nitrogen species near planetary surfaces in the habitable zone, is nearly inert at standard conditions because of the very
strong triple bond in N≡N. Lightning can break this bond and combine nitrogen with other atmospheric species, but on Earth this process has been relatively inefficient (Borucki and Chameides, 1984; Navarro-Gonzalez et al., 2001). Much more significant for removing N2 from Earth’s atmosphere is
microbial N2 fixation to ammonium, a reaction catalyzed by the
enzyme nitrogenase. Today, most of this fixed nitrogen is returned to the atmosphere via the biogeochemical nitrogen cycle, a series of microbially modulated redox reactions that ultimately transform organic nitrogen back to gaseous N2.
Thus, life’s demand for nitrogen regulates its atmospheric abundance.
Though N2 is not a greenhouse gas itself, its
2 warming by pressure broadening the absorption bands of such gases as water vapor, CO2, CH4, and N2O (Goldblatt et al.,
2009). Hence, the partial pressure of N2 indirectly influences
surface temperature and thus habitability. Moreover, a low total atmospheric pressure of all gases combined weakens the cold-trap for water vapor at the tropopause (Wordsworth and Pierrehumbert, 2014). Where N2 is a major atmospheric
constituent, a drop in pN2 can make the tropopause cold-trap
leaky (Zahnle and Buick, 2016), allowing water vapor into the upper layers of the atmosphere where it can either remain as vapor, perhaps increasing overall greenhouse warming (Rind, 1998; Solomon et al., 2010; Dessler et al., 2013) (but for a contrary view see Huang et al., 2016), or freeze as high-altitude ice clouds in polar regions, warming the high latitudes and making planetary climate more equable (Sloan and Pollard, 1998). Thus, planetary habitability is dependent, at least in part, on atmospheric nitrogen levels.
Though we know next to nothing about the evolution of the biogeochemical nitrogen cycles on other planets, we now have a better resolved picture of the behavior of nitrogen through Earth’s history (Ader et al., 2016; Stüeken et al., 2016; Weiss et al., 2016). It seems that (1) microbial nitrogen fixation evolved very early in Earth’s history such that a nitrogen crisis for the primordial biosphere was averted (Stüeken et al., 2015a; Weiss et al., 2016), (2) the partial pressure of atmospheric N2 has fluctuated through time to a greater
degree than previously anticipated (Som et al., 2016), (3) an aerobic nitrogen cycle arose before the Great Oxidation Event at ~2.35 Ga (Garvin et al., 2009; Godfrey and Falkowski, 2009), (4) during the mid-Proterozoic aerobic and anaerobic nitrogen cycling was spatially separated under low oxygen conditions (Stüeken, 2013; Koehler et al., in press), and (5) a modern nitrogen cycle with widespread aerobic activity did not arise until the late Neoproterozoic (Ader et al., 2014). The main constraints on these developments were evidently biological evolution and redox changes in Earth’s surface environments, principally the oxygenation state of the atmosphere and ocean (Stüeken et al., 2016). Other Earth-like planets may have evolved along somewhat similar pathways with respect to nitrogen cycling, provided that they also originated Earth-like life. If so, then atmospheric swings in pN2 may be a common
feature of terrestrial inhabited planets.
In the present study, we investigated the diversity of terrestrial planetary nitrogen cycles by modeling the evolution of Earth’s atmospheric N2 reservoir. We then perturbed the
model to examine several ahistorical extreme scenarios that could arise on Earth-like exoplanets, defined here as planets with a silicate rock mantle and iron core (empirically < 1.6 Earth radii in size, Rogers, 2015), an orbit within the conservative limits of the habitable zone (Kopparapu et al., 2013), and a similar volatile content to Earth. This conservative definition prescribes a high molecular weight atmosphere dominated by N2, CO2, and H2O rather than H2 (cf.
Pierrehumbert and Gaidos, 2011; Seager, 2013). After exploring a range of variables, we concluded that some combinations of N2 abundance with other gases could act as
extraterrestrial biosignatures, others could be “false positives,” and yet others may indicate that a planet is uninhabited. Overall, our results suggest that an anaerobic biosphere can greatly facilitate the removal of large amounts of N2 from a planetary atmosphere.
2. Model setup
2.1. Biogeochemical nitrogen box model
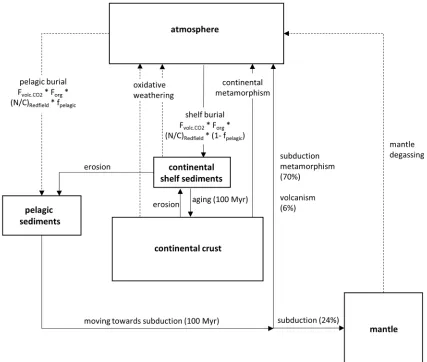
We used the Isee Stella software to construct a box model of the global biogeochemical nitrogen cycle (Fig. 1), tracking total nitrogen. Boxes included the atmosphere, pelagic marine sediments deposited on oceanic crust, continental marine sediments deposited on continental shelves and in epeiric seas, continental crust, and the mantle. Continental marine sediments were defined to become part of the continental crust after 100 million years and from there onwards were subjected to metamorphism, which returns nitrogen to the atmosphere. Similarly, we let pelagic marine sediments accumulate for 100 million years before they were subjected to subduction, metamorphism, and volcanism. These timescales were based on the observation that C/N ratios in sedimentary rocks older than about 100 Myr become more variable with higher average values (Algeo et al., 2014). The two sinks of nitrogen from the atmosphere were burial in pelagic sediments and burial in continental sediments with proportions of ~1:25 (Berner, 1982). The sources of atmospheric nitrogen were volcanic and metamorphic degassing of subducted pelagic sediments, metamorphism of continental crust, oxidative weathering of continents, and mantle outgassing. Denitrification was not explicitly included as a source, because we did not track the marine nitrogen reservoir.
The model was run in 1 million-year time-steps from 4.5 Ga to present. Differential equations listed in the appendix were solved with the Euler method. The chosen step size is much lower than the residence time of nitrogen in our modeled reservoirs (>100 Myr), which eradicates computational artifacts that can result in mass imbalances. The initial abundances of nitrogen in the mantle, continental crust, and sediments were set such that the concentrations were the same, assuming that any disequilibrium in concentrations observed today is due to biogeochemical overprinting. The rock masses and modern nitrogen inventories were taken from the work of Johnson & Goldblatt (2015). The initial abundance of atmospheric N2 is unknown.
We tuned the model such that the final atmospheric N2
abundance after 4.5 billion years equaled the modern amount of 2.87·1020 mol, defined as one time present atmospheric
3 A more detailed description of how rate constants were derived is given in the appendix. Following the work of Berner (2006b), nitrogen burial was parameterized through biomass burial (i.e., organic carbon). Although this approach neglects the origin and radiation of biological nitrogen metabolisms over Earth’s history (Stüeken et al., 2016), it is preferred because (a) it avoids major uncertainties about metabolic rates in deep time, and (b) it is sufficient for tracking the total nitrogen sink from the atmosphere. As further discussed below (Section 4.1), additional nitrogen burial through adsorption on clay minerals is negligible compared to the organic nitrogen flux into sediments. Using this approach, we calculated modern nitrogen burial from the modern volcanic CO2 outgassing flux of 6·1018 mol/Myr (Marty and
Tolstikhin, 1998), assuming that 22% (forg = 0.22) of
volcanogenic CO2 is buried as organic carbon in the absence of
land plants (pre-Devonian) (Krissansen-Totton et al., 2015), and that the C/N ratio of post-diagenetic marine biomass is
approximately 10 (Godfrey and Glass, 2011; Algeo et al., 2014). This gave a nitrogen burial flux of 1.32·1017 mol/Myr, equal to ~1.5% of modern biological N2 fixation (8.64·1018 mol/Myr)
(Galloway et al., 2004). We then modulated this flux in deep time in three different ways. First, we took into account secular trends in forg as inferred from the carbon isotope record (“Forg
model”) (Krissansen-Totton et al., 2015). Uncertainties in this record, resulting from potentially underrepresented carbonate reservoirs (Bjerrum and Canfield, 2004; Schrag et al., 2013) and the variance in δ13C values at any given time
point, are discussed below. Second, we assumed a gradual decline in CO2 outgassing from the Hadean to the modern,
following the parameterization of Canfield (2004, Equ. 2) (“Forg
+ Heatflow model”). By mass balance, higher CO2 outgassing in
[image:3.612.95.522.79.441.2]the earlier Precambrian implies higher burial fluxes of biomass and with it nitrogen. Uncertainties and caveats of this approach are discussed below. Third, we tested for the effects of additional two-fold increases in CO2 input, and hence
4 nitrogen burial, during superplume events (Abbott and Isley, 2002) (“Forg + Heatflow + Superplume model”). This model did
not include potential N2 addition through enhanced volcanism,
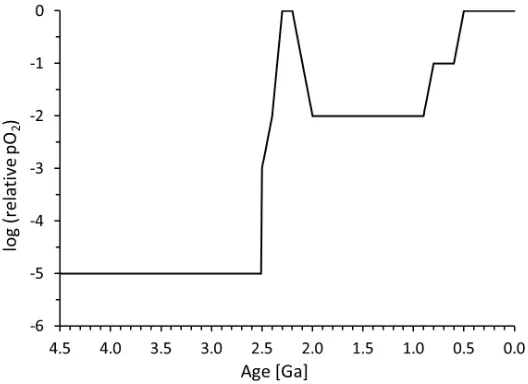
which we will discuss separately. In all of these models, oxidative weathering was implemented as a function of pO2
through time (Lyons et al., 2014) with a reaction order of 0.5, that is, proportional to (pO2)0.5 (Chang and Berner, 1999;
Bolton et al., 2006).
In a separate set of models, we tested hypothetical scenarios for Earth-like planets without any biosphere and an anoxic atmosphere, or with a completely anaerobic biosphere
that does not experience oxygenation events. Our definition of Earth-like planets includes an orbit within the habitable zone where liquid water can be stable at the surface, as well as a rocky composition and a volatile inventory similar to those of Earth (Section 1). This definition is admittedly limited, but it allows us to identify with greater confidence a subset of parameters that can play a critical role in the history of the nitrogen cycle. We assumed abiotic nitrogen burial was driven by NH4+ adsorption on clay minerals after abiotic N2 reduction
[image:4.612.78.548.81.420.2]in the atmosphere. Rates were taken from the work of Stüeken (2016) for two extreme end-members corresponding to high
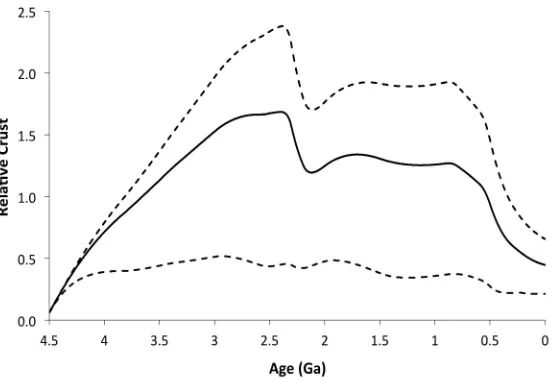
Figure 2: Reconstructing nitrogen burial over Earth’s history. Arrows mark pN2 value inferred for proxies (Marty et al., 2013;
Som et al., 2016). (a) Base model. N burial is held constant, calculated as the product of volcanic CO2 outgassing, the
pre-Devonian organic burial fraction (forg) of 0.22, and the inverse of the Redfield C/N ratio of 10. (b) Forg model. N burial is
modulated by secular changes in forg as inferred from the carbon isotope record (Krissansen-Totton et al., 2015). (c) Forg +
Heatflow model. CO2 outgassing is assumed to have declined gradually from the Hadean to the modern with decreasing
heatflow from Earth’s interior, as described by Canfield (2004). Carbon burial and with it nitrogen burial is changed in proportion. Mantle outgassing is modulated in the same way. (d) Forg + Heatflow + Superplumes model. Additional pulses of
CO2 outgassing are assumed during intervals of superplumes as recorded in the rock record (Abbott and Isley, 2002). Solid
black line = using best estimates for all parameters; dashed lines = most extreme uncertainty interval if all parameters are off in the same direction (excluding uncertainties in Redfield ratio and modern CO2 outgassing, Appendix A3); grey shaded
5 and low estimates of abiotic N2 fixation rates for the Archean
Earth and seawater pH of 5 and 8, respectively (see Appendix A1.1). For illustration, these burial fluxes are equal to 1.4·10-1 and 1.7·10-5 times the modern nitrogen burial described above. We did not test abiotic burial under oxic conditions because in that case NH4+ production would likely be low and
nitrogen burial trivial. For the "biotic anoxic" scenario, we used nitrogen burial rates equal to 1-10% of the modern biological N2 fixation rate. In both the abiotic and biotic anoxic model,
oxidative weathering was switched off.
Rate constants for oxidative weathering, metamorphism, erosion, subduction, volcanism, and outgassing were calculated as the ratio of modern fluxes to modern reservoir sizes (see Appendix for details). We further performed simple order-of-magnitude estimates of catastrophic events, such as impacts and large volcanic eruptions, to test whether these could affect our overall conclusions (Section 3.3)
2.2. Modeling effects on greenhouse gases & global climate
We selected the most extreme end-members of our Earth model to determine potential effects on Earth’s climate. As shown below, the timescales over which variations in pN2
can occur exceed those of the carbonate-silicate feedback cycle (Walker et al., 1981). Hence, changing pN2 alone is
unlikely to cause rapid climate changes, because pCO2 can
rapidly re-adjust to keep surface temperatures more or less steady. We therefore decided to calculate the required changes in pCO2 that would counterbalance the effects of
varying pN2. We used an iterative approach to determine the
pCO2 necessary to maintain a 278 K globally averaged surface
temperature (TGAT), equivalent to the estimated globally
averaged temperature during the last glacial maximum. This limit was chosen because geological evidence suggests that the Archean was cool (Hren et al., 2009; Blake et al., 2010) but not permanently glaciated (Young, 1991; de Wit and Furnes, 2016). As input values, we used the changes in nitrogen abundance shown in Section 3 (Fig. 2) and changes in solar luminosity from 3.5 Ga to 2.4 Ga. To do this, we used a 1D radiative convective model that was recently used to calculate habitable zone boundaries (Kasting et al., 1984; Kasting et al., 1993; Kopparapu et al., 2013) and characterize the surface temperature of a hypothetical Archean Earth with a global hydrocarbon haze (Arney et al., 2016). We chose a surface albedo of Asurf = 0.32, which is a tuning parameter used to
reproduce the temperature of modern Earth (Kopparapu et al., 2013; Arney et al., 2016). Our atmospheric composition consisted of only N2, CO2, H2O, and CH4, where the pN2 was
taken from our model output (Table 1) and CH4 was fixed at
pCH4 = 0.001 (fCH4, fCO2, fN2 and the total surface pressure P0
were adjusted self-consistently for changes in pCO2). The H2O
[image:5.612.130.504.504.690.2]profiles were calculated using a relative humidity profile
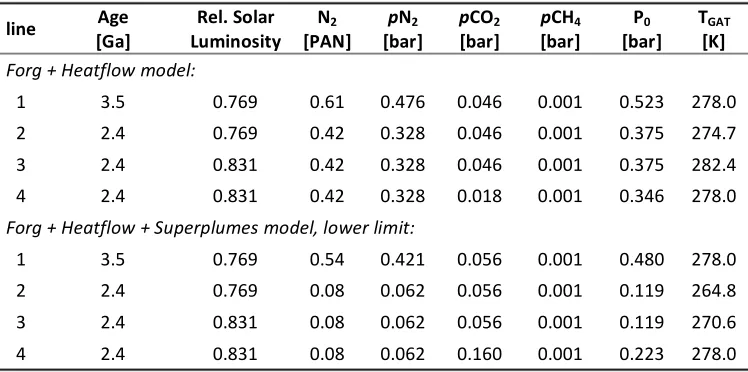
Table 1: Climate response to changes in atmospheric N2. Input data are the age, the corresponding relative solar luminosity taken from Bahcall et al. (2001), atmospheric N2 [PAN] calculated from our box model, and an assumed constant background
level of 1000 ppmv CH4. Partial N2 pressure (pN2) was calculated as the product of total N2 in units of PAN and the modern pN2
of 0.78 bar. Output parameters are TGAT (global average surface temperature), pCO2, and P0 (total average surface pressure,
i.e., sum of all gases). Line 1 = starting conditions at 3.5 Ga; line 2 = changing PAN with constant luminosity and constant pCO2
(taken from line 1); line 3 = changing PAN and luminosity with constant pCO2; line 4 = changing PAN, luminosity and pCO2.
Parameters are calculated such that the TGAT at (1) and (4) converges to 278 K.
line Age [Ga]
Rel. Solar Luminosity
N2
[PAN]
pN2
[bar]
pCO2
[bar]
pCH4
[bar] P0
[bar] TGAT
[K]
Forg + Heatflow model:
1 3.5 0.769 0.61 0.476 0.046 0.001 0.523 278.0
2 2.4 0.769 0.42 0.328 0.046 0.001 0.375 274.7
3 2.4 0.831 0.42 0.328 0.046 0.001 0.375 282.4
4 2.4 0.831 0.42 0.328 0.018 0.001 0.346 278.0
Forg + Heatflow + Superplumes model, lower limit:
1 3.5 0.769 0.54 0.421 0.056 0.001 0.480 278.0
2 2.4 0.769 0.08 0.062 0.056 0.001 0.119 264.8
3 2.4 0.831 0.08 0.062 0.056 0.001 0.119 270.6
6 assuming a surface relative humidity of 80% (Manabe and Wetherald, 1967). The solar luminosity at 3.5 and 2.4 Ga (0.769 and 0.831) was found through interpolation of Table 2 in the work of Bahcall et al. (2001). We focused on the pCO2 required
to maintain a TGAT > 278 K, noting that significantly lower
temperatures (TGAT < 273 K) may allow some open oceans, but
a 3D model would be needed to capture their additional
complexities (see Appendix A5 for limitations of our approach). Table 1 shows a summary of our results. We also indicate the surface temperature if pCO2 was not adjusted to
maintain TGAT = 278 K, but was maintained at the pCO2 value at
3.5 Ga, and if both the pCO2 and solar luminosity were
maintained at the 3.5 Ga values. Table 2 shows similar results as Table 1, but for a more permissive initial and final TGAT of
273 K. This illustrates the sensitivity of the required pCO2
adjustment to compensate for pN2 drawdown as a function of
the choice of reference temperature.
3. Results
3.1. Nitrogen burial constrained by carbon burial
We tested four different models for the evolution of nitrogen burial through geologic time (Fig 2). In our base model (Fig. 2a), nitrogen burial was held constant at its modern flux. Each subsequent iteration incorporates an additional parameter to the N burial record and, thus, shows additional atmospheric N drawdown. Sensitivity tests are presented in Section A3. The majority of the uncertainty range illustrated in Fig. 2 derives from uncertainties about rates of nitrogen loss during continental metamorphism.
3.1.1. Forg model
In the first test, the base model was modified by scaling nitrogen burial as a function of forg (organic carbon burial
fraction). This did not significantly change the evolutionary trend of the atmospheric nitrogen reservoir predicted by the base model, as forg has been relatively invariant through
geologic time (Fig 2b). During the largest burial event indicated
by the carbon isotope record, the Lomagundi Event at ca. 2.3-2.1 Ga, forg temporarily exceeds 0.3 (Precambrian baseline
~0.15-0.2). However, even this increase in organic burial alone appears to be insufficient to significantly deplete the atmospheric N2 reservoir by more than ~0.02 PAN. This model
shows a slow depletion of the atmospheric nitrogen reservoir during the Archean (from 1.0 to 0.81 PAN), and relatively constant atmospheric nitrogen during the Proterozoic (range 0.78 to 0.82 PAN). Modern atmospheric nitrogen levels are not attained until late in the Phanerozoic.
3.1.2. Forg + Heat Flow model
When we scale nitrogen burial proportionally to the amount of CO2 outgassing (Canfield, 2004), our model shows a
significant drawdown of atmospheric nitrogen during the Archean, reaching a minimum of 0.44 PAN (= 0.35 bar N2) in
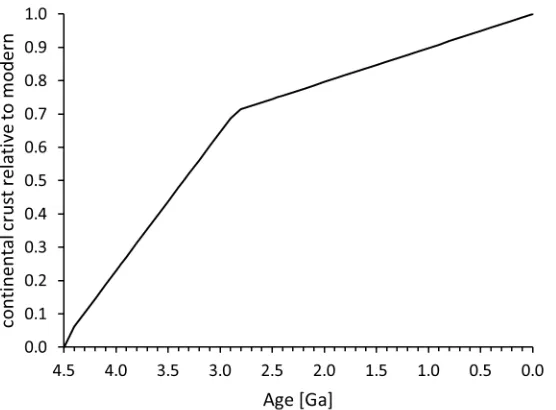
the earliest Paleoproterozoic, immediately prior to the Great Oxidation Event (GOE, Fig 2c). Fixed nitrogen is principally buried and stored in continental sediments and continental crust, which reach a maximum of 1.7× the modern continental reservoir size at this time (Section A2). During the GOE, the atmospheric nitrogen reservoir rebounds due to enhanced oxidative weathering of the continents, but this rebound stops after the GOE and atmospheric nitrogen remains low at
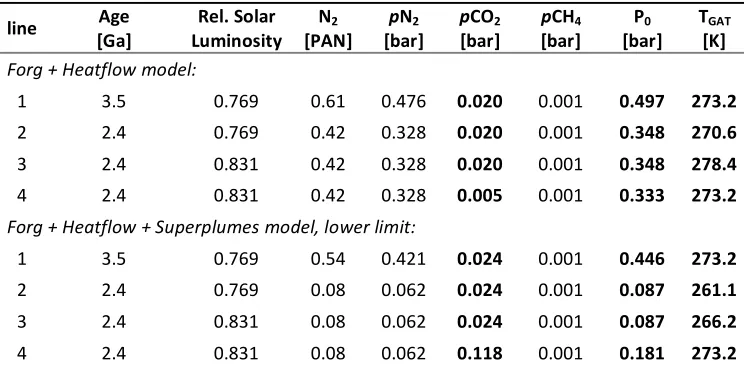
0.59-Table 2: Climate response to changes in atmospheric N2. Same as Table 1, but for a fiducial TGAT of 273.2 K at lines (1) and (4).
Differences from Table 1 are in bold.
line [Ga] Age Luminosity Rel. Solar N2
[PAN] [bar] pN2 p[bar] CO2 [bar] pCH4 [bar] P0 T[K] GAT
Forg + Heatflow model:
1 3.5 0.769 0.61 0.476 0.020 0.001 0.497 273.2
2 2.4 0.769 0.42 0.328 0.020 0.001 0.348 270.6
3 2.4 0.831 0.42 0.328 0.020 0.001 0.348 278.4
4 2.4 0.831 0.42 0.328 0.005 0.001 0.333 273.2
Forg + Heatflow + Superplumes model, lower limit:
1 3.5 0.769 0.54 0.421 0.024 0.001 0.446 273.2
2 2.4 0.769 0.08 0.062 0.024 0.001 0.087 261.1
3 2.4 0.831 0.08 0.062 0.024 0.001 0.087 266.2
[image:6.612.130.502.224.408.2]7 0.65 PAN (= 0.47-0.51 bar N2) until the Neoproterozoic
Oxidation Event (NOE). Atmospheric N2 rapidly rises during the
Neoproterozoic and Paleozoic in response to a further enhancement of oxidative weathering with the second rise of O2. The later Phanerozoic shows a slow gradual increase in
atmospheric N2. As discussed below, we consider this model
the most plausible mechanism for explaining a Neoarchean pressure minimum of 0.23 ± 0.23 bar as determined from
basaltic amygdales (Som et al., 2016).
3.1.3. Forg + Heat Flow + Superplumes model
Scaling up N burial by a factor of 2 during plume intervals (Abbott and Isley, 2002) resulted in a small but noticeable effect on the atmospheric nitrogen reservoir (Fig 2d). The effect is most pronounced during the longest superplume event in the geologic record, which is thought to have lasted from 2.775 to 2.696 Ga. Atmospheric nitrogen is drawn down to 0.42 PAN (= 0.33 bar N2) by 2.69 Ga in the wake
of this event, which is also consistent with basalt amygdale paleobarometry estimates for 2.7 Ga (Som et al., 2016).
To test the plausibility of greater burial enhancement factors, we explored the range from 1× to 10× burial enhancement during plume intervals. A 10× burial enhancement factor for superplume intervals caused the atmospheric nitrogen reservoir to become entirely depleted in the Neoarchean (0.0 PAN at 2.71 Ga), which is implausible
[image:7.612.100.531.186.475.2]because it would have driven the biosphere to near extinction by removing a major nutrient, or could have induced a global glaciation, for which there is no geological evidence at this time. We thus deemed 10× too extreme of a burial enhancement factor. Values less than 10× and greater than 1× are plausible, but given available data, it is difficult to derive accurate constraints. It is also quite possible that different plume events affected organic burial by different factors. Furthermore, as noted in Section 3.3, nitrogen outgassing from the mantle may have been more pronounced during
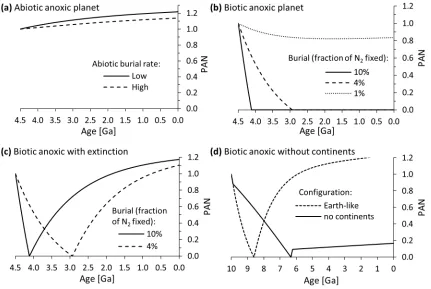
Figure 3: Hypothetical evolution of atmospheric N2 on extrasolar planets. (a) Abiotic anoxic planet where nitrogen burial is driven by NH4+ adsorption on clay minerals. High burial rate = 1.5·1016 mol/Myr, low burial rate = 2.2·1012 mol/Myr (Stüeken,
2016). (b) Biological anoxic planet without oxidative remineralization and weathering. Nitrogen burial is calculated as the product of the productivity factor and the modern biological N2 fixation rate on Earth of 8.6·1018 mol/Myr (Galloway et al.,
2004). (c) Biological anoxic planet with extinction of the biosphere upon atmospheric loss. (d) Anoxic biological burial and extinction as in panel c with and without burial on continental crust. The burial flux is set equal to 4% of modern biological N2
8 superplume events, offsetting the effect of enhanced carbon burial. This effect was not considered in our model. All of these complications make assessing the impact of plumes on the atmospheric nitrogen reservoir rather difficult. Still, it is worth noting that, even with a 2× burial enhancement, effects on the atmospheric nitrogen reservoir from plume events are small due to their short duration.
3.2. Atmospheric nitrogen evolution on abiotic and anoxic worlds
3.2.1 Abiotic anoxic planets
In the hypothetical scenario of a completely abiotic Earth-like planet in the habitable zone of another star with plausible abiotic nitrogen burial rates (Stüeken, 2016), the atmospheric nitrogen reservoir increased slightly from 1.0 PAN to 1.14 -1.22 PAN after 4.5 billion years, with no periods of atmospheric N2 drawdown (Fig. 3a). Catastrophic events such
as plumes would have little effect on such a planet because, as further discussed below (Section 3.3.2), most of the nitrogen liberated by such events on Earth is likely sourced from the crust that has been enriched in nitrogen due to biological burial. On an abiotic planet, the crust would be relatively depleted in nitrogen. The sensitivity of these trends to changes in surface and deep Earth nitrogen fluxes is given in the appendix (Section A4). Overall, we find no plausible mechanism that could cause large swings in pN2, apart from
the possibility of atmospheric erosion (e.g., Mars, Section 4.3) or freeze-out of N2 on planets far outside of the habitable zone
(e.g., Pluto). Although this modeled scenario is hypothetical, it emphasizes the potential importance of life for the evolution of the global nitrogen cycle.
3.2.2 Biotic anoxic planets
Our results for a hypothetical Earth-like planet with an anaerobic biosphere suggest that, under the right conditions, biological nitrogen drawdown can have a major effect on the evolution of atmospheric pN2 through time.
Nitrogen burial rates equal to 0.1 and 0.04 times the modern N2 fixation rate sequester atmospheric nitrogen to 0 PAN by
4.1 Ga and 2.9 Ga respectively (Fig. 3b). The minimum flux required to reach 0 PAN within 4.5 billion years is roughly 0.03 times modern biological N2 fixation, or 2 times the modern
nitrogen burial flux. As in the case of our “Forg + Heatflow”
model above, most of this nitrogen is stored in continental sediments and crust. A flux of 0.01 times modern biological N2
fixation does not completely draw down atmospheric N2, but
leads to a steady state of ~0.84 PAN (Fig. 3b). A more detailed sensitivity analysis of these simulations is presented in the Section A4. When other parameters are set to their most conservative values (i.e., minimizing N2 sequestration), a
fixation flux of ~0.13 times modern would be needed to draw down atmospheric N2 to 0 PAN. Again, this scenario is
hypothetical, but in comparison to our Earth model, it
emphasizes the important influence of atmospheric oxygen on the nitrogen cycle.
It is conceivable that a biosphere would go extinct when the atmospheric N2 reservoir becomes depleted and
triggers a global glaciation, at least if biological N2 drawdown
does not slow down dramatically as pN2 approaches 0 PAN
(e.g. Klingler et al., 1989). Of course, in reality, biogeochemical feedbacks that were not considered in our model may maintain a low, but non-zero, N2 reservoir in the atmosphere,
and the biosphere may not necessarily go extinct as evidenced by extreme glacial events on Earth. We nevertheless explored this case in our model, because it provides an estimate of how fast pN2 can recover on an anoxic planet in the absence of an
Earth-like atmospheric oxygenation event (cf. Figs. 2c, 2d). Our results show that in this case the buried nitrogen would return much more slowly through continental metamorphism and erosion than it does with oxidative weathering. We determined the recovery time of atmospheric pN2 after it is
completely sequestered by switching off biological nitrogen fixation once atmospheric N2 reached 0 PAN. With nitrogen
burial fluxes of 10% and 4% modern N2 fixation, it takes 2.76
Ga and 2.62 billion years respectively for atmospheric nitrogen values to recover to 1.0 PAN, assuming that the biosphere does not recover during that time (Fig. 3c). This is much slower than the increases in pN2 that occurred in our models over a few
hundred million years after the GOE and NOE on Earth, which highlights the linkage between pO2 and pN2 that is further
discussed below (Section 4.3).
To assess the effects of continental crust (the major nitrogen repository in our models), we ran a separate model where all burial was directed to pelagic sediments, that is, continents were bypassed to mimic a planet without an equivalent of continental crust. Burial fluxes were arbitrarily set to 4% times the modern fixation rate. Under these conditions, pN2 drawdown to 0 PAN is much slower (Fig. 3d),
because nitrogen in pelagic sediments has a much shorter residence time than in continental sediments and crust and is returned relatively rapidly through subduction zone metamorphism and volcanism. However, once atmospheric N2
has been sequestered in the mantle, it does not recover, even over a billion-year timescale. Although this model describes a purely hypothetical scenario of plate tectonics in the absence of continents, it demonstrates that a relatively shallow nitrogen repository akin to continental crust with an intermediate residence time between that of pelagic sediments and the mantle greatly facilitates large atmospheric
pN2 swings over hundreds of millions of years, as suggested for
the Precambrian Earth (Som et al., 2016).
3.3. Catastrophic events
9 atmospheric N2 reservoirs and, hence, our overall conclusions.
Possible events considered here include asteroid or comet impacts, superplume volcanism as an N2 source, and
large-scale planetary resurfacing.
3.3.1. Impacts
There are three ways impacts could affect the amount of nitrogen in a planetary atmosphere: direct nitrogen addition from the bolide, atmospheric erosion with loss of N2 to space,
and release of buried nitrogen through crustal heating. A variety of asteroids have substantial nitrogen contents. The most volatile rich are carbonaceous chondrites, which have 1235 ppm nitrogen on average (Wasson and Kallemeyn, 1988; Johnson and Goldblatt, 2015). If all nitrogen were released as N2 upon impact, then a hypothetical 3.2·1021 kg of
carbonaceous chondrites could contribute one PAN. Such a mass is about 0.05% of Earth’s mass, and is approximately equivalent to the once proposed total mass of late heavy bombardment material (Wetherill, 1975). Impacts later in the Archean, post-dating the late heavy bombardment, would have been several orders of magnitude smaller than 0.05% of Earth’s mass (Johnson and Melosh, 2012), and hence this nitrogen source was most likely trivial for atmospheric evolution.
Impact erosion has been proposed as an explanation for the thin atmosphere of Mars (Melosh and Vickery, 1989), but more recent calculations suggest that this mechanism may have been less effective than previously thought (Manning et al., 2009). The effect would further decrease with more massive planets than Mars; it is not generally considered to have been significant on early Earth. It is thus probably not a major nitrogen sink on most habitable Earth-like planets.
Large scale crustal heating resulting from impacts could add some nitrogen to the atmosphere (Wordsworth, 2016). Current estimates of nitrogen in continental crust suggest a mass of 1.7·1018 kg, or 0.5 PAN (Goldblatt et al., 2009; Johnson and Goldblatt, 2015). During the late Archean, when atmospheric pN2 may have been as low as 0.44 PAN (Section
3.1.2), the continental reservoir may have been as large as 1.7 times the present continental reservoir, though nitrogen concentrations in continental crust rocks through time are poorly constrained (Section A2). The nitrogen contained in oceanic crust and lithosphere is relatively minor (~0.57 to 0.67·1018 kg N) (Johnson and Goldblatt, 2015). To raise
atmospheric pN2 by more than 0.1 PAN through crustal
melting, more than 5% of the continental crust would have needed to melt in the Neoarchean and more than 20% in the modern. We consider this unlikely, because there is no geological evidence of such large-scale crustal melting events. We note, however, that some rock types, such as lower continental crust and the oceanic lithospheric upper mantle, are poorly characterized. There are suggestions that parts of the mantle may contain substantial nitrogen (Li et al., 2015),
and if a significant fraction of the mantle experienced melting, then large quantities of nitrogen could be added to the atmosphere.
3.3.2. Superplumes
Superplume events represent another type of mantle melting that may contribute to changes in atmospheric N2.
While typical mantle melts (i.e., MORB) have a very low nitrogen content of ~1 ppm (Marty, 1995; Marty and Zimmermann, 1999.; Johnson and Goldblatt, 2015), sparse data from continental basalts show higher concentrations. Basalts from the Abitibi region have 6 ppm nitrogen (Honma, 1996), Columbia River basalt has 34 ppm (BCR-1, Govindaraju, 1994), and recent Antarctic basalts around 60 to 100 ppm (Greenfield, 1991). Assuming that most nitrogen will degas during eruption, these concentrations suggest that substantial nitrogen could have been released during flood basalt eruptive events.
Fluid in equilibrium with basaltic melt under oxidizing conditions (fO2 = ∆NNO + 3) has approximately 104 times more
nitrogen than the melt itself (Li et al., 2015). Assuming all nitrogen contained in the fluid degasses, an eruption of 3·1018
kg basalt (equivalent to the Siberian Traps) with ~30 ppm nitrogen remaining in the basalt suggests a release of 1·1018 kg nitrogen, or 0.25 PAN. While measurements of nitrogen in flood basalts are quite rare, making this speculative, this simple calculation hints that these events could influence atmospheric N2 content. However, it is important to note that
10
3.3.3. Planetary resurfacing
If superplume events are extended to a planetary scale, as is suggested to have happened on Venus, even more nitrogen could be released. The area of the Siberian traps, to continue the above example, is 2.5·106 km2, or about 1/200th of the surface of Earth. Multiplying the above estimate for nitrogen released during Siberian Trap volcanism by 200 yields a nitrogen output of 2·1020 kg, or ~50 PAN. Again, we note that this is a highly speculative estimate, but it does suggest the possibility of substantial additions of nitrogen to the atmosphere via large scale volcanism on other planetary bodies that contain substantial amounts of nitrogen in the crust. Overall, catastrophic events could have more marked effects on planets where the crust is nitrogen-enriched, which, as noted above (Section 3.1.2, 3.2.2), is more likely to be the case on planets with a large biosphere that transfers atmospheric nitrogen to crustal repositories.
4. Discussion
4.1. The evolution of atmospheric pN2 on Earth
Although many parameters in the global biogeochemical nitrogen cycle are uncertain and potential reconfigurations of Earth’s interior are not taken into consideration for lack of quantitative constraints (Mikhail and Sverjensky, 2014), our results allow us to draw several broad conclusions under the assumption of persistent tectonic cycling through Earth’s history as follows:
1. The results from our base model (Fig. 2a), where nitrogen burial is held constant through time while oxidative weathering follows atmospheric pO2, show that the
oxygenation of the atmosphere alone could probably not have caused the large swings in atmospheric pN2 that were
suggested by Som et al. (2016). Changes in the atmospheric nitrogen reservoir by more than ~0.1 PAN most probably require a change in nitrogen burial over time.
2. Variations in nitrogen burial by up to a factor of 2.9, as inferred from the record of relative organic carbon burial (forg),
are insufficient to cause significant swings of more than ~0.2 PAN in atmospheric N2 (Fig. 2b). Even if we use forg values from
the upper end of the uncertainty range (Krissansen-Totton et al., 2015), the atmospheric N2 reservoir does not drop by more
than 0.3 PAN. If forg was smaller than assumed, due to a greater
proportion of carbonate formation in oceanic crust or within sediments (Bjerrum and Canfield, 2004; Schrag et al., 2013), this variable would have even less effect on atmospheric N2.
To reach atmospheric pressures of less than 0.5 bar at 2.7 Ga (Som et al., 2016), while maintaining pressures of 0.5-1.1 bar N2 at 3.5 Ga (Marty et al., 2013), nitrogen burial must have
been markedly higher in the earlier Archean than it is today. There are three possible scenarios to increase nitrogen burial: (i) subduction was more efficient than it is today and
metamorphic devolatilization was suppressed; (ii) nitrogen was buried preferentially relative to carbon; (iii) the absolute organic carbon burial flux was much higher, and with it the burial of carbonate, such that forg did not change. It is
conceivable that subduction was faster in the Archean (option i), but our sensitivity tests (Section A3) show that shortening the residence time of nitrogen in pelagic sediments by a factor of 2 has minimal effects on the atmospheric reservoir (<0.01 PAN), because the bulk of sedimentary nitrogen is recycled via metamorphism. Metamorphic devolatilization may have been enhanced in the Archean when the geothermal gradient was perhaps somewhat higher than today (Condie and Korenaga, 2010; Cartigny and Marty, 2013), but variations in this parameter also have minimal influence on the output of our model (Section A3). The effects of more rapid subduction and enhanced devolatilization may have more or less canceled each other without a net increase of nitrogen drawdown.
Preferential nitrogen burial (option ii) could potentially occur through adsorption of NH4+ onto clay
minerals. Boatman & Murray (1982) experimentally derived a relationship between the amount of NH4+ adsorbed on clay
and the dissolved NH4+ concentration in solution. For a
doubling of the total nitrogen burial flux, the adsorbed concentration would have to match the concentration of organic nitrogen. Shale samples of sub-greenschist metamorphic grade typically have nitrogen concentrations in the range of 100-1000 ppm with C/N ratios around 40, suggesting that most nitrogen is derived from organics (Stüeken et al., 2016). To achieve this concentration through NH4+ adsorption alone would require a dissolved NH4+
concentration of 3-30 mM, which is 30-300 times higher than the NH4+ concentration of the modern Black Sea (~ 100 μM,
Brewer and Murray, 1973), and 100-1000 higher than modern marine NO3- levels (~30 μM, Sverdrup et al., 1942). Such high
ammonium abundances are also inconsistent with the nitrogen isotope record, which suggests that N-limited ecosystems dominated by biological N2 fixation were initiated
in the Mesoarchean at 3.2 Ga (Stüeken et al., 2015a) and persisted until the GOE at ~2.35 Ga (Stüeken et al., 2016). A large reservoir of dissolved NH4+ should have resulted in
isotopic fractionations of up to 27‰ associated with partial NH4+ assimilation into biomass (Hoch et al., 1992; Pennock et
al., 1996), which is not observed. Moreover, due to the extreme energetic cost of splitting the N≡N triple bond, nitrogen fixation should have been suppressed rather than expressed where ammonium was readily available as a nutrient. Enhanced nitrogen burial through adsorption is further inconsistent with the record of C/N ratios, because significant addition of adsorbed NH4+ would require
11 to clays likely did occur during diagenesis, where NH4+ in pore
waters can become enriched to several mM by degradation of organic matter (e.g. Rosenfeld, 1979; Boudreau and Canfield, 1988), but in that case the adsorbed nitrogen is simply returned to the sediment from which it was derived and does not lead to excess nitrogen burial. Enhanced NH4+ adsorption
in the Archean ocean is therefore unlikely to have caused a drawdown in atmospheric N2. Instead, we find it more likely
that absolute organic carbon burial, and with it organic nitrogen burial, were significantly higher (option iii).
3. Enhanced volcanic CO2 outgassing in the earlier Precambrian
could explain greater nitrogen burial if accompanied by increased burial of both organic matter and carbonate. The observed constancy of forg could have been maintained
through carbonatization of oceanic crust as a large carbonate sink (Nakamura and Kato, 2004). Organic matter burial was likely concentrated under anoxic waters along continental margins where sedimentation rates were high. Such an enhanced biomass burial flux would have led to an increase in nitrogen burial and can thus explain the observation of low Neoarchean pN2 (Fig. 2c). Following the formulation of
Canfield (2004) for a higher heatflow and proportionally higher volcanic fluxes in deep time, this scenario increases the nitrogen burial flux by 40-80% (depending on the exact age) relative to our early Paleozoic base value, or 3.4-1.9 times above the forg factor alone, throughout most of the Archean.
We note that the assumption of a higher Archean CO2 flux
(Canfield, 2004; Zahnle et al., 2006) has been challenged by studies arguing for a gradual increase in CO2 outgassing from
the Archean into the Proterozoic, concurrent with late continental growth (Holland, 2009; Lee et al., 2016). However, if volcanic CO2 emissions were lower in the Archean than they
are today, absolute carbon burial would have been lower and with it the burial of nitrogen. Low Archean CO2 fluxes would
only be compatible with high nitrogen burial if forg had been
much higher than generally assumed. A high Archean CO2 flux
thus remains the most plausible mechanism in our model to explain a decline in pN2 from 0.5-1.1 bar at 3.5 Ga to <0.5 bar
at 2.7 Ga, as suggested by paleobarometers (Marty et al., 2013; Som et al., 2016). We will therefore proceed with this assumption, noting that the Archean CO2 flux requires
additional constraints to derive a more accurate trajectory for
pN2.
We further note that a higher absolute burial flux of organic carbon would constitute a source of oxygen equivalents that would have needed to be balanced by reductants to maintain anoxic surface conditions in the Archean (Kasting, 2013). Proposed fluxes of possible reductants (H2, CO, H2S, Fe2+) range over an order of
magnitude (reviewed by Zahnle et al., 2006; Holland, 2009) and could therefore plausibly cover the effect of carbon burial. Reductant fluxes may indeed have been higher than previously
suggested during the earlier Archean if new evidence for a secular increase in the redox state of Earth’s mantle is taken into account (Nicklas et al., 2015). A 2-to-4-fold higher carbon burial flux does therefore not necessarily violate redox balance models.
If we calibrate our model with the results of Som et al. (2016), who inferred an atmospheric pressure of <0.5 bar from the relative sizes of vesicles in basalt flows, then the lower part of our uncertainty range in Fig 2c is more likely to be correct than the upper part. In this case, our model predicts the lowest atmospheric pressure in the Neoarchean and two stepwise increases across the Paleoproterozoic and Neoproterozoic oxidation events, when oxidative weathering progressively shortens the residence time of nitrogen in continental sediments and crust. Our prediction of ~0.6 PAN (= 0.47 bar N2) in the Mesoproterozoic is testable with further
analyses of vesicle sizes in Proterozoic lava flows.
4. The effect of superplumes is difficult to assess; they could have led to either more rapid nitrogen recycling through crustal melting or slightly enhanced nitrogen drawdown through carbon burial. The balance may further depend on the redox state of magmas which may have changed over time in favor of progressively more N2 degassing (Mikhail and
Sverjensky, 2014). Overall, reconfigurations of the deep Earth are currently poorly constrained, but these could potentially have significant effects, beyond the scope of our model.
4.2. Climatic effects of atmospheric pN2 changes in the
Archean
Significant changes of >0.1 PAN in our modeled atmospheric N2 abundances occur over several hundred
million-year time scales (Fig. 2c,d). Although atmospheric pressure affects the greenhouse efficiency of other atmospheric gases like CO2 through pressure broadening
(Goldblatt et al., 2009) and can therefore theoretically cause changes in surface temperature, these time scales are so long that any resulting temperature change could be balanced by the carbonate-silicate feedback cycle, which has a response time on the order of a few hundred thousand years (Sundquist, 1991). As pN2 declines, greenhouse warming decreases,
causing the planet to cool. However, with lower temperatures, silicate weathering by carbonic acid slows down, which lowers the sink flux of atmospheric CO2 from the atmosphere (Walker
et al., 1981). CO2 would thus build up and balance the
temperature change caused by the drop in pN2.
Table 1 shows the required response in pCO2 to our
calculated drop in pN2 in the Archean. These calculations also
take into account the increasing solar luminosity, which warms the planet and therefore leads to a steady decrease in pCO2. In
sum, the effect of rising solar luminosity overpowers the effect of declining pN2 from 3.5 Ga to 2.7 Ga in our nominal model
12 decrease to maintain a stable surface temperature of 278 K. If
pCO2 did not respond, then surface temperature would
increase by about 4 degrees over this time interval due to the increase in solar luminosity, despite the drop in pN2. It is only
in cases of extreme nitrogen burial, that is, at the lower limit of our uncertainty interval in the model with an additional superplume (Fig. 2d, excluding potential effects of crustal melting), that the decline in pN2 would cause surface
temperature to drop by around 7.5 degrees. This drop could have been counterbalanced by a three- to five-fold increase in
pCO2. We note that all of our calculated values for pCO2 fall
within, or very close to, the range of late Archean CO2
pressures inferred from the rock record (0.003-0.15 bar at 2.5 Ga and 0.004-0.75 bar around 2.7 Ga, Sheldon, 2006; Driese et al., 2011; Kanzaki and Murakami, 2015). Although these estimates vary widely, this agreement suggests that our model results are not unrealistic. Overall, plausible changes in atmospheric pN2 as inferred from our model are unlikely to
have resulted in massive climatic perturbations. (We note that a requirement for globally averaged temperatures approaching modern values (~288 K) or higher throughout the Archean would be hard to reconcile with the most restrictive constraints on pCO2 from paleosols even without the climatic
impact of falling pN2, which is the well-known Faint Young Sun
Paradox. For all but our most extreme scenarios, falling pN2
would only negligibly exacerbate this problem.)
4.3. N2 in extraterrestrial atmospheres
Geological and potential biological processes on other planets may differ markedly from those on Earth, as might the initial volatile inventory. Our results can therefore only provide qualitative trends, but they may nevertheless serve as useful guidelines in evaluating measurements of atmospheric pN2 in exoplanetary atmospheres (Schwieterman
et al., 2015b). At the very least, our approach allows us to isolate selected variables that have the potential to play a major role in the evolution of a planet’s nitrogen cycle.
Most importantly, nitrogen burial under completely abiotic and anoxic conditions on an Earth-like planet within the habitable zone is likely to be trivial compared to mantle degassing, and hence an uninhabited Earth-like planet with a significant nitrogen inventory is unlikely to ever show low atmospheric N2 pressures (Fig. 3a). This conclusion may be
violated in a few cases as follows:
(a) On young, very hot (>1000 K), reducing planets, N2 may be
rapidly reduced to NH3 and dissolved in a magma ocean
(Wordsworth, 2016). This scenario could probably be ruled out by inferring the planetary temperature through measurements of infrared emission, examination of the planet’s atmospheric scale height to determine H2 abundance,
and/or observations of the host star to provide an estimate of the planet’s age.
(b) Atmospheric pN2 may be permanently low on planets that
have lost their atmosphere by erosion and where the outgassing rate is at least an order of magnitude lower so that the atmosphere cannot be replaced (e.g., modern Mars). In this case, however, the abundance of other atmospheric gases would also be very low, and the planet’s propensity to lose its atmosphere could be inferred from direct or indirect measurements of its mass and radius and therefore its surface gravity.
(c) Nitrogen burial could be more effective if abiotic N2 fixation
by volcanism, lightning, or impacts (Kasting and Walker, 1981; Kasting, 1990; Navarro-González et al., 1998; Mather et al., 2004) is at least an order of magnitude higher than estimated for early Earth. If the pH of the ocean on such a planet is significantly higher than 5, then even larger fixation rates would be required, because otherwise fixed NH4+ (produced
after conversion of NO3- to NH4+ via hydrothermal reduction)
(Brandes et al., 1998) would be returned to the atmosphere as NH3 gas instead of adsorbing onto mineral surfaces (Stüeken,
2016). NH3 gas quickly dissociates back to N2 under UV light
(Kuhn and Atreya, 1979). So far, a theoretical basis for unusually high extraterrestrial lightning rates is lacking. Enhanced volcanic activity may be detectable remotely through time-dependent observations of sulfate aerosols through transmission spectroscopy (Misra et al., 2015). (d) Planets may have had a large compositional deficit of nitrogen after the initial period of accretion and enhanced atmospheric erosion by stellar UV light (Lichtenegger et al., 2010; Wordsworth and Pierrehumbert, 2014). This scenario may be detectable through the abundance of other volatiles in the planet’s atmosphere or measurements of the nitrogen abundance in the host star (e.g. Brewer et al., 2016).
(e) Planets with a markedly lower oxygen fugacity in their mantle compared to that of Earth may not degas N2, because
mantle nitrogen may be stable as NH3 and thus less volatile
(Mikhail and Sverjensky, 2014; Li et al., 2015). But such planets may be discernable by the presence of CO rather than CO2 in
their atmospheres.
For planets that do not fall within the habitable zone, and thus are not covered by our model results, other scenarios could apply. For example, planets that are closer to the host star than the habitable zone that lack a surface ocean, such as Venus, would show insignificant nitrogen burial, and hence atmospheric N2 would increase as the mantle degasses. This
effect would be enhanced on planets with a high oxygen fugacity where N2 outgassing is favored over NH3 retention, as
proposed for early Venus (Wordsworth, 2016). Planets far beyond the habitable zone may have low atmospheric pN2 if
temperatures drop low enough for N2 to become liquid or
solid, such as on modern Pluto and possibly ancient Titan (McKay et al., 1993; Lorenz et al., 1997). Hence, pN2 can
13 planets within the habitable zone as considered in our model, abiotic N2 drawdown is much less likely.
A biosphere on a completely anoxic Earth-like planet can potentially have substantial effects on atmospheric N2 (Fig.
3b). A nitrogen burial flux equivalent to a few percent of modern biological N2 fixation rates (without oxidative
remineralization) may be sufficient to deplete the atmosphere of N2 if mantle outgassing rates are comparable to those of
Earth. In the absence of oxidative weathering, the only steady return fluxes of buried nitrogen back to the atmosphere would be metamorphism, volcanism, and mantle outgassing, and possibly catastrophic events (Section 3.3.2). It is important to note, however, that burial rates may be significantly different on planets that lack a surface reservoir equivalent to continental crust on Earth (Fig. 3d), which is able to take up and release atmospheric N2 on hundred-million-year
timescales.
Overall, our results strengthen the conclusion that the simultaneous presence of significant amounts of both N2
and O2 may be a biosignature and indicative of a biosphere
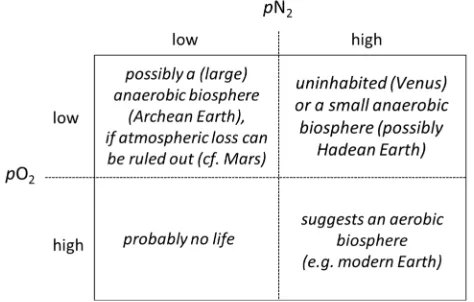
with oxygenic photosynthesis (Schwieterman et al., 2015b; Krissansen-Totton et al., 2016) (Fig. 4). As shown above, a large anaerobic biosphere that never "invents" oxygenic photosynthesis can draw down N2 to relatively low levels.
Hence, both O2 and N2 would be low. Atmospheric erosion and
the possibility of an unusually low mantle fugacity can be evaluated independently in such a scenario (e.g., Mars). On a completely abiotic planet orbiting in the habitable zone a Sun-like star, O2 can build up abiotically, but probably only under
the condition that non-condensible gases (including N2) are
present in low amounts (Wordsworth and Pierrehumbert,
2014). According to this model, water from a surface ocean would be able to enter the upper atmosphere where it would be photolyzed by UV, causing the H to escape and O to build up after surface sinks for oxidants are depleted. In this case, N2
must start and remain low, otherwise the process is halted. Hence, high levels of abiotic O2 would not co-exist with a thick
N2 atmosphere. (Though note the likelihood that abiotic O2
may be substantially higher for planets orbiting M dwarf stars due to other mechanisms not applicable to solar-type host stars (e.g. Harman et al., 2015; Luger and Barnes, 2015). A high-O2-low-N2 scenario is difficult to create biologically given
the strong tendency of oxidative weathering and increasing oxygen fugacity in the mantle to release N2 to the atmosphere.
An inhabited planet whose biosphere invents oxygenic photosynthesis could eventually transition to oxidative weathering, thereby initiating rapid recycling of buried nitrogen from continental crust as on early Earth (e.g. Fig. 2c). This is thus perhaps the only case where both N2 and O2 reach
high relative abundances in the atmosphere. In summary, (1) a planet with high pN2 and no O2 probably has either no
biosphere (e.g.,Venus) or a very small and/or young biosphere (e.g., first life on the Hadean Earth) that is incapable of transferring large quantities of nitrogen to the crust, (2) a planet with O2 but no N2 may be uninhabited, (3) a planet with
neither O2 nor high (modern) abundances of N2 may host an
anaerobic biosphere as exemplified by Archean Earth, provided that atmospheric erosion can be ruled out (cf. Mars), and (4) a planet with both significant N2 and O2 suggests the
presence a biosphere powered at least in part by oxygenic photosynthesis as on modern Earth. Low total N2 on an anoxic
planet (case 3) may be a weak biosignature, which could be confirmed through the detection of other biosignature gases or surface features (e.g. Des Marais et al., 2002; Pilcher, 2003; Domagal-Goldman et al., 2011; Schwieterman et al., 2015a).
5. Conclusion
The wide range of uncertainties in all our models, in particular about anything related to possible reconfigurations of Earth’s mantle (Mikhail and Sverjensky, 2014), prohibits firm conclusions. Nevertheless, our results allow us to isolate a few key parameters for the evolution of a planet’s nitrogen cycle and to formulate hypotheses about the evolution of atmospheric N2 reservoirs on Earth and other planets. Some
of these hypotheses may be testable with more constraints on nitrogen fluxes and with additional measurements of geological proxies for atmospheric pressure (Som et al., 2012; Marty et al., 2013; Glotzbach and Brandes, 2014; Kite et al., 2014; Som et al., 2016) (see Kavanagh and Goldblatt, 2015 for possible complications).
To first order, our results suggest that the greatest variability in atmospheric pN2 over the history of a planet can
[image:13.612.64.301.469.620.2]be achieved if the planet is inhabited, if biomass burial is highly variable, and/or if it experiences oxygenation events or
14 large-scale crustal melting. Other abiotic scenarios could be envisioned that could potentially lead to pN2 fluctuations, such
as N2 freeze-out or atmospheric loss, but many of these cases
would likely be discernable through other observations, in particular the orbit of the planet and the abundances of other gases. On an inhabited planet, variation in biomass burial can result from changes in the supply of metabolic substrates including CO2 (as on Earth, Fig. 2c,d) and N2 (as in potential
exoplanets, Fig. 3b). In the case of Earth, enhanced biomass burial in the Archean, followed by a stepwise shortening of the crustal residence time across the Paleoproterozoic and Neoproterozoic increases in oxidative weathering, could explain the drawdown and recovery of atmospheric N2
inferred from abundances of N2 in fluid inclusions at 3.5 Ga
(Marty et al., 2013) and the size distribution of basaltic amygdales at 2.7 Ga (Som et al., 2016). We note that there is no independent evidence of enhanced burial of both organic carbon and carbonate in the Archean, because total organic carbon (TOC) and carbonate contents of Archean sedimentary rocks are not known to be particularly high. This discrepancy may suggest that large amounts of carbon-rich sediments and carbonated basalts have been subducted and lost. If one were to reject our hypothesis of enhanced nitrogen drawdown into continental crust as a temporary reservoir, then another alternative possibility for explaining a low Neoarchean N2
pressure (Som et al., 2016) would be a much lower initial pN2
value in the early Archean, followed by a marked increase in mantle degassing at some time between the Neoarchean and the modern. A test with our “Forg” model suggests that such a
trajectory could be achieved if the mantle degassing rate were an order of magnitude higher throughout Earth’s history than thought (Busigny et al., 2011). However, this scenario would be inconsistent with proposed N2 pressures of 0.5-1.1 bar at
3.5 Ga (Marty et al., 2013). There is also no evidence for a major transition in the style or rate of mantle outgassing. But if such a transition occurred, it could conceivably be related to proposed changes in the mantle’s redox state (Mikhail and Sverjensky, 2014; Nicklas et al., 2015; Aulbach and Stagno, 2016). Further research is needed to evaluate this possibility.
Lastly, our results may have some practical implications for observations of extrasolar planets. Despite all the uncertainties in our models, our results suggest that an anaerobic biosphere can – under Earth-like geological conditions – remove significant amounts of N2 from the
atmosphere. If multiple terrestrial planets around another star started out with similar volatile contents, but one of them has a significantly lower atmospheric N2 abundance, then this may
potentially serve as a biosignature. Measurements of other gases may be necessary to rule out atmospheric erosion as on Mars. In contrast, a planet with an oxygenic biosphere that stimulates oxidative weathering could maintain an atmosphere rich in both N2 and O2, similar to the post-Archean
Earth. Our results thus support the idea that the combination
of N2 and O2 in an exoplanetary atmosphere may be a
signature of a biosphere that is capable of oxygenic photosynthesis (Wordsworth and Pierrehumbert, 2014; Schwieterman et al., 2015b; Krissansen-Totton et al., 2016).
Acknowledgements
We thank the NASA postdoctoral program (EES; EWS), the NSF Graduate Research Fellowship program (MAK), the NSF FESD program (grant number 1338810, subcontract to RB), the NSERC Discovery program (BJ), the NASA Exobiology program (grant NNX16AI37G to RB) and the NAI Virtual Planetary Laboratory at the University of Washington (solicitation NNH12ZDA002C and Cooperative Agreement Number NNA13AA93A; EWS, RB) for financial support. We thank Jim Kasting and two anonymous referees for numerous helpful comments that improved the manuscript.
References
Abbott, D.H. and Isley, A.E. (2002) The intensity, occurrence, and duration of superplume events and eras over geological time. Journal of Geodynamics 34(2): 265–307.
Ader, M., Sansjofre, P., Halverson, G.P., Busigny, V., Trindade, R.I., Kunzmann, M. and Nogueira, A.C. (2014) Ocean redox structure across the Late Neoproterozoic oxygenation event: A nitrogen isotope perspective. Earth and Planetary Science Letters 396: 1-13.
Ader, M., Thomazo, C., Sansjofre, P., Busigny, V., Papineau, D., Laffont, R., Cartigny, P. and Halverson, G.P. (2016) Interpretation of the nitrogen isotopic composition of Precambrian sedimentary rocks: Assumptions and perspectives. Chemical Geology 429: 93-110.
Algeo, T.J., Meyers, P.A., Robinson, R.S., Rowe, H. and Jiang, G.Q. (2014) Icehouse-greenhouse variations in marine denitrification. Biogeosciences 11(4): 1273-1295.
Arney, G., Domagal-Goldman, S.D., Meadows, V.S., Wolf, E., Schwieterman, E.W., Charnay, B. and Claire, M.W. (2016) The Pale Orange Dot: The Spectrum and Climate of Hazy Archean Earth. Astrobiology in press.
Aulbach, S. and Stagno, V. (2016) Evidence for a reducing Archean ambient mantle and its effects on the carbon cycle. Geology 44(9): 751-754.
Bahcall, J.N., Pinsonneault, M.H. and Basu, S. (2001) Solar models: Current epoch and time dependences, neutrinos, and helioseismological properties. The Astrophysical Journal 555(2): 990-1012.
Bauer, J.E. and Druffel, E.R. (1998) Ocean margins as a significant source of organic matter to the deep open ocean. Nature 392(6675): 482-485.
Bebout, G.E. (1995) The impact of subduction-zone metamorphism on mantle-ocean chemical cycling. Chemical Geology 126(2): 191–218.