https://doi.org/10.1007/s11538-019-00597-x
A Mathematical Framework for Modelling the Metastatic
Spread of Cancer
Linnea C. Franssen1 ·Tommaso Lorenzi1·Andrew E. F. Burgess2·
Mark A. J. Chaplain1
Received: 13 November 2018 / Accepted: 8 March 2019 © The Author(s) 2019
Abstract
Cancer is a complex disease that starts with mutations of key genes in one cell or a small group of cells at a primary site in the body. If these cancer cells continue to grow suc-cessfully and, at some later stage, invade the surrounding tissue and acquire a vascular network, they can spread to distant secondary sites in the body. This process, known as metastatic spread, is responsible for around 90% of deaths from cancer and is one of the so-calledhallmarks of cancer. To shed light on the metastatic process, we present a mathematical modelling framework that captures for the first time the interconnected processes of invasion and metastatic spread of individual cancer cells in a spatially explicit manner—a multigrid, hybrid, individual-based approach. This framework accounts for the spatiotemporal evolution of mesenchymal- and epithelial-like can-cer cells,membrane-type-1 matrix metalloproteinase(MT1-MMP) and the diffusible matrix metalloproteinase-2(MMP-2), and for their interactions with the extracellular matrix. Using computational simulations, we demonstrate that our model captures all the key steps of the invasion-metastasis cascade, i.e. invasion by both heterogeneous cancer cell clusters and by single mesenchymal-like cancer cells; intravasation of these clusters and single cells both via active mechanisms mediated bymatrix-degrading enzymes(MDEs) and via passive shedding; circulation of cancer cell clusters and single cancer cells in the vasculature with the associated risk of cell death and disaggregation of clusters; extravasation of clusters and single cells; and metastatic growth at distant secondary sites in the body. By faithfully reproducing experimental results, our simu-lations support the evidence-based hypothesis that the membrane-bound MT1-MMP is the main driver of invasive spread rather than diffusible MDEs such as MMP-2.
LCF is funded by the Engineering and Physical Sciences Research Council (EPSRC). MAJC gratefully acknowledges the support of EPSRC Grant No. EP/N014642/1 (EPSRC Centre for Multiscale Soft Tissue Mechanics with Application to Heart & Cancer).
B
Linnea C. Franssen [email protected]Keywords Metastatic spread·Mathematical oncology·Tumour microenvironment· Individual-based model·Multigrid framework
1 Introduction
Most solid tumours start with mutations of key genes either in one or in a small group of the more than 1013healthy cells in the human body (Bianconi et al.2013). Abnormally rapid cell proliferation is one of the most notable results of these acquired cancerous mutations, which can lead to the formation of a small nodule of cancer cells. Over time, this nodule can expand, while acquiring increasingly aggressive mutations, into a full avascular tumour with a diameter of up to approximately 0.1–0.2 cm (Folkman1990), limited by the diffusion of nutrients (e.g. oxygen). For successful growth beyond this size, the cancer cells start recruiting new blood vessels by secreting chemicals, which are collectively known astumour angiogenic factors(TAFs) (Folkman and Klagsbrun 1987). This neovascularisation process is called(tumour-induced) angiogenesis. The resulting vasculature serves the tumour’s increased metabolic needs by transporting the required nutrients. The newly formed blood vessels additionally benefit the tumour in the subsequentvascular growth phase, when the cancer cells become invasive so that gradients in nutrients, oxygen andextracellular matrix(ECM) drive cancer cells away from the primary tumour mass. In the event that cancer cells successfully intravasate into the newly grown blood vesselsandsurvive in the vessel environment (where they are exposed to risks such as attacks by the immune system and shear stress in the blood flow), they can extravasate and relocate at distant sites in the body. At these new sites, nutrients and space are less of a limiting factor to growth. The described sequence of steps of successful relocation of cancer cells from a primary location to a secondary location is known asmetastatic spread. It can lead to the formation of secondary tumours, calledmetastases, at sites in the body away from the primary tumour. In the first instance, however, the successfully extravasated cancer cells occur either as singledisseminated tumour cells(DTCs) or as small clusters of cancer cells, calledmicrometastases. These DTCs and micrometastases may remain dormant but have the potential to proliferate into vascularised metastasesat the metastatic sites at some later point in time. The full process we have described here, which is shown schematically in Fig.1, is also known as theinvasion-metastasis cascade(Fidler2003; Talmadge and Fidler2010).
Fig. 1 Schematic overview of the invasion-metastasis cascade. Single mesenchymal-like cancer cells and heterogeneous clusters of mesenchymal- and epithelial-like cancer cells break free from the primary tumour and invade the surrounding tissue (top left). They can intravasate via active MDE-mediated and passive mechanisms (upper left, along epithelium of the vessel). Once in the vasculature, CTC clusters may disag-gregate (centre) and CTCs may die. Surviving cells may extravasate via the walls of the microvasculature to various secondary sites in the body. Successful colonisation there is rare but can result in either DTCs or micrometastases (bottom right), which have the potential to develop into full-blown metastases (Colour figure online)
The invasion-metastasis cascade is a complex biological process, and many ques-tions about its details remain unanswered to date. Mathematical modelling can therefore be a useful tool to capture and unravel this complexity, and to thereby gain a better understanding of the invasion-metastasis cascade. Ultimately, predictive mod-elling may help to advance treatment success through personalised medicine.
[image:3.439.53.386.49.309.2]are mediated bymatrix-degrading enzymes(MDEs), and via passive shedding; cir-culation of cancer cell clusters and single cancer cells in the vasculature with the associated disaggregation of clusters and risk of cell death; extravasation of clusters and single cells; and metastatic growth at distant sites in the body. We verify the bio-logical accuracy of our model by varying key model parameters and checking results against biological findings. We specifically find that the co-presence of epithelial-like and mesenchymal-epithelial-like cancer cells enhances local tissue invasion and metastatic spread. Furthermore, by reproducing experimental results, the simulations support the evidence-based hypothesis that the membrane-boundmembrane-type-1 matrix metal-loproteinase(MT1-MMP) is the main driver of invasive spread rather than diffusible MDEs such asmatrix metalloproteinase-2(MMP-2), in particular when we switch from diffusion-dominated to haptotaxis-dominated cancer cell invasion.
The remainder of the paper is organised as follows. In Sect. 2, we summarise the key steps of the invasion-metastasis cascade and the roles of different cancer cell phenotypes in more detail. In Sect.3, we introduce our general mathematical modelling framework of metastatic spread. As part of introducing this new modelling framework, we give an overview of previous models of both cancer invasion and metastasis at the beginning of this section. In Sect.4, we explain how we set up the computational simulations and how we calibrated the model. In Sect.5, we present the simulation results. Finally, in Sect.6, we discuss the biological implications of our results as well as future work.
2 Biological Background
In this section, we describe the main steps of theinvasion-metastasis cascade(cf. Wein-berg2013) that can enable a small primary nodule of cancer cells to spread to distant sites throughout the body and then colonise at these secondary sites.
2.1 Local Cancer Cell Invasion
When the cancer cells are invading the tissue surrounding the primary tumour, they have to overcome structural obstacles. The cells need to make their way through the fairly rigid ECM, which mainly consists of various tissue-bound macromolecules such as structure-providing collagens (mainly of type-I), as well as of fibronectin, vit-ronectin and laminin, which influence the spreading, motility and adhesion of cancers cells. Often, the cancer cells additionally have to penetrate the even more rigid basal laminae of blood vessels and potentially of the primary sites they originate from.
a process calledmesenchymal-amoeboid transition. This increases the morphological plasticity of the cells and enables them to squeeze through the collagen-like pores, instead of solely relying on ECM degradation for invasion.
However, it has been shown by Sabeh et al. (2009) that cancer cells cannot migrate unless the proteinases have cleared the collagen prevalent in normal tissue of its cova-lent cross-links, and that protease-dependent invasion on its own is a sufficient invasion mechanism. Therefore, we focus only on the mechanism of protease-dependent inva-sion throughout the rest of this paper.
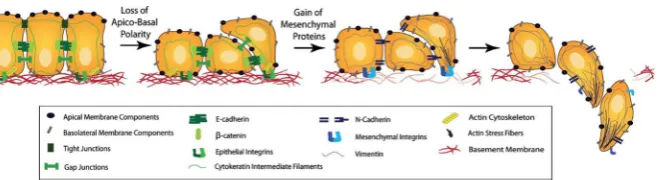
We distinguish between two cancer cell phenotypes—epithelial-like cancer cells and mesenchymal-like cancer cells. These cancer cell types arise due to an observed trade-off between a cell’s invasiveness and its ability to proliferate—this is also known as thego-or-grow dichotomy(Giese et al.1996). The mesenchymal-like cancer cells resemble mobile cells in embryo development and are therefore more motile. The mesenchymal-like cancer cells can also invade and intravasate as single cells. This is due to their loss of cell–cell adhesion as well as their expression of MDEs, such as the membrane-bound MT1-MMP and the diffusible MMP-2. Epithelial-like cancer cells, on the other hand, cannot invade effectively without the coexistence of MDE-secreting mesenchymal-like cancer cells. This is because the cancer cells with an epithelial-like phenotype do not express MDEs. They are also comparatively less motile. How-ever, the epithelial-like cell type is more proliferative and its role should not to be ignored in the invasion-metastasis cascade. Also, mesenchymal-like cancer cells have been suggested to be able to develop from epithelial-like cancer cells via a process termedepithelial-mesenchymal transition(EMT) (Kalluri and Weinberg2009), which is shown schematically in Fig.2. The reverse process,mesenchymal-epithelial transi-tion(MET), has additionally been suggested to be involved in metastatic spread, for instance by contributing to the colonisation of DTCs at secondary sites (Gunasinghe et al.2012).
Mesenchymal-like and epithelial-like cancer cells have been observed to invade most effectively in a setting where both cancer cell types are present. This gives rise to the hypothesis of a second protease-dependent invasion mechanism in addition to mesenchymal-like cancer cells invading individually.Collective migrationof cohesive cell cohorts has been shown to be important for the invasion of cancer cells by Friedl et al. (2012), amongst others. The theory is that clusters consisting of cancer cells of heterogeneous phenotypes may invade the ECM together. Figure1provides a scheme of the invasion of single mesenchymal-like cells versus collective groups of cells.
2.2 Intravasation
Fig. 2 Schematic representation of the EMT. As an outcome of EMT, the cell–cell adhesion between formerly epithelial-like cancer cells is reduced, while the cancer cells express more cell–matrix adhesion enhancing molecules such as cadherin. This combination of changes enhances invasiveness. Further, cancer cells become more potent at degrading the underlying basement membranes of organs and vessels, as shown towards the right of the figure, as well as the ECM in general. This allows the mesenchymal-like cancer cells to invade into the surrounding stroma. Reproduced from Micalizzi et al. (2010) with permission from Springer (Colour figure online)
happens by dissemination through the blood vessels (Wong and Hynes2006; Lambert et al.2017).
The exact mechanism of intravasation into the vasculature is still unclear. How-ever, the two main proposed biological intravasation modes—activeversuspassive intravasation—are likely not mutually exclusive, as suggested for instance by Caval-laro and Christofori (2001), Bockhorn et al. (2007) and Jie et al. (2017). Theactive intravasation hypothesis postulates that cancer cells crawl towards and into vessels actively with help of MDEs.Passiveintravasation, on the other hand, implies a more accidental shedding of cancer cells via newly formed, immature vessels, which are fragile and may collapse due to trauma or under the physical pressure caused by rapid tumour expansion.
The above-explained difference between more mesenchymal-like and more epithelial-like cancer cells together with this differentiation between active and pas-sive intravasation gives rise to three entry modes of cancer cells into the vasculature, which are further explained in Francart et al. (2018):
1. Single MDE-expressing mesenchymal-like cancer cells actively enter the blood vessels and thereafter disseminate as singlecirculating tumour cells(CTCs). 2. Cancer cells of epithelial and of mesenchymal phenotypes cooperate in the sense
that mesenchymal-like cells allow epithelial-like cells to enter the vasculature together with them, or shortly after them. Mesenchymal-like cells express the MDEs required to degrade the vessels’ basal laminae. This allows for co-invasion of the epithelial-like cancer cells in the vicinity. Thus, both mesenchymal-like and epithelial-like cancer cells enter the blood system jointly as a cluster.
3. Any single cancer cells or cancer cell clusters near a ruptured blood vessel intravasate via the passive entry mode.
[image:6.439.57.387.54.144.2]Fig. 3 Cancer cells in the blood system. Once single cancer cells or cancer cell clusters have intravasated, a number of mechanisms—both to aid the cancer cells (e.g. platelets covering cell surface, neutrophils that enhance extravasation through NET expression, and MMP secretion) and to destroy them (e.g. physical stresses; attacks by NK cells)—come into action. Reproduced from Lambert et al. (2017) with permission from Elsevier Inc (Colour figure online)
2.3 Travel Through the Vasculature and Extravasation
Successful intravasation into the vasculature by no means implies that the respective cancer cells will succeed in metastasising. Cancer cells encounter further obstacles in the bloodstream. In fact, as Fig.3shows, single CTCs and CTC clusters are exposed to physical stresses and are attacked bynatural killer(NK)cells. This causes cancer cell clusters to disaggregate, as shown in the centre of Fig.1, leading to smaller CTC clusters and an increased number of single CTCs. Also, it further leads to a significant decrease in the number of cancer cells that reach the metastatic site from the primary tumour.
[image:7.439.54.387.50.240.2]by Strilic et al. (2016) that cancer cells can induce necroptosis of healthy endothe-lial cells, as shown on the bottom right of Fig. 3, which allows the cancer cells to extravasate without TEM. More in-depth information on the biological background of extravasation can be found in Lambert et al. (2017).
2.4 Metastatic Spread and Colonisation
A successfully extravasated single cancer cell or cluster of cancer cells can either contribute to self-seeding to an existing metastasis or to the primary tumour, or it can settle as a potential initial seed of a new metastasis (Pantel and Speicher2016). However, even if a cancer cell has extravasated successfully into the parenchyma of a potential new metastatic site, success in growing into a full-blown secondary tumour is not guaranteed. In fact, to give a rough idea of the probability that a cancer cell, which has already intravasated successfully, will ultimately develop into a micro-or macrometastasis, we can quote the result of an experimental study by Luzzi et al. (1998). The authors investigated the proportions of melanoma cells that formed micro-and macrometastases after the cells were injected intraportally to target mouse livers. They found that 2.04% of the injected cancer cells formed micrometastases after 3 days but that after 13 days only 0.07% of the initially injected cancer cells were still present as micrometastases. Additionally, 0.018%±0.017% of initially injected cancer cells had formed macrometastases after 13 days. These survival probabilities for single CTCs, may, according to Valastyan and Weinberg (2011), even be an overestimation. CTC clusters were described to have between 23 and 50 times the metastatic potential of single CTCs (Aceto et al.2014). Note, however, that this is only a rough estimate and will depend on other factors such as the particular cancer cell lines and the secondary sites involved, as explained in detail below.
The main mechanisms by which successfully extravasated cancer cells are pre-vented from forming malignant secondary tumours are related to them being maladapted to their new microenvironment, as first suggested by the “seed and soil hypothesis” of Paget (1889). Hence, most cancer cells will be eliminated from the parenchyma at the secondary site. Others will stay at the distant site for periods lasting up to decades but will remain in a dormant state. They fail to proliferate at the sec-ondary site as they are, for example, actively inhibited by the immune system or fail to induce angiogenesis. These—at least transiently—indolent cancer cells can exist either as single DTCs or in the form of micrometastases.
Fig. 4 Metastatic progression of breast cancer. Circular chord diagram showing Markov chain network of data on metastatic spread from 4181 breast cancer patients over a 10-year period. Primary breast cancer is located on top with metastatic sites—including bone, lung and brain—ordered clockwise according to decreasing transition probability from the primary breast tumour. Chord widths at the ‘breast’ starting location represents one-step transition probabilities from the location of the breast to the respective secondary site. Further information on the exact data origin and patient criteria can be found athttp://kuhn.usc.edu/ breast_cancer/. Courtesy of Dr. Jeremy Mason, University of Southern California using the interactive tool published athttp://kuhn.usc.edu/forecasting—the corresponding publication is Newton et al. (2013) (Colour figure online)
an interactive figure, which shows typical metastatic spread patterns of a primary breast tumour after 10 years.
3 The Mathematical Modelling Framework
[image:9.439.54.388.53.386.2]and subsequently of metastasis. Throughout, we distinguish models which include onlylocal interactions between cancer cells and their environment and those that additionally capture interactions that arenon-localin space.
Several continuouslocalmodels formulated in terms of differential equations have been proposed. Following earlyordinary differential equation(ODE) models (Gatenby 1991,1995a,b), a first one-dimensional spatially explicit model was introduced in the seminal work by Gatenby and Gawlinski (1996). Their paper described spatiotemporal acid-mediated invasion using a system of reaction-diffusion-taxispartial differential equations(PDEs). Perumpanani et al. (1996) published a first model of several that considered random motility, haptotaxis and chemotaxis in the context of invasive can-cer cells interacting with MDEs, ECM proteins, normal cells and non-invasive cancan-cer cells. The model examined how deeply and at which speed cancer cells invaded the ECM when led by hapto- and chemotactic cues. Ambrosi and Preziosi (2002) proposed a model, in which a tumour spheroid was seen as a growing and deformable porous medium. Using this approach, they introduced a multiphase mechanical framework of tumour growth. A much-cited model focussing on haptotaxis is the continuum PDE model by Anderson et al. (2000), which to our knowledge was the first of its kind to extend modelling to a 2D setting. A number of subsequent continuum reaction-diffusion-taxis PDE models focussed on specific MDEs. An example is the work by Chaplain and Lolas (2005,2006), who studied the role of urokinase-type plasminogen activator, which is one of the proteolytic enzymes over-expressed in cancer cells, in cancer invasion. Work by Andasari et al. (2011) extended this modelling approach. Further, Deakin and Chaplain (2013) took a spatial approach to investigating the roles of membrane-bound MMPs such as MT1-MMP and of soluble MMPs like MMP-2.
Localmodels relying ondiscreteandhybridapproaches have also been proposed: for instance, individual-based models (IBMs) in Anderson and Chaplain (1998), Anderson et al. (2000) and Zhang et al (2009), cellular automata models in Kansal et al. (2000), Deutsch and Dormann (2005), Hatzikirou and Deutsch (2008) and Enderling et al. (2009), cellular Potts model approaches in Turner and Sherratt (2002), Popławski et al. (2009), Scianna et al. (2013), Kabla (2012), and Hallou et al. (2017), and hybrid-discrete continuum models in Anderson (2005), Rejniak and Anderson (2011) and Sfakianakis et al. (2018).
Gerisch and Chaplain (2008). Furthermore, they provided computational simulations illustrating the relative effects of cell–cell and cell–matrix adhesion on cancer invasion. Domschke et al. (2014) further developed the model by Gerisch and Chaplain (2008) to study the influence of cell–cell and cell–matrix adhesion on tumour growth and development in more depth. In particular, they introduced a subpopulation of cancer cells of a second type that was assumed to have grown to become more aggressive over time through mutations. A non-local multiscale PDE model for glioma invasion, which considered the clinically observed migration pathways of invading cancer cells along neural fibre tracts, was presented by Painter and Hillen (2013). This model made it possible to study the impact of fibre alignment on the cancer cells’ invasion pathways and to connect diffusion tensor imaging data to the model’s parameters.
example of how to use a mathematical model to examine the effects of the choice of treatment (chemotherapy and/or tumour resection) and of its timing. Scott et al. (2013) proposed a model of self-seeding to study the relative likelihood of primary and secondary seeding by assuming that a primary tumour consists of a set of independent loci, on which tumours undergo saturating growth according to a logistic law. From these loci, cancer cells are shed and potentially return to their original loci or form new loci. Newton et al. (2013) presented a stochastic Markov Chain/Monte Carlo model to study multidirectional metastatic spread of lung cancer while distinguishing between spreader and sponge metastatic sites, which was extended to be used in breast cancer in Newton et al. (2015). Cisneros and Newman (2014) proposed another stochastic model that used a birth–death process to investigate whether metastasis occurs from many poorly adapted cancer cells or from a few well-adapted cancer cells. Finally, Margarit and Romanelli (2016) developed a patient-statistics-based absorbing Markov Chain model to analyse the metastatic routes between principal organs.
While all processes in the invasion-metastatic cascade are inherently spatial, we conclude that, to our knowledge, no spatially explicit model to describe metastasis and metastatic spread exists, not to mention a model that combines all of the steps of the invasion-metastasis cascade—i.e. cancer cell invasion, intravasation, vascular travel, extravasation and regrowth at new sites in the body—in a spatial manner. With the aim of closing this gap in the existing literature, we propose a novel spatially explicit hybrid modelling framework that describes the invasive growth dynamics both of the primary tumour and at potential secondary metastatic sites as well as the transport from primary to secondary sites. In what follows, we introduce the ideas and assumptions that our modelling framework builds on. The corresponding modelling algorithm is described in Fig.5in the form of a flow chart.
In order to account for cancer cell metastasis in a spatially explicit manner, we considerG+1 spatial domains. These consist of the spatial domain representing the primary tumour site,ΩP, as well as theG∈Nspatial domains representing the sites of potential secondary metastatic spread,ΩSa, wherea =1,2, ...,G. In these spatial domains, we represent the MMP-2 concentration and the ECM density at position
(x,y)at time t by the continuous functionsm(t,x,y)andw(t,x,y), respectively, while capturing the spatiotemporal evolution of epithelial-like and mesenchymal-like cancer cellsindividually. We model the local cancer cell invasion by expanding the modelling approach used in Anderson and Chaplain (1998) and Anderson et al. (2000) to our specific biological problem. We include a second cancer cell phenotype and also additionally consider MT1-MMP, which is taken to be bound to the membranes of the mesenchymal-like cancer cells and thus follows their discrete spatiotemporal dynamics. We designate locations in the primary spatial domain to function as entry points into the vasculature and, similarly, impose a spatial map of exit locations from the vasculature onto the secondary metastatic domains. This allows cancer cells to travel from the primary tumour site to secondary sites via blood vessels.
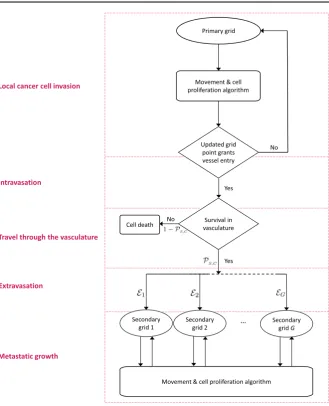
Fig. 5 Flow chart of the metastatic algorithm in our hybrid model. At each time step, each cancer cell on the primary grid moves and proliferates according the ‘Movement & cell proliferation algorithm’ explained in detail in the text. A cancer cell remains on the primary grid during the respective time step, unless it is placed on a grid point of the primary grid that represents a blood vessel. In the latter case, single CTCs and CTC clusters may enter the vasculature. They spend some number of time steps in the circulation and survive with a probability ofPS in the case of single CTCs and with a probability ofPC in the case of CTC clusters. Cancer cells that do not survive are removed from the simulation. Surviving CTCs and CTC clusters are placed onto one of theGsecondary grids with the respective probabilityE1,E2, ...,EG. Cancer cells on the secondary grids perform the same ‘Movement & cell proliferation algorithm’ as cancer cells on the primary grid. For better orientation, the red boxes with their labels on the left correspond to Sects.
[image:13.439.55.385.44.451.2]flow chart in Fig.5. This highlights which parts of our algorithm correspond to which sections in the text.
Local cancer cell invasion The movement of the individual epithelial-like and
mesenchymal-like cancer cells in the spatial domains of our model isderivedfrom the coupled PDEs (1) and (2) below. These equations describe the continuous spatiotempo-ral evolution of epithelial-like and mesenchymal-like cancer cell densitiescE(t,x,y) andcM(t,x,y), respectively. Both cancer cell types are assumed to move via a combi-nation of diffusive movement and haptotactic movement up the gradient of the ECM densityw(t,x,y). Hence, the evolution of the density of epithelial-like cancer cells cE(t,x,y)is governed by the following diffusion-haptotaxis equation:
∂cE
∂t =DE∇ 2
cE−ΦE∇ ·(cE∇w),
diffusion haptotaxis
(1)
along with zero-flux boundary conditions. Here, DE >0 is the constant cancer cell diffusion coefficient for epithelial-like cancer cells and ΦE > 0 is their constant haptotactic sensitivity coefficient. Similarly, the mesenchymal-like cancer cell density cM(t,x,y)evolves according to:
∂cM
∂t =DM∇ 2c
M−ΦM∇ ·(cM∇w),
diffusion haptotaxis
(2)
along with zero-flux boundary conditions. Here,DM >0 is the constant cancer cell diffusion coefficient for mesenchymal-like cancer cells andΦM >0 is their constant haptotactic sensitivity coefficient.
By discretising the spatial domains of our model using a uniform mesh, as described in AppendixB, we derive the movement probabilities of theindividualepithelial-like and mesenchymal-like cancer cells to be those in Eq. (15). Modelling the cancer cells individually allows us to track the evolution of single mesenchymal-like and epithelial-like cancer cells with different phenotypes and their evolution.
The mesenchymal-like cancer cells in our model have the ability to express dif-fusible MMP-2. The MMP-2 concentrationm(t,x,y)hence develops according to the equation:
∂m
∂t =Dm∇ 2
m + ΘcM − Λm,
diffusion expression decay
(3)
along with zero-flux boundary conditions. Here, Dm > 0 is the constant MMP-2
diffusion coefficient,Θ >0 is the constant rate of MMP-2 concentration provided by mesenchymal-like cancer cells, andΛ >0 is the constant rate at which MMP-2 decays. Note that the mesenchymal-like cancer cells also express MT1-MMP. How-ever, MT1-MMP acts locally only where it is bound to the cancer cell membrane and its spatiotemporal evolution is hence congruent to that of the mesenchymal-like cancer cells. Therefore, we do not include a separate equation.
The diffusible MMP-2 degrades the ECM with a degradation rate ofΓ2 >0. The
MT1-MMP expressed on the membrane of the mesenchymal-like cancer cells also degrades the ECM, which is expressed through the degradation rateΓ1 >0. Hence,
given that we are disregarding ECM-remodelling for simplicity, the evolution of the ECM densitym(t,x,y)is governed by the following PDE:
∂w
∂t = −(Γ1cM+Γ2m)w, degradation
(4)
along with zero-flux boundary conditions.
Since the continuous evolution of the MMP-2 concentration and the ECM density is governed by Eqs.3and4, while the spatiotemporal evolution of the cancer cells (and, intrinsically, of the membrane-bound MT1-MMP) is captured by an individual-based model, we model cancer cell invasion in a hybrid–discrete continuum approach. Because the movement probabilities are derived from Eqs.1and2, which are obtained using Eqs.3and4, the hybrid approach is of the kind pioneered by Anderson and Chap-lain (1998) to model tumour-angiogenesis, which was subsequently used to model tissue invasion by cancer cells (Anderson et al. 2000; Anderson2005) and spatial evolutionary games (Burgess et al.2016,2017).
IntravasationWith the model set-up we have described so far, the cancer cells can
invade the tissue locally in the primary spatial domain but cannot reach the spatially separated secondary domains. In order to allow for metastatic spread, we account for the connection of the primary spatial domain to the secondary spatial domains by incorporating blood vessels in our modelling framework. Examples of primary and secondary domains are presented in Fig.6. To represent the entry points into the blood vessels, a number ofUP ∈N0normal blood vessels as well asVP ∈N0ruptured blood vessels are distributed on the primary grid. The normal blood vessels take the size of one grid point, while ruptured vessels consist of a group ofAb∈N, whereb=1,2, ...,V
P,
adjacent grid points and can thus have different shapes. Each secondary gridΩa
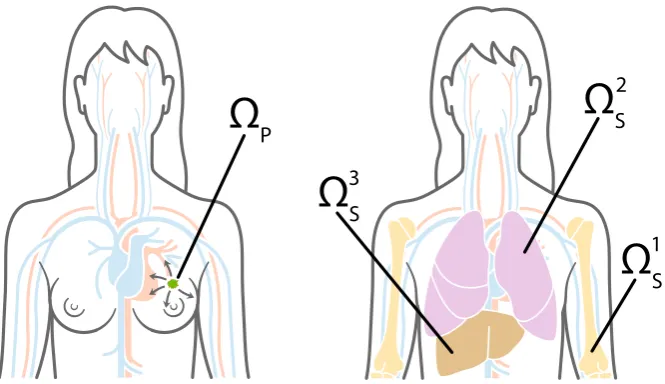
Fig. 6 Primary and metastatic sites. To give an example of how the general modelling framework can be applied to a specific clinical setting, in our simulations we chose the primary siteΩP, which is shown on the left, to represent the breast, and potential secondary metastatic sitesΩ1
S,ΩS2,ΩS3, which are shown on
the right, to represent the bones, the lungs and the liver, respectively. Cancer cells can reach the secondary sites by travelling through the blood system (Colour figure online)
take the form of a single grid point each. On the primary grid, the grid points where the vessels are located allow the cancer cells to intravasate, while the respective grid points on the secondary grid allow for extravasation.
If, by the movement algorithm described in AppendixB, a cancer cell on the primary grid is placed on a grid point that represents a blood vessel, itmayleave the grid and enter the vasculature. Whether or not a cancer cell can successfully intravasate depends both on its own phenotype and on the type of vessel it is placed on.
Whenever a mesenchymal-like cancer cell is moved to a grid point (xi,yj) ∈ ΩP,1on which anormalsingle blood vessel is located, it will successfully enter the vasculature. Further, to represent collective invasion in the form of co-presence of mesenchymal-like and epithelial-like cancer cells, cancer cells of any type on the four neighbouring primary grid points(xi+1,yj), (xi−1,yj), (xi,yj+1)and(xi,yj−1)are
forced into the vasculature together with the mesenchymal-like cancer cell on(xi,yj).
Hence, a mesenchymal-like cancer cell moving to a grid point on which a normal blood vessel is located results in either a single mesenchymal-like cancer cell or a cluster consisting of up to 5Qcancer cells of any phenotype intravasating. However, if an epithelial-like cancer cell is moved to a grid point(xi,yj)∈ΩPwhere anormalsingle
vessel is located without a mesenchymal-like cell being present there, the epithelial-like cancer cell will not intravasate and the grid point(xi,yj)will be treated like any
other grid point. This is to model the fact that epithelial-like cancer cells have been shown to be unable to actively intravasate on their own.
1 The notation(x
[image:16.439.54.387.54.246.2]Further, a cancer cell on the primary grid can move to one of the grid points where aruptured vessel is located. Contrary to the above-described scenario of entering a normal vessel, a cancer cell of any type, which is placed on a grid point representing part of a ruptured vessel, can enter the circulation. The respective cancer cell takes with it any other cancer cells residing both on the grid points representing the ruptured blood vessel and on the regular grid points bordering the ruptured vessel. Biologically, the fact that cancer cells of any phenotype can intravasate mirrors that these blood vessels are already ruptured due to trauma or pressure applied by the expanding tumour, making the requirement of MDE-mediated degradation of the vessel wall redundant. The fact that other cancer cells on bordering grid points will enter the circulation together with cancer cells placed on grid points representing blood vessels captures some degree of the cell–cell adhesion found in collectively invading cancer cell clusters.
Travel through the vasculatureIf a cancer cell of either phenotype or a cluster of
cancer cells successfully enters the vasculature either through a ruptured or a normal vessel, it will be removed from the primary grid and moved to the vasculature. Cancer cells and cancer cell clusters remain in the vasculature for some number of time stepsTV ∈N, which biologically represents the average time the cancer cells spend in the blood system. Any cancer cells that enter a particular vessel at the same time are treated as one cluster and hence as a single entity once they are located in the vasculature. However, each cancer cell that is part of a cancer cell cluster disaggregates from its cluster with some probabilityPdafter
T
V 2
time steps. At the end ofTV time
steps, the single cancer cells and the remaining cancer cell clusters are removed from the simulation unless they are randomly determined to survive. The survival probability isPS for single cancer cells andPC for cancer cell clusters.
ExtravasationAny surviving cancer cells and cancer cell clusters are placed on
one of theGsecondary gridsΩSawith probabilityE1,E2, ...,EG, where
G
a=1Ea=1.
Also, on each specific secondary grid, the cancer cells extravasate through one of the randomly chosenUSagrid points that represent a blood vessel with equal probability. If the respective grid point cannot accommodate all of the entering cancer cells without violating the carrying capacityQ, the remaining cancer cells are randomly distributed onto the four non-diagonally neighbouring grid points until these are filled to carrying capacityQ. If there are further cancer cells to be placed onto the respective grid point at this instance, such cancer cells are killed to capture the influence of competition for space in combination with vascular flow dynamics.
Metastatic growthIf and when cancer cells reach a secondary grid, they behave
(i.e. replicate, move, produce MDEs etc.) there according to the same rules as on the primary grid, as indicated on the bottom of the flow chart in Fig.5.
4 Set-up of Computational Simulations and Model Calibration
be the maximum invasion distance of cancer cells at an early stage of cancer invasion) and time with an appropriate scaling parameterτ = LD2. Here D = 10−6cm2s−1 is a reference chemical diffusion coefficient suggested by Bray (1992), such that
τ =4×10⁴s, which corresponds to approximately 11 h.
We considered spatial domains of size[0,1]×[0,1], which corresponds to physical domains of size[0,0.2]cm× [0,0.2]cm. In particular, we let the spatial domainΩP represent the primary site and the spatial domains ΩS1,ΩS2 andΩS3 describe three metastatic sites. These spatial domains could representanyprimary and secondary carcinoma sites. However, to give an example of a particular application, we considered a study of 4181 breast cancer patients at Memorial Sloan Kettering Cancer Center. Data and graphs from this study can be found athttp://kuhn.usc.edu/breast_cancer(Kuhn Laboratory2017). We accordingly choseΩPto represent the primary site of the breast, andΩ1
S,ΩS2andΩS3to correspond to the common metastatic sites of bones, lungs and liver, respectively. Disregarding potential spread to any other metastatic sites, the data from Kuhn Laboratory (2017) provided us with an extravasation probability of E1 ≈0.5461 to the bones, ofE2 ≈ 0.2553 to the lungs, and ofE3 ≈ 0.1986 to the
liver.
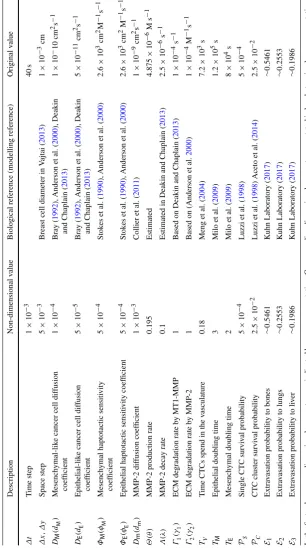
We discretised the four spatial domains to contain 201×201 grid points each. This corresponds to a non-dimensionalised space step ofΔx = Δy = 5×10⁻³, which results in a dimensional space step of 1×10⁻³cm, and thus roughly corresponds to the diameter of a breast cancer cell (Vajtai2013). We then chose a time step of
Δt =1×10⁻³, corresponding to 40s, to comply with the Courant–Friedrichs–Lewy condition (Anderson et al.2000). We ran our simulation for 48,000Δt time steps, which corresponds to∼22 days.
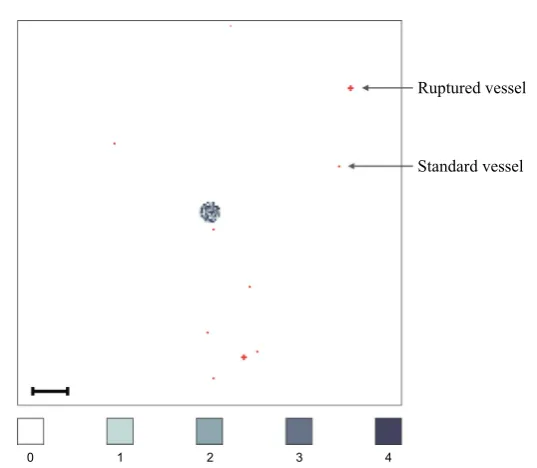
On each secondary grid, we choseUS1 = US2 = US3 = 10 distinct grid points, on which blood vessels are located. For each grid, these blood vessels were placed randomly but at least two grid step widths away from the respective grid’s boundary. The same applies to the primary gridΩP but with the additional condition that the UP =8 single grid points, where normal blood vessels are located, and theVP = 2 sets of five grid points, where ruptured blood vessels are placed, are located outside a quasi-circular region containing the 200 centre-most grid points. While these 10 randomly placed vessels are modelled to exist from the beginning, they represent those vessels that grow as a result of tumour-induced angiogenesis in the vascular tumour growth phase.
Fig. 7 Vessel distribution and initial condition of cancer cells. The plot shows (in red) ten randomly dis-tributed blood vessels on the primary grid, two of which are so-called ruptured vessels that consist of five rather than one grid point. In the centre of the grid, the initial cancer cell distribution is shown. There are between 0 (white) and 4 (black) cancer cells on a grid point. As the initial distribution of cancer cells represents a 2D section through an avascular tumour, the blood vessels are placed at some distance away from the initial nodule of cancer cells. The scale bar denotes 0.02 cm (Colour figure online)
In accordance with the ranges provided in Table1, we chose the mesenchymal-like cancer cell diffusion coefficient to beDM =1×10⁻⁴, the epithelial-like cancer cell diffusion coefficient to beDE =5×10⁻⁵, and the mesenchymal and epithelial haptotactic sensitivity coefficients to beΦM =ΦE =5×10⁻⁴.
We further assumed that, once in the vasculature, a single CTC had a survival probability ofPS =5×10⁻⁴, which is of the order of the micro- and macrometastatic growth success rates proposed in Luzzi et al. (1998). We chose the success rate for metastatic growth to be our survival probability because our model in its current state disregards cancer cell death at secondary sites so that any successfully extravasated cancer cell will initiate micrometastatic growth over time. CTC clusters had a survival probabilityPC =50PS =2.5×10−
2, in accordance with the finding by Aceto et al.
(2014) that the survival probability of CTC clusters is between 23 and 50 times higher than that of single CTCs. Surviving single CTCs and CTC clusters exited onto the secondary grids after spendingTV =0.18 in the blood system, which corresponds to
[image:19.439.83.352.47.281.2]which is consistent with the average doubling times found in breast cancer cell lines (Milo et al.2009).
5 Computational Simulation Results
To verify that our modelling framework is suitable to capture the key steps of the invasion-metastasis cascade, we first ran simulations with the base parameters shown in Table 1. As indicated by the headings throughout this section, we then varied these base parameters across biologically realistic ranges to further confirm that our framework delivers biologically realistic results and to gain insight into the underlying biology. For each of the parameter studies, we took the average results from running the simulation three times—unless stated otherwise—and indicated error bars to display the standard deviation in the corresponding plots. This way, we studied the effect that changing the initial ratio of epithelial-like to mesenchymal-like cancer cells, the number of blood vessels in the primary site, and the survival probability of cancer cells had on the overall cancer dynamics. We investigated the roles of MMP-2 and MT1-MMP as well as their role in comparison with one another. Finally, we changed the parameters to describe haptotaxis-dominated rather than diffusion-dominated cancer cell movement at the end of this section to re-examine the role of membrane-bound versus diffusible MDEs. We compared the outcomes of these simulations to a range of experimental and clinical results.
5.1 Simulations with Base Parameters
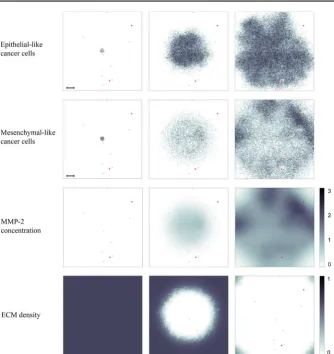
When using the settings outlined in the previous section, we observed in our simu-lations that both epithelial-like and mesenchymal-like cancer cells invaded the tissue surrounding the primary tumour, which is represented by the primary grid, over a 22 day period. This is shown in the simulation results in the two upper rows of pan-els in Fig. 8, respectively. The epithelial-like cancer cells formed the bulk of the central tumour mass, while the mesenchymal-like cancer cells were predominantly found at the outermost tissue-invading edge. The maximum observed invasion dis-tance of the cancer cells over this time span was approximately 0.13 cm. The pattern of MMP-2 concentration for the same simulation roughly followed the distribution of the mesenchymal-like cancer cells as shown in the third row of panels in Fig.8. The ECM density, which is depicted in the bottom row of Fig.8, also followed the evolution of the MMP-2 concentration but in a more uniform fashion.
Fig. 8 Simulation results on the primary grid. Primary tumour dynamics at times 0, 24,000Δtand 48,000Δt (left to right), corresponding to 0 days,∼11 days and∼22 days. For each time step, the distribution of epithelial-like cancer cells (top row) and mesenchymal-like cancer cells (second row) is shown, with the discrete number of cancer cells per grid point ranging from 0 (white) to 4 (black) on each of the panels. The MMP-2 concentration (third row) continuously varies between 0 (white) and 3.0936 (black), and the ECM density (bottom row) between 0 and 1. Red dots represent blood vessels. There are eight normal blood vessels of the size of one grid point as well as two ruptured blood vessels, which extend over five grid points each. If cancer cells are moved to these grid points, they may enter the vasculature and can potentially extravasate at secondary sites. The dynamics of the cancer cells at the secondary sites are presented in Figs.9–11. The scale bar denotes 0.02 cm and applies to all of the panels (Colour figure online)
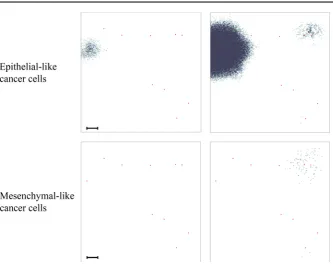
[image:22.439.53.388.45.400.2]Fig. 9 Simulation results on secondary grid representing the bones. Distribution of epithelial-like cancer cells (upper panels) and mesenchymal-like cancer cells (lower panels) at the secondary site representing the bones is shown at times 24,000Δt(left) and 48,000Δt(right), which corresponds to∼11 days and ∼22 days. The number of cancer cells per grid point varies between 0 (white) and 4 (black) in the upper panels and between 0 (white) and 2 (black) in the lower panels. The corresponding MMP-2 concentration and ECM density plots are presented in Fig.18of AppendixC. The scale bar denotes 0.02 cm and applies to all panels (Colour figure online)
the bones showed by far the largest cancer cell load after 22 days, we detected a fur-ther two micrometastases at the secondary site of the lungs, as shown in the panels on the right of Fig.10. Here, the micrometastasis at the bottom of the grid consisted of epithelial-like cancer cells only, while the top micrometastasis contained both cancer cell types as it had grown out of a heterogeneous cancer cell cluster. Finally, the liver showed the least secondary spread in the form of three mesenchymal-like DTCs that arrived as a single cluster, as shown in the panel on the bottom right of Fig.11.
5.2 Changing the Initial Ratio of Epithelial- to Mesenchymal-Like Cancer Cells
By keeping the total initial amount of cancer cells constant at 388 but varying the initial percentage of epithelial-like cancer cells between 0% and 100% in steps of 10%, we found that having solely epithelial-like cells at the start of the simulation had a significant negative impact on tumour growth. We counted an average of 62,932 cancer cells at the end of our simulation timespan of 22 days as compared to about 48% more cancer cells (i.e. 93,115 cancer cells) in the case of an even initial distribution.
[image:23.439.54.388.44.308.2]Fig. 10 Simulation results on secondary grid representing the lungs. Distribution of epithelial-like cancer cells (upper panels) and mesenchymal-like cancer cells (lower panels) at the secondary site representing the lungs is shown at times 24,000Δt(left) and 48,000Δt(right), which corresponds to∼11 days and∼22 days, respectively. The number of cancer cells per grid point varies between 0 (white) and 2 (black) in the upper panels and 0 (white) and 3 (black) in the lower panels. The corresponding MMP-2 concentration and ECM density plots are presented in Fig.19of AppendixC. The scale bar denotes 0.02 cm and applies to all panels (Colour figure online)
reduced growth to 86425, and thus by about 7.7%. Otherwise, we generally found that a higher percentage of epithelial-like cancer cells at the start coincided with a lower number of mesenchymal-like cancer cells at the end of the simulations. At the same time, the number of epithelial-like cancer cells after 22 days increased. We observed that the maximum number of cancer cells occurred under initial conditions with even parts of mesenchymal-like and epithelial-like cancer cells but that the combined cancer cell count at the end of the simulation was relatively stable if we varied the initial number of epithelial-like cancer cells between 0% and 90% (see Fig.12).
Fig. 11 Simulation results on secondary grid representing the liver. Distribution of epithelial-like cancer cells (upper panels) and mesenchymal-like cancer cells (lower panels) at the secondary site representing the liver is shown at times 24,000Δt(left) and 48,000Δt(right), which corresponds to∼11 days and∼22 days, respectively. The panel on the bottom right contains three single mesenchymal-like cancer cells indicated in black, while the other panels do not contain any cells. The corresponding MMP-2 concentration and ECM density plots are presented in Fig.20of AppendixC. The scale bar denotes 0.02 cm and applies to all panels (Colour figure online)
5.3 Changing the Survival Probability of Cells in the Vasculature
As Aceto et al. (2014) suggested that the probability of cluster survival in the vas-culature (PC) is 23 to 50 times higher than that for single CTCs (PS), in the next
simulations, we examined the effects of changing the probability of cluster survival in the vasculature to bePC =23PS =1.15×10−
2—so to take the value of the lower
rather than the upper bound suggested by the authors. For this purpose, we did not allow cancer cell clusters to break up in the vasculature. Averaged over 12 simula-tions, the observed cluster survival was caused to be changed from 2.503×10⁻²(with PC =2.5×10−
2) to 1.137×10⁻². While this change had no significant effect on the
number of single cells and clusters intravasating, it did reduce the average number of extravasating cancer cell clusters, as expected.
5.4 The Role of MMP-2
Fig. 12 Co-presence of epithelial- and mesenchymal-like cancer cells increases the overall primary tumour cancer cell load. The absence of mesenchymal-like cancer cells hinders cancer cell invasion and tumour growth. The final primary tumour cancer cell load on the vertical axis is given in units of 104and refers to simulation results after approximately 22 days (Colour figure online)
Fig. 13 Higher numbers of mesenchymal-like cancer cells at the primary site correspond to an increased intravasation count. The final primary tumour cancer cell load on the horizontal axis is given in units of 104 and refers to simulation results after approximately 22 days (Colour figure online)
Modifying the MMP-2 production rate to take valuesΘ∈ {0,0.1,0.195,0.3,0.4} suggested that a lower MMP-2 production rate correlates with a higher overall cancer cell load after∼22 days—for each cancer cell type individually as well as for both cell types combined. This resulted mainly from changes in cancer cell numbers on the primary grid. The corresponding plot in Fig.14highlights this.
[image:26.439.105.334.291.468.2]Fig. 14 A higher MMP-2 production rate lowers the final primary tumour cancer cell load. The final primary tumour cancer cell load on the vertical axis is given in units of 104and refers to simulation results after approximately 22 days (Colour figure online)
22 days. The total number of intravasations and, coherently, the metastatic cancer cell load decreased as well. This is shown in Fig.15.
5.5 The Effects of MMP-2 Degradation Alone
We next set the MT1-MMP degradation rate to beΓ1 =0 to examine the situation in
which the diffusible MMP-2 is the only MDE in our system. We then varied the MMP-2 production rate, as we had done before when studying the effects of varying the MMP-2 production rate in the presence of MT1-MMP, to beΘ∈ {0,0.1,0.195,0.3,0.4}.
Generally, we found that the total primary cancer cell load after 22 days was sig-nificantly reduced compared to simulations in which MT1-MMP was present. For instance, comparing against simulations with our baseline MMP-2 production rate of
Θ =0.195, the total primary cancer cell load was between 8.2% and 58.0% lower. However, invasion was still possible.
5.6 The Role of MDEs in the Context of Haptotaxis-Dominated Cancer Cell Movement
MT1-Fig. 15 A higher MMP-2 diffusion coefficient corresponds to a lower final primary tumour cancer cell load. The MMP-2 diffusion coefficient on the horizontal axis is given in units of 10−3and the final primary tumour cancer cell load on the vertical axis in units of 104. The results were measured after approximately 22 days (Colour figure online)
MMP degradation rate to beΓ1=0, allowing us to represent the situation in which the diffusible MMP-2 is the only MDE in our system. We then, as before, varied the MMP-2 production rate to beΘ ∈ {0,0.1,0.195,0.3,0.4}. As opposed to our findings when studying diffusion-dominated cancer cell movement, we observed that invasion was no longer possible for the same range of MMP-2 production rates. The final cancer cell numbers on the primary grid averaged below a tenfold increase in cell population when compared to the original nodule of 388 cancer cells. Moreover, the final cancer cell constellation was located at the centre of the grid due to the very low invasion distance of the cancer cells.
When we increased the MT1-MMP degradation coefficient back to the baseline
Γ1=1 but set the MMP-2 production rate to beΘ=0, we found that the cancer cells did invade with an average total of 18312 cancer cells after approximately 22 days. By decreasing the MT1-MMP degradation coefficient toΓ1 =0.5, we observed an even larger cancer cell load of 28157.
5.7 Simulation Results Coincide with Experimental Evidence that Stresses Importance of MT1-MMP in Cancer Invasion
[image:28.439.107.335.52.235.2]Fig. 16 Simulation results for a heterogeneous cancer cell population subject to haptotaxis-dominated movement. To match the domain size and initial cell count of experiments by Sabeh et al. (2009), we started our simulation by placing 420 mesenchymal-like cancer cells and 280 epithelial-like cancer cells in a quasi-circular region with diameter 1.5×10⁻²cm at the centre of a 0.1 cm×0.1 cm grid (initial conditions not shown). Depicted is the distribution of epithelial-like (upper panels) and mesenchymal-like (lower panels) cancer cells at time 34,560Δt, corresponding to 16 days. Left to right, the invasive patterns in the presence of both MDEs (Θ=0.195,Γ1=1), in the presence of MT1-MMP only (Θ=0,Γ1=1) and in the presence of MMP-2 only (Θ=0.195,Γ1=0) are shown for both cancer cell phenotypes. The scale bar denotes 0.01 cm and applies to all panels (Colour figure online)
and mesenchymal-like cancer cells under these experimental conditions after running a simulation for 720 time steps, which corresponds to 16 days. As expected, we still observed that invasion by both epithelial-like and mesenchymal-like cancer cells was possible when both MDEs were present (i.e. withΘ=0.195,Γ1=1) and when solely MT1-MMP was present (i.e. withΘ =0,Γ1=1), while invasion was not possible when solely MMP-2 was expressed (i.e. withΘ =0.195,Γ1 =0). These results are
shown in the left, middle and right column of panels of Fig.16, respectively. Out of the three mechanisms, invasion under expression of MT1-MMP alone yielded the highest average invasion depth. We further observed that the switch from diffusion-dominated to haptotaxis-dominated cancer cell movement triggered more prominent finger-like protrusions in the invasive pattern of the epithelial-like cancer cells in the scenarios where either both MDEs or MT1-MMP alone were present, which is shown in the left and in the middle panel of the top row of Fig.16, respectively.
acti-vated but silences the diffusible MDEs MMP-1 and MMP-2; or with MT1 siRNA, which silences MT1-MMP but leaves MMP-1 and MMP-2 activated. These electro-porated multicellular clusters were then embedded centrally in 3D-type-I collagen gels. The initial experimental set-ups and their respective evolution after 3 days are shown—left to right—in the two upper rows of panels in Fig.17. Since the evolution of the two diffusible MDEs, MMP-1 and MMP-2, in the experiments can be jointly accounted for by the MMP-2 equation of our model, our modelling framework can replicate the above-described experimental settings well. We did this by, again, con-sidering a system with both MDEs (i.e. withΘ =0.05,Γ1 =1), with MT1-MMP only (i.e. withΘ =0,Γ1=1) and with MMP-2 only (i.e. withΘ =0.05,Γ1=0), respectively. When looking at the invasion results after 720 time steps, which corre-sponds to 16 days, we observed similar results as in the case of a mixed initial cancer cell population. As the first panel of the bottom row of Fig.17shows, invasion was possible with both MDEs present. Yet, the invasion depth was slightly lower com-pared to the case where we allowed for MT1-MMP expression alone, which is shown in the second panel of the bottom row of the same figure. Finally, we again found that invasion was not possible in the presence of MMP-2 alone as the third panel of the bottom row of Fig.17shows. As Fig.17suggests, these results are qualitatively in good agreement with the experiments by Sabeh et al. (2009).
Finally, due to our awareness that Sabeh et al. (2009) used cancer cells of mes-enchymal origin only in their experiments, we further sought to reproduce the results of experiments by Gaggioli et al. (2007), who studied the invasion ofsquamous cell carcinoma(SCC)cells, which are of epithelial origin. They found that SCC cells rely on fibroblasts for their invasion, which are cells of mesenchymal-like type that are capable of matrix remodelling, like the mesenchymal-like cancer cells in our model. In the absence of fibroblasts, the authors observed that the cancer cells were unable to invade. While we showed that a mixed population of epithelial-like and mesenchymal-like cancer cells was indeed able to invade when both MDEs are present (see panels on the left of Fig.16), we ran the same simulations again with epithelial-like cancer cells only. This showed that the epithelial-like cancer cells in our model were unable to invade on their own, as observed experimentally by Gaggioli et al. (2007). (Data not shown—similar to bottom right panel of Fig.17.)
6 Discussion and Perspective
In this paper, we have presented a novel mathematical framework to model the metastatic spread of cancer in a spatially explicit manner. For this, we have used a hybrid approach (cf.Anderson and Chaplain (1998); Anderson et al. (2000)) that captures individual cancer cell dynamics while treating abiotic factors as a continuum. We have confirmed through computational simulations that this framework accounts for the key steps of the spatial modelling of metastatic spread.
Fig. 17 Experimental findings by Sabeh et al. (2009) (black panels) compared to simulation results (white panels). The top row of panels shows the initial experimental conditions in Sabeh et al. (2009), where HT-1080 cancer cells were embedded into 3D-type-I collagen gels as central nodules of diameter 1.5×10⁻²– 2×10⁻²cm. The cancer cell spheroids had previously been electroporated with a control siRNA; MMP-1 and MMP-2 siRNAs; MT1 siRNA (left to right). Their invasion after 3 days is shown in the second row of panels. To match the domain size and initial experimental conditions of Sabeh et al. (2009), we started our simulation by placing 700 mesenchymal-like cancer cells in a quasi-circular region with diameter 1.5×10⁻²cm at the centre of a 0.1 cm×0.1 cm grid (third row of panels)—the bar represents a length of 1×10⁻²cm. The bottom row of panels shows the distribution of the mesenchymal-like cancer cells after 16 days (i.e. at time 34,560Δt), in the case where the mesenchymal-like cancer cells are subject to haptotaxis-dominated movement. Left to right, the invasive patterns in the presence of both MDEs (Θ=0.05,Γ1=1), in the presence of MT1-MMP only (Θ =0,Γ1=1), and in the presence of MMP-2 only (Θ =0.05,
In addition to obtaining expected simulation outcomes on the cell-level, both for primary tumour growth and secondary spread, by using the baseline parameter set-tings in Table1, we obtained other biologically realistic and relevant results from the simulations by varying key parameters.
Changing the initial ratio of mesenchymal-like cancer cells to epithelial-like cancer cells emphasised the importance of co-presence of the two cancer cell types for rapid invasive tumour growth. In particular, it highlighted that cancer cell invasion relies on the expression of MDEs (and MT1-MMP in particular), which are required to clear the collagen in the normal tissue of its covalent cross-links, as proposed by Sabeh et al. (2009). These results further suggested that a relatively small percentage of MDE-expressing cancer cells suffices to induce rapid cancer cell invasion.
We observed that higher numbers of mesenchymal-like cancer cells at the primary tumour location increased the number of cancer cell intravasations. Also, cancer cells from primary tumours consisting of a homogeneous epithelial-like cell population did not intravasate (unless ruptured vessels were present, in which case minimal shedding occurred). This coincides with experimental findings by Tsuji et al. (2009). Results from their mouse model indicated that cancer cells originating from primary tumours of homogeneously mesenchymal-like phenotype could intravasate. The same applied to cancer cells that stemmed from tumours consisting of a combination of epithelial-like and mesenchymal-like cancer cells. On the contrary, no intravasations were observed when the primary tumour consisted of epithelial-like cancer cells only.
The fact that we, as opposed to Tsuji et al. (2009), found a small amount of suc-cessfully intravasated cancer cells, even when our tumour consisted of epithelial-like cancer cells only, was to be expected. This was a result of our inclusion of ruptured vessels in the model, which we considered in accordance with the biological findings by Bockhorn et al. (2007). Since these blood vessels are ruptured due to trauma or pressure applied from the expanding tumour, no MDEs are required to degrade the vessel wall and thus any cell type can intravasate through a ruptured blood vessel. We verified that the ruptured vessels were indeed the cause of this discrepancy by rerunning the simulations with an initial nodule consisting of epithelial-like cancer cells only on a primary grid that solely contained normal blood vessels.
Furthermore, we showed that our model was able to reproduce the survival prob-abilities of single CTCs and of CTC clusters observed in experiments by Luzzi et al. (1998) and Aceto et al. (2014).
Regarding the role of the MDEs in our model, we found that both less MMP-2 production as well as less MMP-2 diffusion caused faster cancer cell invasion and thus a higher metastatic cancer cell load after 22 days. If the MMP-2 was too diffusive or too abundant, it degraded the ECM very rapidly. The result was a ring-shaped area around the tumour edge, in which the ECM was fully degraded. This caused the influence of haptotaxis on cancer cell movement to diminish or even to cease completely. Hence, a more local or decreased degradation caused the cancer cells to invade the tissue more rapidly.
found that the final total primary cancer cell load was significantly reduced compared to simulations with MT1-MMP present, which showed again the same tendency as the results by Sabeh et al. (2009). However, contrary to the findings in these experiments, invasion was still possible in our model when considering diffusion-dominated cancer cell movement.
To further investigate the reason for this, we reduced the diffusion coefficients of both the mesenchymal-like and the epithelial-like cancer cells, resulting in haptotaxis-dominated rather than diffusion-haptotaxis-dominated cancer cell movement. We then studied the invasion of a mixed cancer cell population, consisting of 40% epithelial-like and 60% mesenchymal-like cancer cells, as well as of homogeneous cell populations consisting of mesenchymal-like or epithelial-like cancer cells only, under various MDE-related conditions. These conditions were the presence of both MT1-MMP and MMP-2 as well as settings with solely MT1-MMP or solely MMP-2 present. We chose these MDE-related conditions as they correspond to those in experiments conducted by Sabeh et al. (2009). We first ran simulations with a heterogeneous initial cancer cell popula-tion and then, to fully match the experimental condipopula-tions of Sabeh et al. (2009), with mesenchymal-like cancer cells alone. In both cases, we found that invasion was not pos-sible in the presence of MMP-2 alone, while invasion was pospos-sible when we considered MT1-MMP expression alone. Invasion was also possible with both MDEs present but the invasion depth was slightly decreased compared to when we considered MT1-MMP alone. In the case of a heterogeneous initial cell population, we again observed that the mesenchymal-like cancer cells formed the invading edge of the tumour by occurring most abundantly around the central cluster of epithelial-like cancer cells. Further, the epithelial-like cancer cells formed a pattern of finger-like protrusions. The simulation results observed in the case of a homogeneously mesenchymal-like cancer cell popula-tion were in qualitative agreement with the experimental results by Sabeh et al. (2009). For these in vitro experiments, HT-1080 cancer cell spheroids were electroporated with a control siRNA, MMP-1 and MMP-2 siRNAs, or MT1 siRNA. These multicellular clusters were then embedded in 3D-type-I collagen gels as central nodules of diameter 1.5×10⁻²–2×10⁻²cm. The invasive patterns of the HT-1080 cells under the various
conditions were then studied after 3 days. Our model’s results in comparison with those of Sabeh et al. (2009) are shown in Fig.17. Finally, we also matched experimental results by Gaggioli et al. (2007) confirming that in the case of an initial population of like cancer cells only, invasion is not possible. However, the same epithelial-like population mixed with mesenchymal-epithelial-like cancer cells could invade.
Since we present a first spatiotemporal modelling framework of metastatic spread, we have focussed on capturing the main steps involved in the invasion-metastasis cascade. In future work, we aim to include more biological detail.
colonisation of DTCs at secondary sites (Gunasinghe et al.2012). In this context, the biological observation that mesenchymal-like and epithelial-like phenotypes occur on a spectrum rather than as two discrete states (Campbell2018) is another detail that could be included in the framework. Existing spatial models that consider multiple or continuous phenotypic states of cancer cells include (Lorz et al.2015; ´Swierniak and Krze´slak2016; Domschke et al.2017; Lorenzi et al.2018).
The inclusion of a third spatial dimension would further enhance our model’s atten-tion to biological detail. We have not prioritised this in the early stage development of our invasion-metastasis cascade modelling framework as we believe that this would not change the overall characteristics of the model’s qualitative insights.
Biomechanical properties are also not accounted for in our first modelling frame-work but are evidently important, especially for processes such as intravasation, travel through the vasculature and extravasation. For this reason, we are planning to couple our modelling framework to a biomechanical haemodynamics model.
Breast cancer cell intravasation and dissemination occurs through a tumour microenvironment of metastasis(TMEM)-mediated mechanism. TMEMs are micro-anatomical structures consisting of three different cell types that are in direct physical contact with one another (Karagiannis et al.2017). Since we model individual cell dynamics, our framework can easily be adapted to model TMEM involvement in metastatic spread by including an additional cancer cell type and calibrating its phe-notype.
Often solitary DTCs and micrometastases are non-proliferating, ordormant, even years after primary tumour diagnosis (Chambers et al.2002; Pantel and Speicher2016). Others may not survive due to activation of the immune system at the secondary sites. We could include cancer cell dormancy and immune system activation at secondary sites more explicitly. In this regard, we could extend our framework to include organ-specific differentiation of the tissue at the metastatic sites in the body. Further, the tumour microenvironment at the metastatic sites could be modelled as a landscape that evolves over time to capture the process of pre-metastatic niche formation that has been observed both in mouse models and clinical studies (McAllister and Weinberg2014). It could thus be studied in more detail how these changes in the microenvironment of dor-mant cancer cells over time affect growth activation of previously latent micrometas-tases, which was suggested, amongst others, by McAllister and Weinberg (2014).