ISSN Online: 2327-4379 ISSN Print: 2327-4352
DOI: 10.4236/jamp.2019.711203 Nov. 29, 2019 2933 Journal of Applied Mathematics and Physics
Visual Exploration of Polynomial Combination
Based on Variant Measurement Model
Feng Deng, Jeffrey Zheng
Yunnan University, Kunming, China
Abstract
Based on the variant measurement model, this paper uses the combined transformation method to convert the binomial coefficients into a polynomial combination counting formula which contains quaternary variables. The two-dimensional quantitative counting matrix is obtained by using the com-bination function calculation method. Then the related numerical calculation results are converted into statistical histograms and project them on the coordinate axes. The visualization of the final polynomial combination for-mula is presented in a two-dimensional color map mode. It can be seen from the variant maps of the polynomial that the graphical results under multiple conditions exhibit spatial symmetry, as well as special changes and fixed cha-racteristics of the points.
Keywords
Variant Measurement, Visualization, Binomial Coefficient
1. Introduction
Algorithmic study is the core issue in artificial intelligence, machine learning, and big data. The research and optimization of various algorithms relies on a solid mathematical foundation. The combination function [1] [2] occupies an important branch in mathematics. It plays an important role in mathematics field such as elementary number theory, graph theory, statistics and probability. It is more and more important to study the mechanism of combination counting from the perspective of basic mathematics. Traditional combinatorial counting study focuses on the proof of identity, and the visualization of polynomial com-binations needs to be further explored. From the perspective of probability and statistical distribution, visualization is a research tool that is as important as
ex-How to cite this paper: Deng, F. and Zheng, J. (2019) Visual Exploration of Polynomial Combination Based on Variant Measurement Model. Journal of Applied Mathematics and Physics, 7, 2933-2939. https://doi.org/10.4236/jamp.2019.711203
DOI: 10.4236/jamp.2019.711203 2934 Journal of Applied Mathematics and Physics and abstract problems. Showing mathematical formula as a graphical allows probabilistic researchers to make global observations and find unique features.
The calculation of combined counts has always played a central role in data description and analysis in the direction of probability and statistical distribu-tion. In order to describe the distribution characteristics of polynomial combi-nation anomaly, this paper which bases on variant measurement theoretical model and binomial coefficient realizes the visual exploration of polynomial combination distribution by a calculation model containing with choosing po-lynomial combination expression, calculating combination formula and matrix projection. The 2D spatial distribution matrix is obtained by the combination calculation method. Then the spatial distribution matrix is drawn to obtain a two-dimensional histogram, and finally the histogram is projected on the coor-dinate axis and presented in a color map mode. From a global perspective, this paper explores the variation and invariant characteristics of polynomial combi-nations, and the clustering distribution characteristics of various combined transforms are studied.
2. Elementary Formula
2.1. Vandermonde’s Convolution
Vandermonde’s convolution [3] [4] is a binomial coefficient formula consisting of summing over a product of two related binomial coefficient.
Definition: for integer n, the basic identity
k
r s r s
k n k n
+
=
−
∑
(1)2.2. Core Formula
Please refer to [5] for variant measurement, and the core formula details are in Part Two on page 58-68.
According to the variant theory, the binomial coefficient formula needs for a simple processing containing m and p for equivalent replacement. In combina-tion with Equacombina-tion (1), there is
0
2 2
p k
m m q q
p = p k k
−
=
−
∑
(2)In Equation (2), m is the total, p is the number of 1 element, q is the number of 0 - 1 elements and k is the coincidence number. The ranges of each variable respectively is: 0≤q/ 2≤m, 0≤ ≤p m, 0≤ ≤k p.
3. Calculation Model
DOI: 10.4236/jamp.2019.711203 2935 Journal of Applied Mathematics and Physics
Figure 1. Solution processing model.
Choose core formula: Based on the binomial coefficients and variant mea-surement, select the core formula. It means that replace two variables (m, p) with four variables (m, p, q, k). The new polynomial combination expression is:
0
2 2
p k
m q q
p k k
=
−
−
∑
.Calculation: Take m as an arbitrary integer, control any one variables (p, k, q), and calculate the polynomial combination formula by using the combination number calculation method.
Counting matrix: It is the result distribution matrix.
2D map: Project the counting matrix onto a two-dimensional planar graph to form a thermal diagram composed of points.
4. Result
4.1. Counting Matrix
For formula kp=0 mp k2q 2kq
−
−
∑
, we take m = 12, m = 13, control the value of pas an example. The counting matrix results of combination formula are as follow Tables 1-3.
4.2. 2D Map
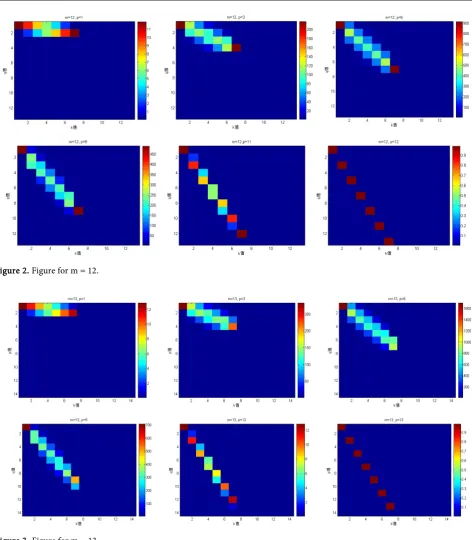
4.2.1. m = 12
Project the space of the two-dimensional counting matrix, with k, q as the hori-zontal and vertical coordinates. Map the distribution matrix on the plane and form a plurality of thermodynamic diagram composed of squares. The results of combination expression contain 12 figures, and this paper selects 6 figures to analyze.
The following figure (Figure 2) is the result graphic that the variable p takes different values (p = 1, p = 3, p = 6, p = 8, p = 11, p = 12) when m takes 12.
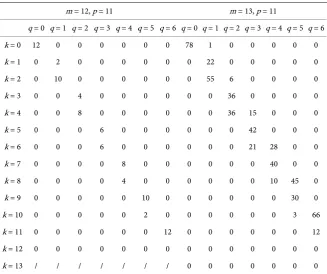
4.2.2. m = 13
In order to facilitate the comparative analysis and description, this paper also gives the results of the p-value transformation when variable m takes 13 (Figure 3).
The value of the p is: p = 1, p = 3, p = 6, p = 9, p = 12, p = 13.
5. Result Analysis
According to the transformation of the p value, Figure 1 and Figure 2 are graphical representations of the results obtained by taking m = 12, m = 13. The same points and different points in the two sets of figures can be easily observed.
DOI: 10.4236/jamp.2019.711203 2936 Journal of Applied Mathematics and Physics m = 12, p = 1 m = 13, p = 1
q = 0 q = 1 q = 2 q = 3 q = 4 q = 5 q = 6 q = 0 q = 1 q = 2 q = 3 q = 4 q = 5 q = 6
[image:4.595.211.538.86.399.2]k = 0 12 10 8 6 4 2 0 13 11 9 7 5 3 1 k = 1 0 2 4 6 8 10 12 0 2 4 6 8 10 12 k = 2 0 0 0 0 0 0 0 0 0 0 0 0 0 0 k = 3 0 0 0 0 0 0 0 0 0 0 0 0 0 0 k = 4 0 0 0 0 0 0 0 0 0 0 0 0 0 0 k = 5 0 0 0 0 0 0 0 0 0 0 0 0 0 0 k = 6 0 0 0 0 0 0 0 0 0 0 0 0 0 0 k = 7 0 0 0 0 0 0 0 0 0 0 0 0 0 0 k = 8 0 0 0 0 0 0 0 0 0 0 0 0 0 0 k = 9 0 0 0 0 0 0 0 0 0 0 0 0 0 0 k = 10 0 0 0 0 0 0 0 0 0 0 0 0 0 0 k = 11 0 0 0 0 0 0 0 0 0 0 0 0 0 0 k = 12 0 0 0 0 0 0 0 0 0 0 0 0 0 0 k = 13 / / / / / / / 0 0 0 0 0 0 0
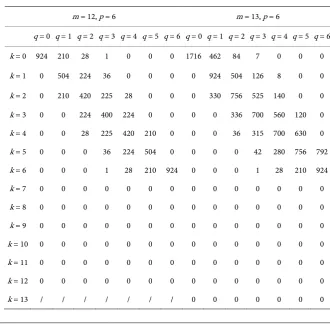
Table 2. The result of counting matrix (p = 6).
m = 12, p = 6 m = 13, p = 6
q = 0 q = 1 q = 2 q = 3 q = 4 q = 5 q = 6 q = 0 q = 1 q = 2 q = 3 q = 4 q = 5 q = 6
k = 0 924 210 28 1 0 0 0 1716 462 84 7 0 0 0
k = 1 0 504 224 36 0 0 0 0 924 504 126 8 0 0
k = 2 0 210 420 225 28 0 0 0 330 756 525 140 0 0
[image:4.595.205.536.415.742.2]DOI: 10.4236/jamp.2019.711203 2937 Journal of Applied Mathematics and Physics
[image:5.595.62.535.57.598.2]Figure 2. Figure for m = 12.
Figure 3. Figure for m = 13.
DOI: 10.4236/jamp.2019.711203 2938 Journal of Applied Mathematics and Physics m = 12, p = 11 m = 13, p = 11
q = 0 q = 1 q = 2 q = 3 q = 4 q = 5 q = 6 q = 0 q = 1 q = 2 q = 3 q = 4 q = 5 q = 6 k = 0 12 0 0 0 0 0 0 78 1 0 0 0 0 0 k = 1 0 2 0 0 0 0 0 0 22 0 0 0 0 0 k = 2 0 10 0 0 0 0 0 0 55 6 0 0 0 0 k = 3 0 0 4 0 0 0 0 0 0 36 0 0 0 0 k = 4 0 0 8 0 0 0 0 0 0 36 15 0 0 0 k = 5 0 0 0 6 0 0 0 0 0 0 42 0 0 0 k = 6 0 0 0 6 0 0 0 0 0 0 21 28 0 0 k = 7 0 0 0 0 8 0 0 0 0 0 0 40 0 0 k = 8 0 0 0 0 4 0 0 0 0 0 0 10 45 0 k = 9 0 0 0 0 0 10 0 0 0 0 0 0 30 0 k = 10 0 0 0 0 0 2 0 0 0 0 0 0 3 66 k = 11 0 0 0 0 0 0 12 0 0 0 0 0 0 12 k = 12 0 0 0 0 0 0 0 0 0 0 0 0 0 0 k = 13 / / / / / / / 0 0 0 0 0 0 0
The different points: From the 6 result graphs in Figure 1, each two-dimensional map is symmetrical and the polynomial combination expression has two maxi-mum values, which respectively are located in the upper left and lower right of the figure. The pictures in Figure 2 are not symmetrical, and there is only one maximum value, located in the upper left of the figure.
From the whole perspective, the counting formula can be transformed into different graphs, and each of the obtained two-dimensional graphs has its own characteristics. When m is even, the projected graph exhibits symmetrical cha-racteristics. When m is taking an odd number, the projected figure does not show symmetry. These two situations reflect the characteristics of the variant. Conversely, multiple graphs are derived from the same polynomial combination expression, which explains the equivalence invariance in the variant construc-tion.
6. Conclusion
[image:6.595.210.538.87.361.2]con-DOI: 10.4236/jamp.2019.711203 2939 Journal of Applied Mathematics and Physics trolling the values of the variables m and p. This variant visualization method has not only produced good results in processing the binomial coefficients, but also provided new ideas for the research of basic mathematics, combinatorial mathematics, probability and statistical distribution, etc. This method has ex-tremely far-reaching significance.
Acknowledgements
I would like to thank my instructor, Professor Jeffrey Zheng, for his careful guidance on this paper and his care and concern. Thanks to the platform pro-vided by the School of Software of Yunnan University. Thanks for the support of major projects of the Yunnan Provincial Science and Technology Department.
Conflicts of Interest
The authors declare no conflicts of interest regarding the publication of this pa-per.
References
[1] Chen, M.J.R. (2012) Combinatorial Mathematics. Harbin Institute of Technology Press, Harbin.
[2] Hall, M. (1986) Combinatorial Theory. 2nd Edition.
[3] Knuth, D.E. (1998) Art of Computer Programming. Volume 1: Fundamental Algo-rithms. 3rd Edition, China Machine Press.
[4] Gould, H.W. (1956) Some Generalizations of Vandermonde’s Convolution. Ameri-can Mathematical Monthly, 63, 84-91.
https://doi.org/10.1080/00029890.1956.11988763
[5] Zheng, J. (2019) Variant Logic Construction under Permutation and Complemen-tary Operations on Binary Logic. In: Zheng, J., Eds., Variant Construction from Theoretical Foundation to Applications, Springer, Singapore.