Original Article
Elevated expression of Pglyrp1 in peripheral blood
mononuclear cells and PGLYRP-1 in serum from
systemic lupus erythematosus patients
Qing Luo1*, Fangyi Yao3*, Lu Zhang4, Xue Li4, Cheng Qing2, Rigu Su4, Yang Guo1, Zikun Huang1, Junming Li1
Departments of 1Clinical Laboratory, 2Intensive Care Unit, The First Affiliated Hospital of Nanchang University, Nanchang, Jiangxi, China; 3Department of Clinical Laboratory, Jiangxi Province Blood Center, Nanchang, Jiangxi, China; 4Department of Medical College, Nanchang University, Nanchang, Jiangxi, China. *Equal contributors.
Received July 9, 2018; Accepted September 12, 2018; Epub April 15, 2019; Published April 30, 2019
Abstract: Background: Peptidoglycan recognition protein-1 (PGLYRP-1) is part of the innate immune system. It has been established that disorders of innate immune response are found in systemic lupus erythematosus (SLE) pa-tients. However, the roles of pglyrp1/PGLYPR-1 in SLE are poorly understood. Methods: Enzyme-linked immunosor-bent assay (ELISA) was used to measure levels of PGLYPR-1 in serum. Quantitative reverse transcription polymerase chain reaction (qRT-PCR) was used to detect levels of Pglyrp1 in peripheral blood mononuclear cells (PBMCs) and correlation analysis was used to analyze the relationship between levels of Pglyrp1 in PBMCs and clinical character-istics. A receiver operating characteristic (ROC) curve was constructed to evaluate the diagnostic value of Pglyrp1
in PBMCs. Results: Expression of Pglyrp1 in PBMCs and PGLYPR-1 in serum from SLE patients was significantly
increased, compared to healthy controls (HC). ROC curve analysis suggested that Pglyrp1 in PBMCs had significant
value of SLE diagnosis (AUC = 0.776), followed by PGLYPR-1 in serum (AUC = 0.695). Pglyrp1 in PBMCs provided
better diagnostic accuracy. Risk scores, based on Pglyrp1 in PBMCs, also significantly distinguished SLE patients
from rheumatoid arthritis (RA) patients. Levels of Pglyrp1 in PBMCs were positively associated with erythrocyte sedi-mentation rates (ESR), C-reactive protein (CRP), and neutrophils (%). Levels of Pglyrp1 in PBMCs were negatively correlated with red blood cells (RBC), hematocrit (HCT), and lymphocytes. Conclusion: Pglyrp1 and PGLYPR-1 protein dysregulation may play a role in SLE pathogenesis. Increased expression of Pglyrp1 in PBMCs from SLE patients may serve as a potential biomarker for SLE patients in the future.
Keywords: Systemic lupus erythematosus, Pglyrp1, biomarker
Introduction
Systemic lupus erythematosus (SLE) is a ch- ronic autoimmune disorder characterized by the production of a variety of autoantibodies against several self-antigens, immune-complex
deposition, and excessive proinflammatory
cy-tokines, affecting a variety of organ systems [1, 2]. Due to diverse clinical manifestations of SLE patients and their unpredictable disease course, early diagnosis and intervention are urgently needed. However, current diagnostic
methods show various insufficiencies for early
diagnosis of SLE. Thus, in-depth studies based on the molecular and genetic distortion of SLE are necessary and have opened new catego-ries of biomarkers [3].
Peptidoglycan is an element of the bacterial cell wall, found in normal human intestinal
micro-flora and mucosa. However, in non-mucosal sites, peptidoglycan may accelerate inflamma -tion through the activa-tion of innate immune mechanisms and stimulation of production of peptidoglycan recognition proteins (PGLYRP), matrix metalloproteinases, chemokines, and
pro-inflammatory cytokines (tumor necrosis
LYRP-1 levels in serum were determined si- multaneously in 8 HC. Another 62 HC were used to detect Pglyrp1 mRNA levels in PB- MCs, solely, and 32 HC were used to detect PGLYRP-1 levels in serum, solely, because of specimen limitations. In total, 70 HC specimens were used to detect Pglyrp1 mRNA levels in
PBMCs (20 specimens were first stage
scre-ening study subjects and 50 specimens were second stage validation study subjects) and 40 HC specimens were used to detect PGLYRP-1 levels in serum. Data regarding demographics and additional clinical parameters of SLE patients and HC are summarized in Table 1. As an autoimmune disease control, 45 RA pati-
ents fulfilling the revised American College of
Rheumatology criteria for RA [20] were enroll- ed. The study was approved by the Ethics Committee of the Science and Technology
Department of the First Affiliated Hospital of
Nanchang University (2014003) and was car-ried out in compliance with the Helsinki De- claration. All subjects provided signed inform- ed consent.
PBMC preparation and total RNA extraction
PBMCs were isolated from EDTA anticoagulat-ed blood of each donorusing Ficoll-Hypaque density gradients (Sigma, USA) at 25°C. The cells were immediately frozen in TRIzol (Invi- trogen, Carlsbad, CA, USA) at a concentration
of 106/mL and stored at -80°C for final analy -sis. Total RNA extraction was isolated from PMBCs with TRIzol Reagent, following manufac-turer instructions. Concentrations and quality of the RNA were assessed by absorbance sp- ectrometry, measuring absorbance ratios of A260/A280 and A 260/A230 using a Nano- Drop ND-1000 spectrophotomete (Agilent, San- ta Clara, CA, USA).
Quantitative RT-PCR analysis
Reverse transcription (RT) reactions were per-formed using random primers with the Pri- meScriptTM RT reagent kit (Takara Bio Inc, Japan). Real-time quantitative reverse transcri- ption-polymerase chain reaction (qRT-PCR) was then performed on an ABI 7500 (Applied Bio-
systems; Thermo Fisher Scientific, Inc.), follow -ing manufacturer instructions. Sequences of the divergent primers for detection of Pglyrp1
and beta-actin (β-actin) are shown in Table 2.
β-actin was applied as an internal control. The
2-ΔCt method was used to analyze the data.
factors play pivotal roles in the pathogenesis of SLE, such as HLA [11], VDR gene FokI [12],
and PON1 [13]. Recent genome-wide profiling
of peripheral blood mononuclear cells (PBMCs)
from SLE has identified several genes involved
in SLE [14]. One of these genes was Pglyrp1, which codes for antibacterial protein, PGLYRP- 1. More recently, a blood transcriptome study
identified PGLYRP-1 in patients with acute coro -nary syndromes [15], suggesting that PGLYRP-1 could be used as a new biomarker for athero-sclerosis [16]. Fodil et al. [17] showed that sin-gle nucleotide polymorphisms of Pglyrp1 were associated with rheumatoid arthritis (RA). How- ever, few data are available regarding the potential roles of Pglyrp1/PGLYRP-1 in SLE. The present study obtained peripheral blood mononuclear cells (PBMCs) and serum from patients with SLE and healthy controls (HC), determining whether Pglyrp1 in PBMCs or PGLYRP-1 in serum could serve as novel non-invasive biomarkers for SLE diagnosis.
Materials and methods
Patient variables
A total of 128 patients fulfilling the revised
American College of Rheumatology criteria for SLE [18] were recruited from the First Af-
filiated Hospital of Nanchang University, from
November 2015 to October 2017. Of the 128 patients, Pglyrp1 mRNA levels in PBMCs and PGLYRP-1 levels in serum were determined simultaneously in 29 patients. Another 56 pa- tients were used to detect Pglyrp1 mRNA levels in PBMCs, solely, and 43 patients were used to detect PGLYRP-1 levels in serum, solely, because of specimen limitations. In total, 85 specimens (9 were new-onset SLE patients) were used to detect Pglyrp1 mRNA levels in
PBMCs (20 specimens were first stage screen -ing study subjects and 65 specimens were sec-ond stage validation study subjects) and 72 specimens (6 were new-onset SLE patients) were used to detect PGLYRP-1 levels in serum. Patients were evaluated using the SLE Disease Activity Index (SLEDAI) [19]. Except for new-onset SLE, all SLE patients received corticos- teroids and immunosuppressive drugs. In ad- dition, this study included 102 HC that were
Table 1. Characteristics of study subjects
Characteristics HC SLE RA
102 128 45
Age (year) 42.22 ± 12.31 38.97 ± 15.09 54.82 ± 11.83
Sex (female/male) 95/7 119/9 37/8
SLEDAI (mean ± S.D.) - 7.44 ± 4.95 -C3 (g/L), mean (S.D.) - 0.63 ± 0.24 -C4 (g/L), mean (S.D.) - 0.14 ± 0.08 -IgG (g/L), mean (S.D.) - 13.63 ± 5.65 -ESR (mm/h), mean (S.D.) - 32.32 ± 28.78 60.43 ± 37.77 CRP (mg/L), mean (S.D.) - 12.00 ± 26.81 49.14 ± 56.51 WBC (109/L), mean (S.D.) 5.53 ± 1.23 7.00 ± 3.39* 7.51 ± 2.52
RBC (1012/L), mean (S.D.) 4.39 ± 0.29 4.00 ± 0.74* 3.80 ± 0.58
HGB (g/L), mean (S.D.) 133.12 ± 10.74 114.13 ± 22.33* 106.64 ± 17.44 HCT (L/L), mean (S.D.) 0.40 ± 0.03 0.35 ± 0.08* 0.33 ± 0.07 PLT (109/L), mean (S.D.) 246.15 ± 55.37 210.59 ± 82.18* 273.18 ± 122.35
Lymphocytes (109/L), mean (S.D.) 1.83 ± 0.61 1.62 ± 1.03* 1.60 ± 0.73
Lymphocytes (%), mean (S.D.) 32.75 ± 6.67 23.98 ± 10.36* 22.57 ± 9.22 Monocytes (109/L), mean (S.D.) 0.37 ± 0.11 0.47 ± 0.23* 0.46 ± 0.21
Monocytes (%), mean (S.D.) 6.74 ± 1.44 7.10 ± 3.01 6.37 ± 2.67 Neutrophils (109/L), mean (S.D.) 3.21 ± 0.89 4.97 ± 3.18* 5.29 ± 2.30
Neutrophils (%), mean (S.D.) 58.00 ± 6.72 67.99 ± 11.85* 69.34 ± 12.24 Autoantibodies (n/total n)
Anti-dsDNA - 47/110
Anti-nRNP/Sm - 53/108
Anti-Sm - 26/108
Anti-SSA - 53/108
Anti-Ro52 - 63/108
Anti-SSB - 16/108
Anti-nucleosome - 24/108
Anti-Ribosomal P - 31/108
-Disease manifestations
Arthritis, n - 21 45
Rash, n - 21
-Neuropathic lupus, n - 2
Oral ulcer, n - 6
Pleuritis, n - 10
Fever, n - 24
Hematuresis, n - 31
Pyuria, n - 15
Proteinuria, n - 44
-Anti-dsDNA: anti double-stranded DNA; C3: complement 3; C4: complement 4; CRP: c-reactive protein; ESR: erythrocyte sedi-mentation rate; HC: healthy controls; HCT: hematocrit; HGB: hemoglobin; IgG: immunoglobulin G; Pglyrp1/PGLYRP-1: Peptido-glycan recognition protein-1; PLT: Platelets; RBC: red blood cell; RNP: ribonucleoprotein; SLE: Systemic lupus erythematosus; SLEDAI: SLE disease activity index; WBC: white blood cell. *P < 0.05 compared to HC.
Enzyme-linked immunosorbent assay (ELISA)
Stored serum obtained from each categorical subject was thawed and assayed for PGLYRP-1
using an ELISA kit, following manufacturer ins- tructions [10] (Uscnk Life Science Inc., China). The lowest detectable limit, the intraassay, and
Serum C3, C4, CRP, autoantibody, ESR, urine routine, and blood routine measurement
Levels of serum Complement 3 (C3), Com- plement 4 (C4), and C-reactive protein (CRP) were detected using nephelometry methods, following manufacturer instructions (IMMUNE- 800, BeckMan, American). Anti-nRNP/Sm, anti-Sm, anti-SSA, anti-Ro52, anti-SSB, anti-Ribo-somal P, and anti-nucleosome antibodies were detected by immunoenzyme dot assay in Eu- roBlot One (Euroimmun, Germany). Anti-dsDNA of IgG in serum was determined using ELISA kits (Kexin, Shanghai, China). Erythrocyte sedi-mentation rates (ESR), urine routine, and blood routine were measured, according to manufac-turer instructions.
Statistical analysis
Statistical analysis and graphic presentations were performed using GraphPad Prism version 5.0 (GraphPad Software, San Diego, CA) and SPSS version 16.0 (SPSS Inc, Chicago, IL). St-
atistical significance was determined by
Stu-dent’s t-test or Mann-Whitney U-test. Likewise, correlation between variables was assessed by
Spearman’s coefficient correlation test. ROC
curves were constructed to evaluate the diag-nostic value of Pglyrp1 in PBMCs or PGLYRP-1 in serum of SLE patients, compared to HC. Va-
lues of P < 0.05 are considered significant
dif-ferences. Results
Increased levels of Pglyrp1 in PBMC from SLE
Levels of Pglyrp1 were first detected in PBMC
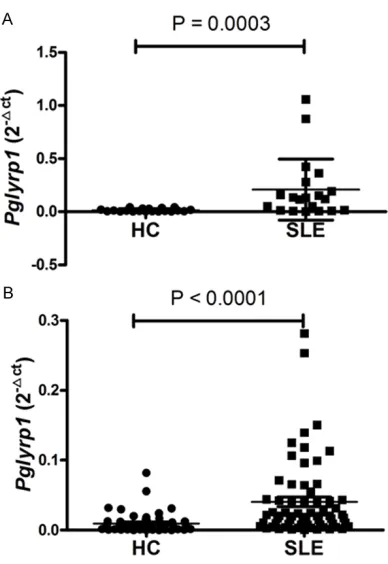
from 20 SLE patients and 20 HC by qRT-PCR. Compared with HC, expression of Pglyrp1 in
SLE patients was significantly upregulated (P =
0.0003) (Figure 1A). To verify the results of Pglyrp1 shown in the screening stage and to evaluate the role as a biomarker for SLE, a vali-dation research was designed, including 65 SLE patients and 50 HC. As shown in Figure 1B, compared with HC, expression of Pglyrp1 was
significantly increased in SLE patients, consis -tent with results from the screening stage (P < 0.0001).
[image:4.612.90.288.95.163.2]In addition, 34.1% of SLE patients did not have increased Pglyrp1 mRNA expression. To explore how these patients differed from patients with increased Pglyrp1 levels, SLE patients were divided into two groups (Pglyrp1 < 0.0134 gr-
Figure 1. qRT-PCR determined relative expression levels of Pglyrp1 in PBMCs from SLE patients and HC. A. Expression levels of Pglyrp1 in 20 SLE patients
was significantly upregulated, compared to those of
the 20 HC in screening stage (Mann-Whitney test). B. Expression levels of Pglyrp1 in 65 SLE patients was
significantly upregulated, compared to those of the
[image:4.612.92.286.214.496.2]50 HC in validation stage (Mann-Whitney test). HC: healthy controls; PBMCs: peripheral blood mononu-clear cells; qRT-PCR: quantitative reverse transcrip-tion polymerase chain reactranscrip-tion; SLE: Systemic lupus erythematosus.
Table 2. Pglyrp1 gene primers used for quan-titative qRT-PCR analysis
Name Sequence
Pglyrp1 F: CACATGAAGACACTGGGCTGGT R: CATGAAGCTGATGCCAATGGAC
β-actin F: TACTGCCCTGGCTCCTAGCA R: TGGACAGTGAGGCCAGGATAG
qRT-PCR: quantitative reverse transcription polymerase chain reaction; Pglyrp1: Peptidoglycan recognition protein-1.
Figure 2. SLE clinical features between Pglyrp1 > 0.0134 group and Pglyrp1 < 0.0134 group. A. ESR was signifi -cantly increased in Pglyrp1 > 0.0134 group than Pglyrp1 < 0.0134 group (Student’s t-test). B. CRP was significantly
increased in Pglyrp1 > 0.0134 group than Pglyrp1 < 0.0134 group (Mann-Whitney test). C. The neutrophils (%)
was significantly increased in Pglyrp1 > 0.0134group than Pglyrp1 < 0.0134 group (Student’s t-test). D. The RBC
was significantly decreased in Pglyrp1 > 0.0134 group than Pglyrp1 < 0.0134 group (Student’s t-test). E. HGB was
significantly decreased in Pglyrp1 > 0.0134 group than Pglyrp1 < 0.0134 group (Student’s t-test). F. HCT was
sig-nificantly decreased in Pglyrp1 > 0.0134 group than Pglyrp1 < 0.0134 group (Student’s t-test). G. The lymphocytes
were significantly decreased in Pglyrp1 > 0.0134 group than Pglyrp1 < 0.0134 group (Mann-Whitney test). H. The
lymphocytes (%) was significantly decreased in Pglyrp1 > 0.0134 group than Pglyrp1 < 0.0134 group (Student’s
t-test). I. The monocytes were significantly decreased in Pglyrp1 > 0.0134 group than Pglyrp1 < 0.0134 group (Student’s t-test). CRP: c-reactive protein; ESR: erythrocyte sedimentation rate; HCT: hematocrit; HGB: hemoglobin;
Pglyrp1: Peptidoglycan recognition protein-1; RBC: red blood cell; SLE: Systemic lupus erythematosus
oup and Pglyrp1 > 0.0134 group), according to the cut-off value of Pglyrp1 mRNA. Moreover, SLEDAI, Anti-dsDNA, ESR, CRP, neutrophils (%), C3, C4, IgG, WBC, RBC, HGB, HCT, PLT, lympho-cytes, lymphocytes (%), monolympho-cytes, and mono-cytes (%) between these two groups were com-pared. As shown in Figure 2, ESR, CRP, and
neutrophils (%) were significantly increased in
the Pglyrp1 > 0.0134 group and RBC, HGB, HCT, lymphocytes, lymphocytes (%), and
mono-cytes were significantly decreased in the
Pg-lyrp1 > 0.0134 group.
Increased levels of Pglyrp1 encoding proteins PGLYRP-1 in serum from SLE
To determine levels of PGLYRP-1 in serum from SLE patients and HCs, ELISA was used to eva-
luate levels of PGLYRP-1 in serum. It was ob- served that levels of PGLYRP-1 in serum were
more significantly increased in SLE patients
than in HCs (P = 0.0006) (Figure 3).
mildly increased in the PGLYRP1 > 1.064 group (P = 0.0600).
Identification of Pglyrp1 levels in PBMC as novel biomarkers for SLE
To further assess the potential value of Pglyrp1 in PBMC as a new biomarker for SLE, ROC cur- ve analysis was carried out on data from the screening set, validation set, and combination of the screening set and validation set. From screening set data, the AUC was up to 0.836 (95% CI: 0.703-0.969; P = 0.0003) (Figure 5A).
Sensitivity and specificity were 70.0% and
100.0%, respectively. From validation set data, the AUC was up to 0.783 (95% CI: 0.700-0.867; P < 0.0001) (Figure 5B). Sensitivity and
speci-ficity were 86.2% and 58.0%, respectively. This
study further evaluated Pglyrp1 as a biomarker for SLE in 85 patients with SLE and 70 HC. The AUC of Pglyrp1 was 0.776 (95% CI: 0.704-0.847; P < 0.0001) (Figure 5C), using 0.0134
as the cutoff point. Sensitivity and specificity
were 67.1% and 75.7%, respectively.
Subsequently, ROC curve analysis was used to evaluate the potential of PGLYRP-1 in serum as a novel biomarker for SLE. As shown in Figure 5D, the AUC of the ROC curve was 0.695 (95% CI: 0.593-0.796; P = 0.0007), using 1.064 as the cutoff point. Sensitivity and spe-
cificity were 80.0% and 54.2%, respectively.
Therefore, Pglyrp1 in PBMC may be more use- ful than PGLYRP-1 in serum as a biomarker for SLE diagnosis.
Pglyrp1 levels in PBMC in patients with SLE and RA
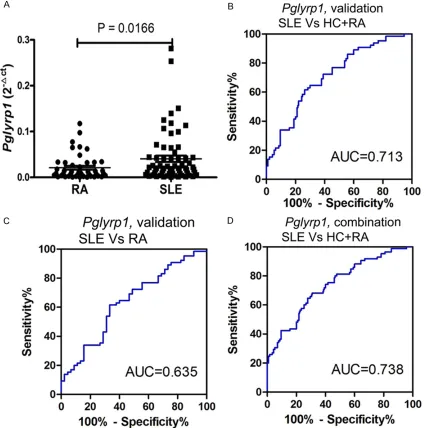
Levels of Pglyrp1 were upregulated more in SLE patients than in RA patients (P = 0.0166) (Figure 6A).
Subsequently, a risk score based on Pglyrp1 in PBMCs from validation set was evaluated in SLE patients and all controls (HC+RA). The AUC was 0.713 (95% CI: 0.633-0.793; P < 0.0001) (Figure 6B). Sensitivity and specificity were
61.5% and 73.7%, respectively. The risk score
also significantly discriminated patients with
SLE from disease controls (RA) and the AUC was 0.635 (95% CI: 0.529-0.741; P = 0.0165) (Figure 6C). Sensitivity and specificity were
61.5% and 66.7%, respectively. When the risk score was tested in all SLE patients and all controls (HC+RA), the AUC was 0.738 (95% CI: 0.669-0.807; P < 0.0001) (Figure 6D).
Sensitivity and specificity were 68.2% and
68.7%, respectively.
Association of Pglyrp1 levels in PBMC with SLE
clinical characteristics
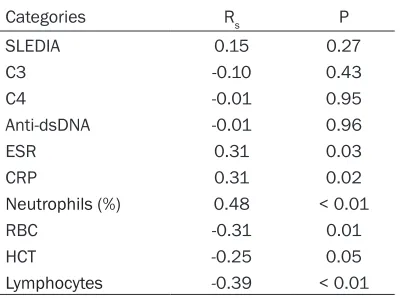
To determine whether levels of Pglyrp1 in PB- MC from SLE patients were activity and seve- rity markers, correlation between SLE-related clinical features (laboratory inspection and clin-ical manifestation) and Pglyrp1 levels in PBMCs from SLE patients was further examined. As shown in Table 3, Pglyrp1 levels in PBMC from SLE patients did not correlate with SLEDAI, C3,
C4, or anti-dsDNA, which reflect the activity and
severity of the disease. However, Pglyrp1 levels in PBMC from SLE patients did correlate with
Figure 3. ELISA determined relative expression levels of PGLYRP-1 in serum from SLE patients and HC. Ex-pression levels of PGLYRP-1 in 72 SLE patients was
significantly upregulated, compared to those of the
40 HC (Mann-Whitney test). ELISA: Enzyme-linked immunosorbent assay; HC: healthy controls; SLE: Systemic lupus erythematosus.
inflammatory indexes, such as ESR, CRP, and
percentage of neutrophils. In addition, Pglyrp1 levels in PBMC from SLE patients did negatively correlate with RBC, HCT, or lymphocytes, which indicate the abnormality of the hematological system.
Additionally, correlation between SLE-related clinical features (laboratory inspection and
clin-ical manifestation) and levels of PGLYRP-1 in serum was investigated. Levels of PGLYRP-1 in serum did not correlate with SLEDAI, C3, C4, ESR, or anti-dsDNA (data not shown).
Discussion
PGLYRP-1 is one of the four PGLYRPs first iden
[image:7.612.94.523.72.540.2]-tified in humans in 1998 [21]. It is expressed
primarily in neutrophilic granules and is part of the innate immune response to infections [9,
10], functioning specifically as a peptidoglycan
scavenger and receptor [4, 22]. There are no current studies discussing levels of Pglyrp1/ PGLYRP-1 in peripheral blood from SLE pati-
ents. Recent genome-wide profiling of PBMCs and qRT-PCR validation has identified Pglyrp1
significantly and differentially expressed in SLE
patients, compared to HC [14]. Moreover, it was
observed that levels of PGLYRP-1 were signifi -cantly increased in serum from SLE patients.
These findings indicate that Pglyrp1/PGLYRP-1 may be related to involvement in the pathogen-esis of SLE, playing a role in innate immune response in SLE.
Recently, more and more studies have verified
[image:8.612.93.521.75.503.2]the probability of serving circulating RNAs as potential biomarkers of SLE [3, 23-25]. Wu GC
Figure 6. ROC curve analysis of risk-scores of Pglyrp1 in PBMCs. A. Expression levels of Pglyrp1 in PBMCs in SLE
[3] reported that long non-coding RNAs GAS5, linc0597, and lnc-DC in plasma can be used as novel biomarkers for SLE. Feng X [25] dem-onstrated that type I interferon-inducible genes (LY6E, OAS1, OASL, MX1, and ISG15) may serve as good biomarkers for SLE diagnosis. However, the diagnostic value of Pglyrp1 in SLE has not been examined. This research indicated that levels of PBMCs Pglyrp1 were increased and the logistic regression model revealed higher AUC for PBMCs Pglyrp1 than serum PGLYRP-1. Risk scores based on PBMCs Pglyrp1 showed
that it can also significantly distinguish SLE
pa-tients from RA papa-tients. Results indicate that PBMCs Pglyrp1 could be used as a potential biomarker of SLE.
The present study is the first to report signifi -cant association between PBMCs Pglyrp1 and
several inflammatory biomarkers in SLE, includ -ing CRP, ESR, and neutrophils (%). These results were consistent with the research of Anand Rohatgi [26], showing that PGLYRP-1 was
asso-ciated with inflammatory biomarkers in
hu-mans. Present results also demonstrated that levels of PBMCs Pglyrp1 were negatively corre-lated with RBC, HCT, and lymphocyte numbers. Results showed that levels of PBMCs Pglyrp1 were associated with disease activity and he- matological system damage of SLE, indicating that PBMCs Pglyrp1 may be relevant biomark-ers for disease activity and disease severity.
However, there were several limitations to the present research. First, the sample size of new-onset SLE patients was relatively small. This may have complicated whether the use of corti-costeroids or immunosuppressive drugs affect-ed expression of Pglyrp1 in PBMCs. Second, the research was restricted by subjects from only one hospital, which may have limited the universality of results. Third, due to the lack of results of CRP and ESR from HC, values of
Pg-lyrp1 in PBMCs plus CRP/ESR for SLE diagnosis
could not be assessed. Conclusion
In summary, the present research is the first to
explore Pglyrp1 levels in PBMCs and PGLYRP-1 expression in serum from SLE patients and from HC. This study demonstrated that levels of Pglyrp1/PGLYRP-1 in SLE were increased. In addition, present results provide new evidence that expression of Pglyrp1 in PBMCs may serve as a potential biomarker for SLE.
Acknowledgements
We would like to acknowledge the help from Dr. Rui Wu at the Department of Rheumatology,
the First Affiliated Hospital of Nanchang
Uni-versity, Nanchang, Jiangxi, China.
This work was supported by the Key Research and Development Plan Project of Jiangxi Province (20181BBG70013), the Science and Technology Plan Project of the Education Department of Jiangxi Province (170008), the National Natural Science Foundation of China (81360459, 81660277), Jiangxi Pro- vincial Natural Science Foundation of China (20151BAB215031, 20171BAB205113), the Science and Technology Project of Health and Family Planning Commission of Jiangxi Province of China (20165094) and the Foundation for Distinguished Young Scientists of Jiangxi Province of china (20171BCB23087).
Disclosure of conflict of interest
None.
Abbreviations
[image:9.612.90.290.97.246.2]Anti-dsDNA, anti-double stranded deoxyribo-nucleic acid antibody; C3, Complement 3; C4, Complement 4; CRP, C-reactive protein; ELISA, Enzyme-linked immunosorbent assay; ESR, Table 3. Association of Pglyrp1 levels in
PBMCs with SLE clinical features
Categories Rs P
SLEDIA 0.15 0.27
C3 -0.10 0.43
C4 -0.01 0.95
Anti-dsDNA -0.01 0.96
ESR 0.31 0.03
CRP 0.31 0.02
Neutrophils (%) 0.48 < 0.01
RBC -0.31 0.01
HCT -0.25 0.05
Lymphocytes -0.39 < 0.01
C3: complement 3; C4: complement 4; CRP: c-reactive protein; ESR: erythrocyte sedimentation rate; HCT: hematocrit; PBMCs: Peripheral blood mononuclear cells;
erythrocyte sedimentation rate; HC, healthy controls; HCT, hematocrit; HGB, hemoglobin; IgG, immunoglobulin G; PBMCs, peripheral blood mononuclear cells; PGLYRP-1, Peptido- glycan recognition protein-1; PLT, Platelets; qRT-PCR, Real-time quantitative reverse tran-scription-polymerase chain reaction; RA, rheu-matoid arthritis; RBC, red blood cell; ROC, receiver operating characteristic; SLE, systemic lupus erythematosus; SLEDAI, SLE Disease Activity Index; WBC, white blood cell.
Address correspondence to: Drs. Junming Li and Zi- kun Huang, Department of Clinical Laboratory, First
Affiliated Hospital of Nanchang University, 17
Yong-wai Zheng Jie, Nanchang 330006, Jiangxi, China. Tel: (+86) 791-88692794; Fax: (+86) 791-886231- 53; E-mail: [email protected] (JML); Tel: (+86) 079- 188692794; Fax: (+86) 0791-88623153; E-mail: [email protected] (ZKH)
References
[1] Rahman A, Isenberg DA. Systemic lupus ery-thematosus. N Engl J Med 2008; 358: 929-39. [2] Cook HT, Botto M. Mechanisms of disease: the
complement system and the pathogenesis of systemic lupus erythematosus. Nat Clin Pract Rheumatol 2006; 2: 330-7.
[3] Cho JH, Fraser IP, Fukase K, Kusumoto S, Fuji-moto Y, Stahl GL, Ezekowitz RA. Human pepti-doglycan recognition protein S is an effector of neutrophil-mediated innate immunity. Blood 2005; 106: 2551-8.
[4] Dziarski R, Gupta D. Review: mammalian pep-tidoglycan recognition proteins (PGRPs) in in-nate immunity. Inin-nate Immun 2010; 16: 168-74.
[5] Schrijver IA, De Man YA, Melief MJ, Van Laar JM, Markusse HM, Klasen IS, Hazenberg MP, Laman JD. Reduced systemic IgG levels against peptidoglycan in rheumatoid arthritis (RA) patients. Clin Exp Immunol 2001; 123: 140-6.
[6] Schrijver IA, Melief MJ, Markusse HM, Van Aelst I, Opdenakker G, Hazenberg MP, Laman JD. Peptidoglycan from sterile human spleen
induces T-cell proliferation and inflammatory
mediators in rheumatoid arthritis patients and healthy subjects. Rheumatology (Oxford) 2001; 40: 438-46.
[7] Wang JE, Jorgensen PF, Almlof M, Thiemer-mann C, Foster SJ, Aasen AO, Solberg R. Pepti-doglycan and lipoteichoic acid from staphylo-coccus aureus induce tumor necrosis factor alpha, interleukin 6 (IL-6), and IL-10 production in both T cells and monocytes in a human whole blood model. Infect Immun 2000; 68: 3965-70.
[8] Guan R, Mariuzza RA. Peptidoglycan recogni-tion proteins of the innate immune system. Trends Microbiol 2007; 15: 127-34.
[9] Royet J, Dziarski R. Peptidoglycan recognition proteins: pleiotropic sensors and effectors of antimicrobial defences. Nat Rev Microbiol 2007; 5: 264-77.
[10] Park HJ, Noh JH, Eun JW, Koh YS, Seo SM, Park WS, Lee JY, Chang K, Seung KB, Kim PJ, Nam SW. Assessment and diagnostic relevance of novel serum biomarkers for early decision of ST-elevation myocardial infarction. Oncotarget 2015; 6: 12970-83.
[11] Kim K, Bang SY, Lee HS, Okada Y, Han B, Saw
WY, Teo YY, Bae SC. The HLA-DRβ1 amino acid
positions 11-13-26 explain the majority of SLE-MHC associations. Nat Commun 2014; 5: 5902.
[12] Imam AA, Ibrahim HE, Farghaly MA, Alkholy UM, Gawish HH, Abdalmonem N, Sherif AM, Ali YF, Hamed ME, Waked NM, Fathy MM, Khalil AM, Noah MA, Hegab MS, Ibrahim BR, Nabil RM, Fattah LA. Vitamin D receptor gene fokI polymorphism in egyptian children and adoles-cents with SLE: a case-control study. Lupus 2017; 26: 1426-1434.
[13] Ibrahim AA, El-Lebedy D, Ashmawy I, Hady MA. Association between paraoxonase-1 gene Q192R and L55M polymorphisms in systemic lupus erythematosus (SLE) and anti-phospho-lipid syndrome (APS) in a population from cairo of egypt. Clin Rheumatol 2017; 36: 1305-1310.
[14] Luo Q, Li X, Xu C, Zeng L, Ye J, Guo Y, Huang Z, Li J. Integrative analysis of long non-coding
RNAs and messenger RNA expression profiles
in systemic lupus erythematosus. Mol Med Rep 2018; 17: 3489-3496.
[15] Brownell NK, Khera A, de Lemos JA, Ayers CR, Rohatgi A. Association between peptidoglycan recognition protein-1 and incident atheroscle-rotic cardiovascular disease events: the dallas heart study. J Am Coll Cardiol 2016; 67: 2310-2312.
[16] Fodil M, Teixeira VH, Chaudru V, Hilliquin P, Bombardieri S, Balsa A, Westhovens R, Barre-ra P, Alves H, Migliorin P, Bardin T, Cornelis F, Boudjema A, Petit-Teixeira E. Relationship be-tween SNPs and expression level for candidate genes in rheumatoid arthritis. Scand J Rheu-matol 2015; 44: 2-7.
[17] Hochberg MC. Updating the american college
of rheumatology revised criteria for the classifi -cation of systemic lupus erythematosus. Ar-thritis Rheum 1997; 40: 1725.
[19] Arnett FC, Edworthy SM, Bloch DA, McShane DJ, Fries JF, Cooper NS, Healey LA, Kaplan SR, Liang MH, Luthra HS. The american rheuma-tism association 1987 revised criteria for the
classification of rheumatoid arthritis. Arthr
Rhuem 1988; 31: 315-24.
[20] Kang D, Liu G, Lundstrom A, Gelius E, Steiner H. A peptidoglycan recognition protein in in-nate immunity conserved from insects to hu-mans. Proc Natl Acad Sci U S A 1998; 95: 10078-82.
[21] Liu C, Gelius E, Liu G, Steiner H, Dziarski R. Mammalian peptidoglycan recognition protein
binds peptidoglycan with high affinity, is ex -pressed in neutrophils, and inhibits bacterial growth. J Biol Chem 2000; 275: 24490-9. [22] Wu GC, Li J, Leng RX, Li XP, Li XM, Wang DG,
Pan HF, Ye DQ. Identification of long non-cod -ing RNAs GAS5, linc0597 and lnc-DC in plas-ma as novel bioplas-markers for systemic lupus ery-thematosus. Oncotarget 2017; 8: 23650-23- 663.
[23] Stypinska B, Paradowska-Gorycka A. Cytokines and MicroRNAs as candidate biomarkers for systemic lupus erythematosus. Int J Mol Sci 2015; 16: 24194-218.
[24] Wu Y, Zhang F, Ma J, Zhang X, Wu L, Qu B, Xia S, Chen S, Tang Y, Shen N. Association of large intergenic noncoding RNA expression with dis-ease activity and organ damage in systemic lupus erythematosus. Arthritis Res Ther 2015; 17: 131.
[25] Feng X, Huang J, Liu Y, Xiao L, Wang D, Hua B,
Tsao BP, Sun L. Identification of interferon-in -ducible genes as diagnostic biomarker for sys-temic lupus erythematosus. Clin Rheumatol 2015; 34: 71-9.