Evaluation Methods for Statistically
Dependent Text
Sarvnaz Karimi
∗ CSIROJie Yin
∗ CSIROJiri Baum
∗∗Sabik Software Solutions
In recent years, many studies have been published on data collected from social media, especially microblogs such as Twitter. However, rather few of these studies have considered evaluation methodologies that take into account the statistically dependent nature of such data, which breaks the theoretical conditions for using cross-validation. Despite concerns raised in the past about using cross-validation for data of similar characteristics, such as time series, some of these studies evaluate their work using standard k-fold cross-validation. Through experiments on Twitter data collected during a two-year period that includes disastrous events, we show that by ignoring the statistical dependence of the text messages published in social media, standard cross-validation can result in misleading conclusions in a machine learning task. We explore alternative evaluation methods that explicitly deal with statistical dependence in text. Our work also raises concerns for any other data for which similar conditions might hold.
1. Introduction
With the emergence of popular social media services such as Twitter and Facebook, many studies in the area of Natural Language Processing (NLP) have been published that analyze the text data from these services for a variety of applications, such as opinion mining, sentiment analysis, event detection, or crisis management (Culotta 2010; Sriram et al. 2010; Yin et al. 2012). Many of these studies have primarily relied on building classification models for different learning tasks, such as text classification or Named Entity Recognition. The effectiveness of these models is often evaluated using cross-validation techniques.
Cross-validation, first introduced by Geisser (1974), has been acclaimed as the most popular evaluation method for estimating prediction errors in regression and
∗CSIRO, Sydney, New South Wales, Australia. E-mail:{sarvnaz.karimi, jie.jin}@csiro.au.
∗∗Sabik Software Solutions Pty Ltd, Sydney, New South Wales, Australia. E-mail:[email protected]. Submission received: 4 October 2013; revised submission received: 9 September 2014; accepted for publication: 10 November 2014.
classification problems. In that method, the data D are randomly partitioned into k
non-overlapping subsets (folds) Dk of approximately equal size. The validation step is
repeatedktimes, using a differentDv =Dkas the validation data andDt=D\Dkas the training data each time. The final evaluation is the average over thekvalidation steps. Cross-validation is found to have a lower variance than a single hold-out set validation and thus it is commonly used on both moderate and large amounts of data without introducing efficiency concerns (Arlot and Celisse 2010). Compared with other choices ofk, 10-fold cross-validation has been accepted as the most reliable method, which gives a highly accurate estimate of the generalization error of a given model for a variety of algorithms and applications.
Despite its wide applications, debates on the appropriateness of cross-validation have been raised in a number of areas, particularly in time series analysis (Bergmeir and Ben´ıtez 2012) and chemical engineering (Sheridan 2013). A fundamental assumption of cross-validation is that the data need to beindependent and identically distributed (i.i.d.)
between folds (Arlot and Celisse 2010). Therefore, if the data points used for training and validation are not independent, cross-validation is no longer valid and would usually overestimate the validity of the model. For time series forecasting, because the data are comprised of correlated observations and might be generated by a process that evolves over time, the training set and the validation set are not independent if randomly chosen for cross-validation. Researchers since the early 1990s have used modified variants of cross-validation to compensate for time dependence within times series (Chu and Marron 1991; Bergmeir and Ben´ıtez 2012). In the area of chemical engineering, the work of (Sheridan 2013) investigates the dependence in chemical data and observes that the existence of similar compounds or molecules across the data set leads to overoptimistic results using standardk-fold cross-validation.
We take such observations from the time series and chemical domains as a warning to investigate the data dependence in computational linguistics. We argue that even when the data appear to be independently generated and when there is no reason to believe that temporal dependencies are present, unexpected statistical dependencies may be induced through an incorrect application of cross-validation. Once there is a chance of having similar or otherwise dependent data points, random split of the data without taking this factor into account would cause incorrect or at least unreliable eval-uation, which may lead to invalid or at least unjustified conclusions. Although similar concerns have been raised by a prior study (Lerman et al. 2008) that cross-validation might not be suitable for measuring the accuracy of public opinion forecasting, there is a lack of systematic analysis on how potential data dependency might invalidate cross-validation and what alternative evaluation methods exist. With the aim of gaining further insight into this issue, we perform a detailed empirical study based on text classification in Twitter, and show that inappropriate choice of cross-validation techniques could potentially lead to misleading conclusions. This concern could apply more generally to other data types of similar nature. We also explore several evaluation methods, mostly borrowed from research on time series, that are better suited for sta-tistically dependent data and that could be adapted by researchers working in the NLP area.
2. Unexpected Statistical Dependence in Microblog Data
Twitter language (Zanzotto, Pennacchiotti, and Tsioutsiouliklis 2011), which in turn can translate to evidence againststatistical independenceof microblog posts in given periods of time or occurrences of the same event. In summary,statistical dependencein tweets can arise for the following reasons:
Events The events of interest, or events being discussed by the microbloggers at large, may be temporally limited within certain specific time horizons;
Textual Links Hashtags and other idiomatic expressions may be invented, gain and lose popularity, fall out of use, or be reused with a different meaning. In addition, particular microbloggers may actively share information on certain types of events or express their opinions on certain topics in similar contexts;
Twinning There may be “twinning” of tweets (and therefore data points) because of various forms of retweeting, where different microbloggers post substantially the same tweets, in response to one another.
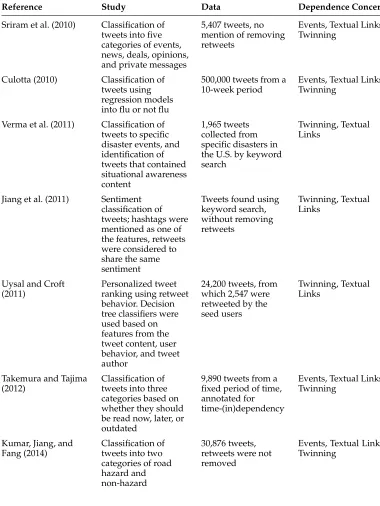
Many existing studies that use microblog data (e.g., for tweet classification)—especially those related to detecting or monitoring events—have adoptedk-fold cross-validation to evaluate the effectiveness of the learned classification models (e.g., Culotta 2010; Sriram et al. 2010; Jiang et al. 2011; Uysal and Croft 2011; Takemura and Tajima 2012; Kumar et al. 2014). However, they overlook thepossible statistical dependenceamong microblog data in terms of content (e.g., sharing hashtags in Twitter), relevance to current events, and time of publishing that could potentially impact their evaluation results. In Table 1 we use examples of these studies to illustrate how potential statistical dependence of microblog data is omitted, which might have impacted the validity of the results in these studies. The potential source of the ignored statistical dependence shown in the last column is categorized intoEvents,Textual Links, andTwinning(described above), based on the list of features that the authors have used in their machine learning approaches. For example, if one is interested in detecting specific events (e.g., diseases [Culotta 2010] or disasters [Verma et al. 2011; Kumar, Jiang, and Fang 2014]), using tweets from the middle of an event to train for and evaluate the detection of the onset of that same event is clearly invalid. In addition, certain users (e.g., authorities that announce disease outbreaks such as @ECDC Outbreaks, or car accidents such as @emergencyAUS) may always post in the same way [Verma et al. 2011; Kumar, Jiang, and Fang 2014], making tweets share similar contexts; or microbloggers always use the same hashtags to indicate similar topics (Jiang et al. 2011). More generally, if substantially verbatim “twin” copies of tweets find their way into both the training and validation data sets (e.g., [Uysal and Croft 2011; Verma et al. 2011; Kumar, Jiang, and Fang 2014]), model validity will be overestimated. We note that, as we do not have access to the data sets used in these studies, we cannot verify the level of influence that the data dependence and their choice of evaluation have on their reported results. However, we raise a warning that there might be an overlooked unexpected dependence influencing their results.
3. Validation for Statistically Dependent Data
Where the data is not independent,dependence-awarevalidation needs to be used. We describe four dependence-aware validation methods that take data dependence into consideration in the evaluation. In the following discussion, we refer to the data set used in the experiments asD={d1,d2,· · ·,dn}. Thetrainingdata is referred to as Dt,
Table 1
Examples of studies usingk-fold cross-validation for evaluating classification methods on Twitter data.
Reference Study Data Dependence Concern
Sriram et al. (2010) Classification of tweets into five categories of events, news, deals, opinions, and private messages
5,407 tweets, no mention of removing retweets
Events, Textual Links, Twinning
Culotta (2010) Classification of tweets using regression models into flu or not flu
500,000 tweets from a 10-week period
Events, Textual Links, Twinning
Verma et al. (2011) Classification of tweets to specific disaster events, and identification of tweets that contained situational awareness content
1,965 tweets collected from specific disasters in the U.S. by keyword search
Twinning, Textual Links
Jiang et al. (2011) Sentiment classification of tweets; hashtags were mentioned as one of the features, retweets were considered to share the same sentiment
Tweets found using keyword search, without removing retweets
Twinning, Textual Links
Uysal and Croft (2011)
Personalized tweet ranking using retweet behavior. Decision tree classifiers were used based on features from the tweet content, user behavior, and tweet author
24,200 tweets, from which 2,547 were retweeted by the seed users
Twinning, Textual Links
Takemura and Tajima (2012)
Classification of tweets into three categories based on whether they should be read now, later, or outdated
9,890 tweets from a fixed period of time, annotated for time-(in)dependency
Events, Textual Links, Twinning
Kumar, Jiang, and Fang (2014)
Classification of tweets into two categories of road hazard and non-hazard
30,876 tweets, retweets were not removed
Border-Split Cross-Validation.This method, proposed by Chu and Marron (1991), is a modification ofk-fold cross-validation for time series data. Data are partitioned into the folds in time sequence rather than randomly; then in each validation step, data points within a time distancehof any point in the validation data set are excluded from the training data. That is, for each validation stepk, the validation data isDv=Dk, there
is aborder data setDb={db∈D\Dv: (∃dv∈Dv)|tdb−tdv| ≤h}, which is disregarded, and the training data isDt=D\(Dk∪Db). This method assumes that the data
depen-dence is confined to some known radiush, with data points beyond that radius being independent.
Time-Split Validation. Intime-split validation(Sheridan 2013), a particular timet∗is chosen; data points prior to this time are allocated to the training data set and data points aftert∗ are used as validation data; that is, Dt={dt∈D:tdt≤t
∗}and D v =
{dv∈D:tdv >t
∗}. Note that this is not a cross-validation method, as no “crossing” takes place. The motivation is to emulate prospective prediction: A model is built using only the information available up to timet∗ and evaluated on data that are collected after that time.
Time-Border-Split Validation. This is a combination of border-split and time-split validation. Both a timet∗and a radiushare chosen; data points prior to timet∗−hare allocated to the training data set and data points after timet∗are used as validation data; that is, Dt={dt∈D:tdt ≤t
∗−h} and D
v={dv ∈D:tdv >t
∗}. The remaining data points are not used. The motivation is to combine the conservative aspects of both time-split and border-split, emulating prospective prediction more carefully.
Neighbor-Split Validation. Proposed by (Sheridan 2013), this method assumes the existence of some similarity metric for the data points. The number of neighbors for each data point is calculated, using a threshold on the similarity metric. A desired fraction of data points with the fewest neighbors are then allocated to the validation data Dv and the rest to the training data Dt. The motivation of this approach is to
deliberately reduce the similarity between training and validation data. It is inspired by
leave-class-out validation orcross-validation, which assumes a pre-existing classification (rather than similarity metric) and allocates data points to the validation dataDv or cross-validation foldsDk, according to this classification. The advantage of neighbor-split over leave-class-out is that the size of the validation data is a parameter that can be chosen, rather than being dependent on the (potentially unbalanced) sizes of the classes in the classification.
4. A Case Study on Tweet Classification
We focus on two tweet classification tasks in our case study. The first is a binary classi-fication, where tweets are classified into disaster-related or not; the second is a disaster type classification, where tweets are predicted to one of the following six classes: non-disaster, storm, earthquake, flooding, fire, and other disasters. In our experiments, we use LibSVM (Chang and Lin 2011) to build discriminative classifiers for our classifica-tion tasks.
same topic. Use oflinksto Web pages, mostly full stories of what is briefly reported in the tweet, is also popular. Selecting features for a text classifier that is built on Twitter data can therefore benefit from both conventional textual features, such asn-grams, and Twitter-specific features, such as hashtags and mentions.
In our experiments, we investigate the effect of the following features and their com-binations on classification of tweets for disasters: (1)n-grams: Unigrams and bigrams of tweet text at the word level, excluding any hashtag or mention in the text. To find
n-grams we pre-process tweets to remove stopwords; (2) Hashtag: Two different fea-tures are explored. First, a binary feature of the hashtags in the tweets, which indicates whether a hashtag exists in the tweet or not; second, the total number of hashtags in a tweet; (3) Mention: Two types of features (binary and mention count) are explored, exactly the same as hashtags explained above; and (4) Link: A binary feature that specifies whether or not a tweet contains any link to a Web page.
4.1 Data and Annotation
We randomly sampled a total of 7,500 English tweets published in two years from December 2010 to December 2012 from a system (Yin et al. 2012) that stores billions of tweets from the Twitter streaming API. Explicit retweets were excluded. This set contained a number of disasters such as earthquakes in Christchurch, New Zealand 2011; York floods, England 2012; and Hurricane Sandy, United States 2012.
For a machine learner such as a classifier to work, we need to present it with a representative set of labeled training data. We therefore annotated our tweet data manually to identify disaster tweets and their types. We annotated the data set based on two main questions: Is this tweet talking about a specific disaster? What type of disaster is it talking about? Types of disasters were defined as earthquake, fire, flooding, storm, other, and non-disaster. Annotations were done by three annotators for each tweet, who were hired through the crowd-sourcing service Crowdflower. After taking majority votes where at least two out of the three annotators agreed on both questions, we ended up with a set of 6,580 annotated tweets, of which 2,897 tweets were identified as disaster-related and 3,683 as non-disaster. In disaster tweets, 37% were annotated with earthquake, followed by fire, flooding, and storm constituting 23%, 21%, and 12%, respectively.
4.2 Experimental Set-up
For our tweet classification tasks, we set up experiments to compare five validation methods—standard 10-fold cross-validation, border-split cross-validation, neighbor-split validation, time-neighbor-split validation, and time-border-neighbor-split validation—for identifying tweets that are relevant to a disaster, and whether or not we can broadly identify the type of disaster. We evaluate classification effectiveness using theaccuracymetric, which is the percentage of correctly classified tweets. We used the following settings for our evaluation schemes:
r
k-fold cross-validation: We usedk=10 folds.r
Border-split cross-validation: We usedk=10 folds for border-split and ar
Neighbor-split validation: We used cosine similarity to find a subset of thedata that has the least number of neighbors in the data set. We weighted hashtags double and disregarded mentions in calculating the similarity. Neighborhood was decided using a minimum threshold of 0.25 on the resulting cosine similarity. The size of the test data set was the same as in time-split (below) but the size of the training data set was 5,868.
r
Time-split validation: We chose the cut-off timet∗so that 90% of the data was used as training (5,922 tweets) and 10% as validation (658 tweets).r
Time-border-split validation: We used the samet∗andhas time-split and border-split. This resulted in a training data set containing 87.1% of the data and a validation data set identical to the one in time-split at 10% of the data (658 tweets). In removing the border, 2.9% of the data were discarded. The size of the training set was 5,750 tweets.4.3 Results
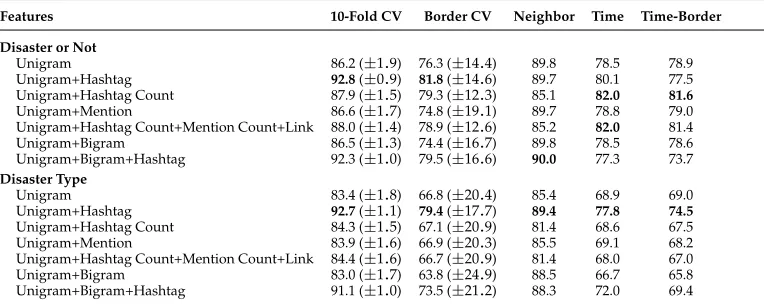
We run two sets of experiments: Discriminating disaster tweets from non-disaster (Disaster or Not), and classifying tweets into the six classes of earthquake, fire, flood-ing, storm, other, and non-disaster (Disaster Type). Table 2 compares the classification results for SVM on a range of feature combinations using five different validation methods. We aim to show that inappropriate choice of cross-validation could possi-bly lead to misleading conclusions, including overestimated classification accuracies, and suboptimal feature sets that yield the highest accuracies.
[image:7.486.54.436.507.660.2]k-fold Cross-Validation. The first set of experiments was conducted using standard 10-fold cross-validation. For discriminating disaster tweets from non-disaster, SVM achieved a maximum of 92.8% accuracy when unigrams and hashtags were used. A similar result of 92.7% accuracy was recorded for classifying tweets to their disaster types. Unsurprisingly, having hashtags as additional features was the most
Table 2
Comparison of different evaluation methods for tweet classification with different feature combinations. Standard deviations are given in parentheses when applicable.
Features 10-Fold CV Border CV Neighbor Time Time-Border
Disaster or Not
Unigram 86.2 (±1.9) 76.3 (±14.4) 89.8 78.5 78.9 Unigram+Hashtag 92.8(±0.9) 81.8(±14.6) 89.7 80.1 77.5 Unigram+Hashtag Count 87.9 (±1.5) 79.3 (±12.3) 85.1 82.0 81.6 Unigram+Mention 86.6 (±1.7) 74.8 (±19.1) 89.7 78.8 79.0 Unigram+Hashtag Count+Mention Count+Link 88.0 (±1.4) 78.9 (±12.6) 85.2 82.0 81.4 Unigram+Bigram 86.5 (±1.3) 74.4 (±16.7) 89.8 78.5 78.6 Unigram+Bigram+Hashtag 92.3 (±1.0) 79.5 (±16.6) 90.0 77.3 73.7 Disaster Type
helpful. As a side note, the standard deviations of 10-fold cross-validation are quite small; although it is well-known that these are not an unbiased estimate of the true variance (see, for instance, Bengio and Grandvalet [2004]), it nevertheless seems to suggest a degree of confidence. If we would assume that tweets are statistically independent, we could conclude that the SVM classifier using unigrams plus hashtags is the best performer for classifying disaster tweets with a high accuracy of over 92%. This is what most previous studies have done. However, this result is overoptimistic. For example, during the cross-validation, tweets, with the same hashtags are distributed over all folds, making it easier for the classifier to associate labels with known hashtags.
Border-Split Cross-Validation. In contrast to 10-fold cross-validation, border-split cross-validation gives a much lower performance score across all of the results. The standard deviations are also much larger.
Neighbor-split Validation.The neighbour-split results are very different. Unlike pre-vious work (Sheridan 2013), we find that neighbor-split judges the effectiveness of the models quite highly, near the scores from 10-fold cross-validation but ranking the feature combinations differently. We believe the high scores are because it tends to pick non-disaster tweets into the validation set, as those tweets have fewest neighbors. This makes it easier to classify all validation tweets into the majority class (i.e., non-disasters).
Time-split and Time-border-split Validation. Neither of these validations leads to results similar to 10-fold cross-validation; they are substantially lower, in one case by over 20 percentage points (bottom row of table). Numerically, they are similar to the border-split cross-validation results, but again with a different ranking of the feature combinations. Time-split and time-border-split methods gave similar results to each other, with different rankings but only small numerical differences. Coincidentally, in our data set, the time t∗ fell largely between events of interest, so the elimination of the border resulted in only a small correction, confounded with the effect of the small reduction in training set size.
4.4 Discussion
The validation methods provide very different results, with a number of the differences around 20 percentage points. In addition, they disagree on the ranking of the feature combinations, which may be the more important problem in many studies. This is particularly visible with the Disaster or Not classification; the best combination of features (bold in Table 2) is different, depending on the validation method used. A study based on 10-fold cross-validation would suggest Unigram+Hashtag for this prob-lem, which is the second-worst combination of features, according to time-border-split validation. Further, the confidence intervals, if used, would suggest confidence in this choice.
cross-validation method, and do not give any measure of confidence in their own results.
Border-split cross-validation may also be acceptable, provided that its assumptions are satisfied—primarily, that the data points are independent beyond a certain radius. Depending on a particular task, this may be easy to decide (e.g., separate events) or hard (e.g., a number of overlapping events with no clear time difference).
We also find that neighbor-split overestimates rather than underestimates the per-formance of the models relative to time-split and time-border-split. This represents a hazard to its use: The neighborhood measure may interact in unexpected ways with other features of the data, rendering the validation unpredictable.
Ideally, one would use multiple large test data sets, all collected during separate, non-overlapping periods of time, after the training data set. This would be the most reliable measure of the performance of the models, but also the most expensive in terms of required data collection and annotation. Failing that, we recommend time-split or time-border-split validation when temporal statistical dependence cannot be ruled out.
5. Conclusions
We used a common task in NLP, text classification, on a relatively recent but widely used data source, Twitter streams, to show that blindly following the same evaluation method for tasks of similar nature could lead to invalid conclusions. In particular, we investigated the most common evaluation method for machine learning applications, standard 10-fold cross-validation, and compared it with other validation methods that take the statistical dependence in the data into account, including time-split, border-split, neighbor-border-split, and a combination of time- and border-split validation. We showed how cross-validation can overestimate the effectiveness of a tweet classification appli-cation. We argued that text in microblogs or other similar text from social media (e.g., Web forums or even online news) can be statistically dependent for specific studies, such as those looking at events. Researchers therefore need to be careful in choosing evaluation methodologies based on the nature of the data at hand to avoid bias in their results.
References
Arlot, S. and A. Celisse. 2010. A survey of cross-validation procedures for model selection.Statistics Surveys, 4:40–79.
Bengio, Y. and Y. Grandvalet. 2004. No unbiased estimator of the variance of k-fold cross-validation.JMLR, 5:1089–1105.
Bergmeir, C. and J. M. Ben´ıtez. 2012. On the use of cross-validation for time series predictor evaluation.Information Sciences, 191:192–213.
Chang, C. and C. Lin. 2011. LIBSVM: A library for support vector machines.ACM TIST, 2(3):27:1–27:27.
Chu, C.-K. and J. S. Marron. 1991.
Comparison of two bandwidth selectors
with dependent errors.Annuals of Statistics, 19(4):1906–1918. Culotta, A. 2010. Towards detecting
influenza epidemics by analyzing Twitter messages. InThe First Workshop on Social Media Analytics, pages 115–122,
Washington, DC.
Geisser, S. 1974. A predictive approach to the random effect mode.Biometrika Trust, 61(9):101–107.
Jiang, L., M. Yu, M. Zhou, X. Liu, and T. Zhao. 2011. Target-dependent Twitter sentiment classification. InACL-HLT, pages 151–160, Portland, OR. Kumar, A., M. Jiang, and Y. Fang. 2014.
Lerman, K., A. Gilder, M. Dredze, and F. Pereira. 2008. Reading the markets: Forecasting public opinion of political candidates by news analysis. InCOLING, pages 473–480, Manchester.
Sheridan, R. P. 2013. Time-split cross-validation as a method for estimating the goodness of prospective prediction.Journal of Chemical
Information and Modeling, 53(4):783–790.
Sriram, B., D. Fuhry, E. Demir,
H. Ferhatosmanoglu, and M. Demirbas. 2010. Short text classification in Twitter to improve information filtering. InSIGIR, pages 841–842, Geneva.
Takemura, H. and K. Tajima. 2012. Tweet classification based on their lifetime duration. InCIKM, pages 2367–2370, Maui, HI.
Uysal, I. and W. B. Croft. 2011. User oriented tweet ranking: A filtering approach to microblogs. InCIKM, pages 2261–2264, Glasgow.
Verma, S., S. Vieweg, W. J. Corvey, L. Palen, J. H. Martin, M. Palmer, A. Schram, and K. M. Anderson. 2011. Natural language processing to the rescue? Extracting “situational awareness” Tweets during mass emergency. InICWSM,
pages 385–392, Barcelona. Yin, J., S. Karimi, B. Robinson, and
M. Cameron. 2012. ESA: Emergency situation awareness via microbloggers. InCIKM, pages 2701–2703,
Maui, HI.