ANALYSIS OF TIME UTILIZATION PATTERN AND EFFECT OF INTERNET USAGE BY
*Nazreen Hassan, S.
Tamil
ARTICLE INFO ABSTRACT
The social media promotions over time have created an effect in the learning behaviour of students. Therefore, an attempt has been made to find out the usage of social media and how it affects the learning behaviour of the stud
finding
internet usage on students learning pattern.
Research Institute, Killikulam. The final year and third year B.Sc (Agri) students are the respondents for the study. A total of 187 students were contacted for the study.
variables, accessibility to internet, and
with the effect of internet usage at five percent and ten percent level of probability respectively.
Copyright©2017, Nazreen Hassan et al. This is an open access article distributed under use, distribution, and reproduction in any medium, provided the original work is properly cited.
INTRODUCTION
Information and communications technology (ICT) has created a shift in the learning behaviour of students. It has developed a space its users for seamless access to information. Social networking media is a media that is widely used to access the information on various aspects. Scholars in many fields have begun to investigate the various angles of Social Networking Sites. Many studies have been conducted around the world to investigate how these sites may influence issues of identity, privacy, social capital, youth culture, education and interpersonal relationships. Ezeah et al. (2013) in
found out that students use social media for purposes of getting entertainment, education/information. Acheaw and Larson (2015) in a study revealed that majority of the respondents had mobile phones which also had Internet facility on them and had knowledge of the existence of many media sites. social media promotions over time have created an effect in the learning behaviour of students. Therefore, an atte
made to find out the usage of social media and how it affects the learning behaviour of the students undergoing under graduation in agriculture with the following objectives:
i) To find out the extent of usage of internet by the undergraduate students.
*Corresponding author: Nazreen Hassan, S.
Tamil Nadu Agricultural University, India.
ISSN: 0975-833X
Article History:
Received 19th March, 2017
Received in revised form 03rd April, 2017 Accepted 23rd May, 2017
Published online 30th June, 2017
Citation: Nazreen Hassan, S., Ponraj, Libirobin and Loganathan, R. Graduands”, International Journal of Current Research
Available online at http://www.journal
Key words:
Internet, Agriculture graduands, Gadgets, Mobile and Effect.
RESEARCH ARTICLE
ANALYSIS OF TIME UTILIZATION PATTERN AND EFFECT OF INTERNET USAGE BY
AGRICULTURAL GRADUANDS
Nazreen Hassan, S., Ponraj, Libirobin and Loganathan
Tamil Nadu Agricultural University, India
ABSTRACT
The social media promotions over time have created an effect in the learning behaviour of students. Therefore, an attempt has been made to find out the usage of social media and how it affects the learning behaviour of the students undergoing under-graduation in agriculture with the objectives finding the extent of usage of social networking sites by the undergraduate students and the effect of internet usage on students learning pattern. The study was conducted at Agricultur
Research Institute, Killikulam. The final year and third year B.Sc (Agri) students are the respondents for the study. A total of 187 students were contacted for the study.
variables, accessibility to internet, and internet usage exhibited a positive and significant relationship with the effect of internet usage at five percent and ten percent level of probability respectively.
is an open access article distributed under the Creative Commons Attribution License, which use, distribution, and reproduction in any medium, provided the original work is properly cited.
Information and communications technology (ICT) has created a shift in the learning behaviour of students. It has developed a space its users for seamless access to information. Social networking media is a media that is widely used to access the on on various aspects. Scholars in many fields have begun to investigate the various angles of Social Networking Sites. Many studies have been conducted around the world to investigate how these sites may influence issues of identity, al, youth culture, education and (2013) in their study found out that students use social media for purposes of getting Acheaw and Larson ity of the respondents had mobile phones which also had Internet facility on them and had knowledge of the existence of many media sites. The social media promotions over time have created an effect in the learning behaviour of students. Therefore, an attempt has been made to find out the usage of social media and how it affects the learning behaviour of the students undergoing
under-objectives:
To find out the extent of usage of internet by the
ii) To find out the aspirations of the students for their future career
iii)To study the effect of internet usage on students learning pattern.
MATERIALS AND METHODS
The study was conducted at Agricultural college and Research Institute, Killikulam. The final year and third year B.Sc (Agri) students are the respondents for the study. A total of 187 students were contacted for the study. A structured questionnaire was used to collect data.
FINDINGS AND DISCUSSION
Based on the responses given by the third and final year students of the Agricultural College,
analysed and the results are presented below.
Age of the respondents
The distribution of the respondents based on the age is as follows
It is seen from table 1 that most of the students fall under the age of 20 (39.04 percent) and the age of the students range from 17 to 23 years.
International Journal of Current Research
Vol. 9, Issue, 06, pp.52407-52413, June, 2017
Nazreen Hassan, S., Ponraj, Libirobin and Loganathan, R. 2017. “Analysis of time utilization pattern and effect of internet usage by agricultural
International Journal of Current Research, 9, (06), 52407-52413.
Available online at http://www.journalcra.com
ANALYSIS OF TIME UTILIZATION PATTERN AND EFFECT OF INTERNET USAGE BY
, Libirobin and Loganathan, R.
The social media promotions over time have created an effect in the learning behaviour of students. Therefore, an attempt has been made to find out the usage of social media and how it affects the graduation in agriculture with the objectives of the extent of usage of social networking sites by the undergraduate students and the effect of The study was conducted at Agricultural college and Research Institute, Killikulam. The final year and third year B.Sc (Agri) students are the respondents for the study. A total of 187 students were contacted for the study. The study revealed that the internet usage exhibited a positive and significant relationship with the effect of internet usage at five percent and ten percent level of probability respectively.
ribution License, which permits unrestricted
To find out the aspirations of the students for their
To study the effect of internet usage on students
METHODS
The study was conducted at Agricultural college and Research Institute, Killikulam. The final year and third year B.Sc (Agri) students are the respondents for the study. A total of 187 students were contacted for the study. A structured
used to collect data.
FINDINGS AND DISCUSSION
Based on the responses given by the third and final year Agricultural College, data was compiled and analysed and the results are presented below.
of the respondents based on the age is as
It is seen from table 1 that most of the students fall under the percent) and the age of the students range
INTERNATIONAL JOURNAL OF CURRENT RESEARCH
Table 1. Distribution of the students based on their age
Age of respondents No %
17 4 2.14
18 12 6.42
19 31 16.58
20 73 39.04
21 51 27.27
22 8 4.28
23 8 4.28
Grand Total 187
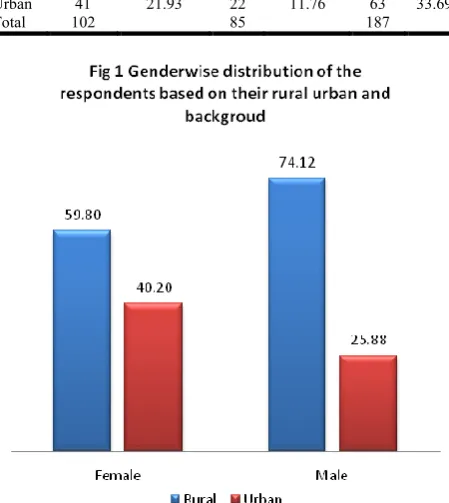
[image:2.595.302.565.171.202.2]The gender-wise distribution of the students is presented in Table 2.
Table 2. Distribution of the students based on gender
S. No Gender No % 1 Fe male 102 54.55
2 Male 85 45.45
It is evident from the table that more than half of the students (54.55 percent) are female and 45.45 percent of the students are male. Hence it can be concluded that female students outnumbered the male students.
Rural/ Urban background
The genderwise distribution of the respondents based on their rural or urban background is presented in Table 3.
Table 3. Distribution of the students based on Rural/ Urban background
S. No Female % of total Male % of total Total % Rural 61 32.62 63 33.69 124 66.31 Urban 41 21.93 22 11.76 63 33.69
Total 102 85 187
It can be inferred from the Table 3 that most of the students are from rural background (66.31 percent) out of which 32.62 percent are female and 33.69 percent male. Fig 1 shows the percentage of students from within the male group and female group who come from the rural and urban background separately. From the figure it could be concluded that from among the male students 74.12 percent have come from the
rural background and the percentage of female students from rural background is 59.80 percent. Hence the comparison within the groups have shown that a higher percentage of male as well as female students have come from the rural background and the percentage is found to be higher from among the male students separately.
Fig Distribution of the students based on medium of instruction:
S. No Female % of total Male % of total Total % English 71 37.97 48 25.67 119 63.64 Tamil 31 16.58 37 19.79 68 36.36
It is evident from the table that most of the students had English as their medium of instruction during their plus two. A majority of female students (37.97 percents) had English as their medium of instruction. The rest of the students studied in Tamil medium.
It could be seen from the fig 2 that from among the female students 69.61 percent had their schooling from English medium and 30.39 percents only had the regional language Tamil as their medium of instruction. From within the male students also a majority of 56.47 percents had English as their medium of instruction during their schooling. The percentage share of male students coming from Tamil medium is 43.53 percent which was found to be higher when compare to the female students which is only 30.39percent.
Possession of communication gadget
Table 7. Distribution of students based on the possession of communication gadget
Gadgets Female % Male % Total % Mobile 32 17.11 26 13.90 58 31.02 Android 50 26.74 41 21.93 91 48.66 Iphone 6 3.21 1 0.53 7 3.74 Ipad 1 0.53 0 0.00 1 0.53 BB/Smart 9 4.81 0 0.00 9 4.81 No gadgets 4 2.14 17 9.09 21 11.23
[image:2.595.312.553.287.474.2] [image:2.595.51.276.450.702.2] [image:2.595.315.551.656.728.2]Accessibility to Internet
Table 6. Accessibility to internet by the students
S. No Female % Male % Total % Internet
Access
91 48.66 62 33.16 153 81.82
Not access 11 5.88 23 12.30 34 18.18
The table shows that 81.82 percents of the students have access to internet and only 18.18 percent do not have accessibility to internet.
Personal accessibility to internet is an important factor responsible for using internet. From fig 3 the gender wise distribution of respondents having personal accessibility to internet either through mobile or network connections was found to be higher within the female students. It could be inferred that most of the students in the campus had personal accessibility to internet.
Aspiration of the students
This study investigated how the students perceive about their future careers. Variations existed between the careers options of students who aspired to jobs and expected to pursue higher
education which is presented in the table. From among the
female students it is evident from the table that most of the girl’s students wanted to go for banking jobs followed by UPSC jobs. Most of the students wanted to pursue higher studies. A majority of 22.35 percent of the male students wanted to go for banking service while 33.33 percent of the female students wanted to go for banking service. Since there are a lot of opportunities in this sector and since the students want a job security they opt for this sector.
[image:3.595.57.539.503.619.2]The Figure 4 and 5 represents the distribution of the students based upon their aspiration genderwise and within gender. It is seen from the figure that a similar pattern was observed genderwise and within gender. It is evident from the table 8 that a majority of the students aspired for banking service (28.34%) followed by perusing post-graduation or JRF (23.53%). 18.18 percent of the students aspire to pass through the UPSC exams and undertake the top administrative jobs. Very meagre percent of the students opted for private sector jobs. It is very interesting to find out that 10.70 percent of the students opt for Entrepreneurship in agri business. 11.76 percent of the students aspired to become Agricultural Research Scientists while 6.42 percent wanted to join management schools.
Table 8. Distribution of students based on their aspiration
Aspiration Female Female % among
the total students % among F Male
Male % among the total students
% among
male Total Total % JRF/ PG 22 11.76 21.57 22 11.76 25.88 44 23.53 Agricultural officer 11 5.88 10.78 17 9.09 20.00 28 14.97
ARS 6 3.21 5.88 16 8.56 18.82 22 11.76
Banking service 34 18.18 33.33 19 10.16 22.35 53 28.34 Management courses 3 1.60 2.94 9 4.81 10.59 12 6.42
UPSC 21 11.23 20.59 13 6.95 15.29 34 18.18
TNPSC 13 6.95 12.75 11 5.88 12.94 24 12.83 Agri. Entrepreneur 4 2.14 3.92 16 8.56 18.82 20 10.70 Private sector jobs 1 0.53 0.98 4 2.14 4.71 5 2.67
Time utilization pattern of internet by female students in a day
S. No
Purpose
Frequency per day
<1hr 1-2 2-5 >5 Never
NO % NO % NO % NO % NO %
1 Chatting with friends 56 29.95 29 15.51 5 2.67 7 3.74 4 2.14 2 Connecting to professionals 52 27.81 18 9.63 4 2.14 1 0.53 26 13.90 3 Chatting with relatives 61 32.62 11 5.88 9 4.81 7 3.74 13 6.95 4 Spending leisure time 47 25.13 22 11.76 10 5.35 10 5.35 12 6.42 5 Assignment purpose 43 22.99 27 14.44 13 6.95 12 6.42 7 3.74 6 Learning purpose 41 21.93 32 17.11 12 6.42 5 2.67 11 5.88 7 Entertainment 44 23.53 23 12.30 15 8.02 6 3.21 13 6.95 8 Information 51 27.27 23 12.30 8 4.28 2 1.07 17 9.09 9 Purchase 28 14.97 7 3.74 3 1.60 3 1.60 60 32.09 10 Online exam 28 14.97 8 4.28 5 2.67 1 0.53 59 31.55
Time utilization pattern of internet by male students in a day
S. No Purpose Frequency per day
It is evident from the table that a majority of 6.42 percent of the female students are using SM for Assignment purpose for more than 5 hrs per day and this is followed by 5.35 percent for Spending leisure time. 8.02 percent are spending 2-5 hrs for Entertainment and 17.11 percent are spending 1-2 hrs for Learning purpose. The students are spending less than one hour for all the purposes from chatting to online exams. Majority donot go for Purchasing and Online exam.
It is evident from the table that a majority of 5.35 percent of the students use internet for Spending leisure time. 9.09 percent are spending 2-5 hrs for assignment purpose followed by 8.56 percent for Entertainment. 12.83 percent spent 1-2 hrs for entertainment and 12.30 percent for Learning purpose. The students are spending less than one hour for all the purposes from chatting to online exams. Majority of 25.13 and 22.46 percent of the male students never use internet for Purchasing and Online exam.
From the figure we can conclude that mostly the students spend less than 1 hr in browsing internet for various purposes. Mostly they chat with friends relative and to connect to professionals here to their teachers. There are some people who never use internet for any of the purposes. A considerable amount of time was spend on getting information and learning purpose. Male students spent a higher share of time on online exams compared to female students. purchase of books and other materials alos is done through internet by some of the students.
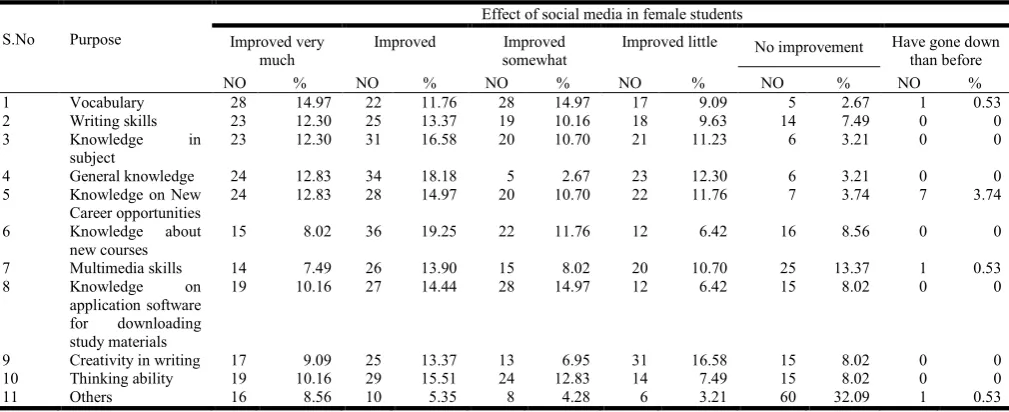
[image:5.595.47.552.561.767.2]It is evident from the table that 14.97 percent have improved very much in vocabulary and 13.37 in writing skills. The students Knowledge in subject, General knowledge and Knowledge on New Career opportunities, Knowledge about new courses, Multimedia skills, Knowledge on application software for downloading study materials, Creativity in writing and thinking ability have improved. 3.74 percent have gone down in Knowledge on New Career opportunities, multimedia skills (0.53%) and vocabulary (0.53%).
Table 18. Effect of social media for academic purposes by female students
S.No Purpose
Effect of social media in female students
Improved very much
Improved Improved somewhat
Improved little No improvement Have gone down than before
NO % NO % NO % NO % NO % NO %
1 Vocabulary 28 14.97 22 11.76 28 14.97 17 9.09 5 2.67 1 0.53 2 Writing skills 23 12.30 25 13.37 19 10.16 18 9.63 14 7.49 0 0 3 Knowledge in
subject
23 12.30 31 16.58 20 10.70 21 11.23 6 3.21 0 0
4 General knowledge 24 12.83 34 18.18 5 2.67 23 12.30 6 3.21 0 0 5 Knowledge on New
Career opportunities
24 12.83 28 14.97 20 10.70 22 11.76 7 3.74 7 3.74
6 Knowledge about new courses
15 8.02 36 19.25 22 11.76 12 6.42 16 8.56 0 0
7 Multimedia skills 14 7.49 26 13.90 15 8.02 20 10.70 25 13.37 1 0.53 8 Knowledge on
application software for downloading study materials
19 10.16 27 14.44 28 14.97 12 6.42 15 8.02 0 0
Effect of social media for academic purposes by male students
S. No Purpose
Effect of social media in male students Improved very
much
Improved Improved somewhat
Improved little
No improvement
Have gone down than before NO % NO % NO % NO % NO % NO % 1 Vocabulary 17 9.09 34 18.18 17 9.09 12 6.42 6 3.21 0 0 2 Writing skills 10 5.35 28 14.97 22 11.76 13 6.95 13 6.95 0 0 3 Knowledge in subject 11 5.88 43 22.99 10 5.35 15 8.02 7 3.74 0 0 4 General knowledge 15 8.02 38 20.32 13 6.95 10 5.35 10 5.35 0 0 5 Knowledge on New
Career opportunities
21 11.23 33 17.65 15 8.02 9 4.81 8 4.28 0 0
6 Knowledge about new courses
12 6.42 35 18.72 19 10.16 11 5.88 9 4.81 0 0
7 Multimedia skills 15 8.02 35 18.72 13 6.95 10 5.35 13 6.95 0 0 8 Knowledge on
application software for downloading study materials
25 13.37 27 14.44 18 9.63 6 3.21 9 4.81 1 0.53
It is evident from the table 19 that the male students have improved in vocabulary, writing skills. The students Knowledge in subject, General knowledge and Knowledge on New Career opportunities, Knowledge about new courses, Multimedia skills , Knowledge on application software for downloading study materials, Creativity in writing and thinking ability have improved. 1.07 percent has gone down in creativity writing, Knowledge on application software for downloading study materials (0.53%) and thinking ability (0.53%). In contrast to female students the male students have not gone down in vocabulary. The male students have improved very much in getting Knowledge on application software for downloading study materials.
It is seen from the table that two out of the eleven variables viz., accessibility to internet (X10), and internet usage (X11) exhibited a positive and significant relationship with the effect of internet usage at five percent and ten percent level of probability respectively. The table indicates that the coefficient of determination (R2) for the respondents was 0.128. Thus all the variables together explained for 12.8 percent of variation in the effect of internet usage. The prediction equation fitted has been given below
Y1= 22.035 +3.235(X1)+ .071(X2) -1.598(X3) -1.045(X4)+ 1.265(X5)+ 0.610(X6) -0.119(X7) -0.218(X8)+0.001(X9)+ 5.165(X10)+ 0.184(X11)
It could be inferred that for every unit increase in accessibility of internet (X10) and internet usage (X11) there is an increase of 5.165 units and 0.184 units increase in effect caused by it.
Conclusion
This exploratory investigation results indicate that college students were likely to be affected by social media. Social media is attractive; it not only provides college students another world to make friends, also provides a good way to release pressure. This research also indicates that an approach is needed to better balance the relationship between social media and academic study. Therefore, college students should think more about the balancing equation of social media and academics. Our research indicated that most college students would prefer to use social media and spend many hours checking social media sites. Social networking is definitely affecting students’ efficiencies as well as their grades. Hence, educators need to be concerned about these problems and try to find better ways to solve these problems.
REFERENCES
Ezeah, G. H., Ph, D., Asogwa, C. E. & Obiorah, I. 2013. Social media use among students of universities in South-East Nigeria, 16(3), 23-32.
Owusu-Acheaw, M. and Agatha Gifty Larson 2015. Use of
Social Media and its Impact on Academic Performance of Tertiary Institution Students: A Study of Students of Koforidua Polytechnic, Ghana, 6, (6), 94-101
Relationship between independent variables and effect of use of internet
Variables ‘r’ value Regression Co – efficient standard Error ‘t’ value Sig. Age of the students(X1) .097 3.235 1.508 2.146 .033 Rural or urban background(X2) -.012 .071 1.609 .044 .965 Medium of instruction(X3) -.108 -1.598 1.763 -.907 .366 SSLC Marks(X4) -.055 -1.045 1.526 -.685 .494
HSC Marks(X5) .040 1.265 .880 1.438 .152
Type of School(X6) -.008 .610 .989 .617 .538 Present OGPA(X7) .035 -.119 1.150 -.104 .917 Father’s Occupation(X8) -.042 -.218 .502 -.434 .665 Income of Family(X9) -.108 .001 .706 .002 .999 Accessibility to internet(X10) .192** 5.165 1.934 2.670*** .008
Internet usage(X11) .227** .184 .060 3.094** .002
R square = 0.128 F value = 2.314 a = 22.035