SEVEN TACIT TANGIBLE INTERACTIVE DESIGN EXPERIMENTS
ANALYSIS AND EVALUATION FOR DEVELOPMENT OF HYBRID DESIGN TOOLS FOR DESIGN AND ENGINEERING PROCESSES
Master thesis
Title: Raw Shaping Form Finding (RSFF) - Seven tacit tangible interactive design experiments
Analysis and evaluation for development of hybrid design tools for design and engineering processes
STUDENT O. GREVENSTUK
MASTER TRACK INDUSTRIAL DESIGN ENGINEERING
EMERGING TECHNOLOGY DESIGN
UNIVERSITY UNIVERSITY OF TWENTE
THESIS NO. DPM1517
DATE May 2018
RAWSHAPING TECHNOLOGY
COMMITTEE:
CHAIRMAN PROF. DR. IR. A. DE BOER
MENTOR DR. ING. R.E. WENDRICH
PREFACE
All education is a process of learning, trial and error, and refinement. For this Master assignment the process was no different. Without the help of some people in particular, this thesis would not have turned out as the document that lies in front of you, dear reader.
For that I would sincerely like to thank;
Dr. Ing. Robert E. Wendrich as mentor, as fellow experimenter / tinkerer and as good friend. The many hours with the RST team research and experiments, the RST international exhibition team efforts and the many social hours of open minded discussions, good food and hot or cold beverages. In the last 10+ years we learned to appreciate each other’s qualities and successfully completed many RST prototype problems and system builds. For all those years and still the many available years ahead, I would like to say again, thank you friend!
Prof. Dr. Ir. A. de Boer for the kind words during email communication and progress meetings. Furthermore, allowing me to conduct this research.
Dr. Ir. D. Lutters for participation in the assessment committee.
The RAWSHAPING TECHNOLOGY (RST) team for their friendly input and feedback on various RST research challenges. It was a pleasure to work with the team and see every one of them always aim for the best possible solution. Not because they had to, but because they wanted to. Keep up the good work!
Friends and family for their support and believe in a successful completion of my Master assignment.
SUMMARY
A main task of industrial designers is the shaping and transformations of ideas or fuzzy notions into abstract or materialized equivalents. These sketches, models, or other representations can be described as the sum of 3-D form and 2-D shape aspects, aesthetics, intuitive qualities, tacit-knowing, as well as technical and sustainable functionalities. The designer must understand the elements involved in this synthesis of form-giving and design. Successful designers compose these characteristics carefully and join them together to form and shape artefacts into a harmonious and balanced whole, while simultaneously manoeuvring within implicit and explicit mechanical and functional aspects (Wendrich, 2009).
With the emergence of 3-D computational design, the industrial design and engineering process shifted from traditional analogue physical representations of ideas or artefacts to digital virtual realities. This shift is creating pre-dominance of digital design over the idiosyncrasies of analogue craftsmanship of the designer. Loss of control, immediacy, manual dexterity and skills due to constraint in electronic interfaces (i.e. windows-keyboard-mouse-monitor-pointer) and programmer's directions. Subsequently, this gave way to alienation of the physical material world and created voids in the support of design processes (Wendrich, 2010).
In this report, we follow two main research directions in our attempt to bridge this gap. Firstly, we execute an empirical user-study in combination with seven tacit-tangible design task experiments. We aim to measure the effectiveness (i.e. qualitative), performance, and other qualities of various shaping and representation techniques. Secondly, we show the preliminary design and build of hybrid design tool prototypes (RSFF-HDT) that targets to bring back the tacit-tangible elements of design and/or engineering processes integrated in CAD-systems.
We investigate and explore possible distinctions between the analogue and digital representation tools, explain the seven laboratory experiments, and analysis and evaluate testing results. Furthermore, correlation between empirical research and educational embedding in conjunction with
the creative opportunities that emerge from embedment of hybrid design tools (HDT’s) and/or HDT
SAMENVATTING
Een belangrijke taak voor ontwerpers en ingenieurs is het vormgeven, ontwerpen, specificeren en vertalen van ideeën of moeilijk definieerbare problemen naar abstracte, concrete oplossingen en/of modellen. Deze schetsen, modellen, prototypen of andere representaties zijn, naast de zorgvuldige afwegingen en het itereren van technische mogelijkheden een synthese tussen tweedimensionale en driedimensionale vormaspecten, esthetiek, intuïtieve kwaliteiten, en praktische ervaring. Dit is inclusief het bepalen van de technische- en duurzame functionaliteiten. De ontwerper zal binnen deze synthese van vormgeven en ontwerpen zoveel mogelijk proberen om alle onderdelen en delen technisch te vertalen en te integreren. Succesvolle ontwerpers of ingenieurs, zijn in staat om alle deze eigenschappen, specificaties, wensen en eisen harmonieus en uitgebalanceerd samen te voegen (vormgeving, ontwerpen), terwijl ze voortdurend rekening houden met impliciete en expliciete mechanische en functionele aspecten gedurende het ontwerpproces (Wendrich, 2009).
Met de introductie van computergestuurde 3-D CAD systemen, veranderde het ontwerp- en technisch-ontwerp proces van traditionele analoge ideeontwikkeling en representatie in het vastleggen en visualiseren van driedimensionale informatie en data binnen een digitale virtuele realiteit. Door de schijnbare efficiëntie, gebruiksgemak en verhoogde effectiviteit van CAD omgevingen werd deze nieuwe techniek al vrij snel geadapteerd en dominant in gebruik binnen de ontwerp- en techniekdomeinen. De analoge en impliciete kennis, expliciete vaardigheden en kenmerkende vakmanschap van ontwerpers en ingenieurs verdween hierdoor haast automatisch. Vooral het verlies van direct inzicht, handigheid (heuristiek), controle- en toepassing van kennis gedurende een ontwerpproces kwam hierdoor ernstig onder druk. De CAD-programma’s leiden vaak naar een
beperking van het menselijk inzicht. De handelingen worden veelal gestuurd en tegelijkertijd beperkt door voorgeprogrammeerde oplossingsrichtingen binnen deze digitale systemen. Het gevolg is dat er een ‘nieuwe’
generatie ontwerpers en ingenieurs ontstaat die vaak geen enkele affiniteit hebben met de fysiek-tastbare en intuïtieve wereld en vervreemd zijn geraakt van deze realiteit binnen de ontwerpprocessen (Wendrich,
2009-2010). Om deze zichtbare ‘kloof’ te dichten en/of te overbruggen, is er door Wendrich en Tideman in 2004 een onderzoek gestart om de analoge en digitale werelden (hybridisering) dichter bij elkaar te brengen of te laten samenvloeien door specifieke ontwerpgereedschappen en –omgevingen te creëren.
We volgen twee belangrijke onderzoeksrichtingen die in dit rapport worden beschreven en omschreven. Initieel wordt er een empirische gebruikersstudie (kwalitatief onderzoek) uitgevoerd met een diversiteit aan ontwerpers, die allen verschillende kennis- en ervaringsniveaus hebben. Deze studie en experimenten bestaan uit zeven verschillende ontwerp-opstellingen, die variëren tussen het maken van simpele analoge- tot en met het creëren van volledig digitale representaties. De gebruikers (ontwerpers) worden per experiment getest door middel van het uitvoeren van een specifieke ontwerptaak binnen een vooraf vastgestelde tijd. Hierbij meten, vergelijken en observeren we de effectiviteit, prestaties, snelheid, tastbare resultaten en andere aspecten van de zeven verschillende representatietechnieken. In het tweede deel van dit onderzoek, presenteren we de ontwikkeling en ontwerpen van prototypen die leiden tot een mogelijke oplossing van hybride intuïtieve ontwerpgereedschappen en –omgevingen (RSFF-HDT). De specificaties, eisen en wensen van deze prototypen zijn mede gebaseerd op de resultaten, analyses, evaluaties, en bevindingen die voortvloeien uit de zeven laboratoriumexperimenten.
LIST OF ABBREVIATIONS
2-D two dimensional
3-D three dimensional
AER Automatic Emotion Recognition
AM Additive Manufacturing
API Application Programming Interface
CAD Computer Aided Design
CC Correlation Coefficient
CNN Convolutional Neural Networks
COTS Commercial-Off-The-Shelf
CSS3 Cascading Style Sheets 3
HDT Hybrid Design Tool
HDTE Hybrid Design Tool Environment
HTML5 Hyper Text Markup Language 5
IA Interaction
IxD Interaction Design
MQ Mean Quality
PCP Product Creation Process
PEP Product Engineering Process
RQ Ranked Quality
RSFF Rawshaping Formfinding Tool
RST Rawshaping Technology
TBC Tie Break Column
UIA User Interaction
VFG Virtual Formgiving
VIA Video Interaction Analysis
WIMP Windows, Interaction, Menu’s and Pointers
X1 Experiment 1
X2 Experiment 2
X3 Experiment 3
X4 Experiment 4
X5 Experiment 5
X6 Experiment 6
LIST OF FIGURES
FIG.1-1 HUMAN CAPACITY TO EXTERNALIZE META-COGNITIVE ABILITIES (WENDRICH,2008) 1
FIG.1-2 PRODUCT DESIGN PROCESS BY MEANS OF 3-D MATERIAL REPRESENTATION (WENDRICH,2008) 2
FIG.1-3 VARIOUS CUBE SKETCH REPRESENTATIONS 2
FIG.1-4 TANGIBLE CUBE REPRESENTATIONS 2
FIG.1-5 TANGIBLE SERENDIPITOUS CUBE REPRESENTATIONS 3
FIG.1-6 THE EARLY-STAGE RSFFFRAME OF MIND IDEATION PROCESS (WENDRICH,2010) 5
FIG.1-7 THE EDUCATION-EXPERIMENTATION-DESIGN TOOL RESEARCH FRAMEWORK (WENDRICH,2009) 6
FIG.1-8 PHYSICAL AND DIGITAL REPRESENTATION (WENDRICH,2008) 7
FIG.1-9 TECHNOLOGY SCAN (2010)(WENDRICH,2010) 8
FIG.2-1 2-D ORTHOGONAL DRAWING OF DESIGN ICON 11
FIG.2-2 EDUCATIONAL DESIGN EXPERIMENT ON 2-D TO 3-D REPRESENTATION (FROM LEFT TO RIGHT, TOP TO BOTTOM: SIZE
-CHANGING, TANGIBLE-TACIT MANIPULATION WITH REFLECTIVE MATERIAL,3-D WIRE-FRAME CONSTRUCTION, FINAL 3-D
REPRESENTATION) 12
FIG.2-3 SELECTION OF 36 MODELS AND RANKED IN ORDER OF QUALITY ONLY (FROM LEFT TO RIGHT / TOP TO BOTTOM 01-36,
WHEREBY 01 IS THE BEST EXECUTED MODEL REPRESENTATION) 13
FIG.2-4 RANKING OF 36 MODELS IN ORDER OF QUALITY, SHAPE REPRESENTATION AND APPLIED SLICING-METHOD 13
FIG.2-5 WIRE FRAME DS AND SURFACE TEXTURE EXAMPLES ON DS WIREFRAMES (SHOWING VARIETY IN SHAPE AND FORM, DIVERSITY IN SOLUTIONS AND REPRESENTATIONS AND A PLETHORA IN INTERPRETATIONS) 14
FIG.2-6 INTERPRETATION MODELLING ICON ARTEFACT 14
FIG.2-7 CITROEN DS(2-D DRAWING AND 3-D SCULPTING), DESIGN FLAMINIO BERTONI (1955) 15
FIG.2-8 TWO CITROEN DS MODELLING APPROACHES: CURVE CONTOUR LINES (I.E. MULTIPLE FLOW LINES)& SECTIONAL SLICE LINES
(I.E.3 DOMINANT SLICE LINES) 16
FIG.2-9 EXAMPLES OF SLICING AND SIGNIFICANT MODELLING PROBLEMS 16
FIG.2-10 VARIOUS FLUID CURVES ARE USED FOR 3-D MODEL INTERPRETATION AND REPRESENTATION 17
FIG.2-11 VARIOUS FLUID CURVES ARE USED FOR 3-D MODEL INTERPRETATION AND REPRESENTATION 17
FIG.2-12 MODELLING IN 3-D CURVED LINES, SHOWN IS TOP-RANKING MODEL (SEE ALSO FIG.2-4-DS1) 18
FIG.X1-01 SETUP PENCIL SKETCHING BENCH (X1) 22
FIG.X1-02 ORTHOGONAL DRAWING (4) OF A CITROËN DS AND DIAGRAM OF SETUP X1 23
FIG.X1-03 START OF TEST PROCEDURE PARTICIPANT WITH SKETCHING CONSTRAINT 24
FIG.X1-04SKETCH PARTICIPANT NO.X1-15 24
FIG.X1-05SKETCH PARTICIPANT NO.X1-07 24
FIG.X1-06 SKETCH PARTICIPANT NO.X1-23 25
FIG.X1-07SKETCH PARTICIPANT NO.X1-12 25
FIG.X1-08SKETCH PARTICIPANT NO.X1-22 25
FIG.X1-09SKETCH PARTICIPANT NO.X1-11 26
FIG.X1-10RANKED BY TIME (LEFT = FAST, RIGHT = SLOW) 28
FIG.X1-11RANKED BY QUALITY (LEFT = GOOD, RIGHT = SUFFICIENT) 28
FIG.X1-12RANKED BY COMBINED RESULTS (LEFT = GOOD, RIGHT = SUFFICIENT) 29 FIG.X1-13RANKED BY EXPERTISE GROUP (LEFT = HIGH-END, RIGHT = LOW-END) 29
FIG.X2-01 SETUP SAND SKETCHING BENCH (X2) 31
FIG.X2-02 ORTHOGONAL DRAWING OF A CITROËN DS AND TYPICAL SETUP X2 31 FIG.X2-03 START OF TEST PROCEDURE PARTICIPANT WITH SKETCHING CONSTRAINT MARKED ON SAND SURFACE 32
FIG.X2-04 SKETCH PARTICIPANT NO.X2-10 32
FIG.X2-05 SKETCH PARTICIPANT NO.X2-04 33
FIG.X2-06 SKETCH PARTICIPANT NO.X2-06 33
FIG.X2-08 SKETCH PARTICIPANT NO.X2-22 34
FIG.X2-09 SKETCH PARTICIPANT NO.X2-25 34
FIG.X2-10 RANKED BY TIME (LEFT = FAST, RIGHT = SLOW) 36
FIG.X2-11 RANKED BY QUALITY (LEFT = GOOD, RIGHT = SUFFICIENT) 36 FIG.X2-12 RANKED BY COMBINED RESULTS (LEFT = GOOD, RIGHT = SUFFICIENT) 37
FIG.X2-13 RANKED BY EXPERTISE GROUP (LEFT = HIGH-END, RIGHT = LOW-END) 37
FIG.X3-01 SETUP STEAM SKETCHING BENCH (X3) 39
FIG.X3-02 ORTHOGONAL DRAWING OF A CITROËN DS AND TYPICAL SETUP X3 39
FIG.X3-03 START OF TEST PROCEDURE PARTICIPANT IN FRONT OF FOGGED-UP MIRROR 40
FIG.X3-04 SKETCH PARTICIPANT NO.X3-16 40
FIG.X3-05 SKETCH PARTICIPANT NO.X3-40 41
FIG.X3-06 SKETCH PARTICIPANT NO.X3-02 41
FIG.X3-07 SKETCH PARTICIPANT NO.X3-22 41
FIG.X3-08 SKETCH PARTICIPANT NO.X3-23 42
FIG.X3-09 SKETCH PARTICIPANT NO.X3-36 42
FIG.X3-10RANKED BY TIME (LEFT = FAST, RIGHT = SLOW) 44
FIG.X3-11RANKED BY QUALITY (LEFT = GOOD, RIGHT = SUFFICIENT) 44
FIG.X3-12RANKED BY COMBINED RESULTS (LEFT = GOOD, RIGHT = SUFFICIENT) 45
FIG.X3-13RANKED BY EXPERTISE GROUP (LEFT = HIGH-END, RIGHT = LOW-END) 45
FIG.X4-01 SETUP SAND SCULPTING TEST BENCH (X4) 47
FIG.X4-02 DIAGRAM OF SETUP X4 47
FIG.X4-03 START OF TEST PROCEDURE PARTICIPANT WITH FORMABLE MASS IN SANDBOX. 48
FIG.X4-04 SAND SCULPTING PARTICIPANT NO.X4-05 48
FIG.X4-05 SAND SCULPTING PARTICIPANT NO.X4-17 49
FIG.X4-06 SAND SCULPTING PARTICIPANT NO.X4-22 49
FIG.X4-07 SAND SCULPTING PARTICIPANT NO.X4-32 49
FIG.X4-08 SAND SCULPTING PARTICIPANT NO.X4-24 50
FIG.X4-09 SAND SCULPTING PARTICIPANT NO.X4-16 50
FIG.X4-10RANKED BY TIME (LEFT = FAST, RIGHT = SLOW) 52
FIG.X4-11RANKED BY QUALITY (LEFT = GOOD, RIGHT = SUFFICIENT) 52
FIG.X4-12RANKED BY COMBINED RESULTS (LEFT = GOOD, RIGHT = SUFFICIENT) 53 FIG.X4-13RANKED BY EXPERTISE GROUP (LEFT = HIGH-END, RIGHT = LOW-END) 53
FIG.X5-01 SETUP WIRE PLYING BENCH (X5) 55
FIG.X5-02 DIAGRAM OF SETUP X5 55
FIG.X5-03 START OF TEST PROCEDURE PARTICIPANT WITH ENLARGED MODELLING CONSTRAINT 56
FIG.X5-04 WIRE FRAME PARTICIPANT NO.X5-27 56
FIG.X5-05 WIRE FRAME PARTICIPANT NO.X5-20 57
FIG.X5-06 WIRE FRAME PARTICIPANT NO.X5-05 57
FIG.X5-07 WIRE FRAME PARTICIPANT NO.X5-11 57
FIG.X5-08 WIRE FRAME PARTICIPANT NO.X5-24 58
FIG.X5-09 WIRE FRAME PARTICIPANT NO.X5-06 58
FIG.X5-10RANKED BY TIME (LEFT = FAST, RIGHT = SLOW) 60
FIG.X5-11RANKED BY QUALITY (LEFT = GOOD, RIGHT = SUFFICIENT) 60
FIG.X5-12RANKED BY COMBINED RESULTS (LEFT = GOOD, RIGHT = SUFFICIENT) 61 FIG.X5-13RANKED BY EXPERTISE GROUP (LEFT = HIGH-END, RIGHT = LOW-END) 61
FIG.X6-01 SETUP 3-DSOLID WORKS BENCH (X6) 63
FIG.X6-02 DIAGRAM OF SETUP X6 63
F .X6-04 3-DCAD .X6-19 65
FIG.X6-05 3-DCAD SKETCH PARTICIPANT NO.X6-20 65
FIG.X6-06 3-DCAD SKETCH PARTICIPANT NO.X6-12 65
FIG.X6-07 3-DCAD SKETCH PARTICIPANT NO.X6-01 66
FIG.X6-08 3-DCAD SKETCH PARTICIPANT NO.X6-22 66
FIG.X6-09 3-DCAD SKETCH PARTICIPANT NO.X6-18 66
FIG.X6-10RANKED BY TIME (LEFT = FAST, RIGHT = SLOW) 67
FIG.X6-11 RANKED BY QUALITY (LEFT = GOOD, RIGHT = SUFFICIENT) 68 FIG.X6-12RANKED BY COMBINED RESULTS (LEFT = GOOD, RIGHT = SUFFICIENT) 68
FIG.X6-13 RANKED BY EXPERTISE GROUP (LEFT = HIGH-END, RIGHT = LOW-END) 69
FIG.X7-01 SETUP VIRTUAL CLAY HAPTIC BENCH (X7) 70
FIG.X7-02 DIAGRAM OF SETUP X7 70
FIG.X7-03 START OF TEST PROCEDURE PARTICIPANT WITH MODELLING CONSTRAINT 71
FIG.X7-04 3-D VIRTUAL CLAY-MODEL PARTICIPANT NO.X7-09 72
FIG.X7-05 3-D VIRTUAL CLAY-MODEL PARTICIPANT NO.X7-04 72
FIG.X7-06 3-D VIRTUAL CLAY-MODEL PARTICIPANT NO.X7-17 72
FIG.X7-07 3-D VIRTUAL CLAY-MODEL PARTICIPANT NO.X7-21 73
FIG.X7-08 3-D VIRTUAL CLAY-MODEL PARTICIPANT NO.X7-13 73
FIG.X7-09 3-D VIRTUAL CLAY-MODEL PARTICIPANT NO.X7-15 73
FIG.X7-10 RANKED BY TIME (LEFT = FAST, RIGHT = SLOW) 75
FIG.X7-11 RANKED BY QUALITY (LEFT = GOOD, RIGHT = SUFFICIENT) 75
FIG.X7-12 RANKED BY COMBINED RESULTS (LEFT = GOOD, RIGHT = SUFFICIENT) 76
FIG.X7-13 RANKED BY EXPERTISE GROUP (LEFT = HIGH-END, RIGHT = LOW-END) 76
FIG.3-1 RANKED BY COMBINED RESULTS (LEFT = GOOD, RIGHT = POOR) 78
FIG.3-2 BEST GROUP PER EXPERIMENT (1ST RANK) 79
FIG.3-3 BEST GROUP PER EXPERIMENT (1ST RANK) 120
FIG.3-4 SECOND BEST GROUP PER EXPERIMENT (2ND RANK) 120
FIG.3-5 THIRD GROUP PER EXPERIMENT (3RD RANK) 121
FIG.4-1 RESEARCH FRAMEWORK COMPARING VARIOUS CAD DESIGN INTERACTION TOOLS 81
FIG.4-2 DESIGN PROCESSING USING PHYSICAL AND DIGITAL REPRESENTATION AS ENVISIONED IN RAWSHAPING FORMFINDING (RSFF
©2008) 82
FIG.4-3 SETUP VDA WORKBENCH AND RSFF-HDT 82
FIG.4-4 PROTOTYPE RSFF-HDTFEASIBILITY SCAN 83
FIG.4-5 PROTOTYPE EARLY PHASE RSFF-HDT, INCLUDING HI-SPEED CAMERAS AND USB WEBCAMS 84
FIG.4-6 USER INTERACTION AND HYBRID DESIGN TOOL SYSTEM EQUIPPED WITH STEREO CAMERAS 84
FIG.4-7 TACIT-TANGIBLE MODELLING, VIRTUAL MODELLING,3-DAM MODELLING, INTERFACE VISUALIZATION AND ITERATIVE
PROCESS STEPS WITH RSFF TOOL. 85
FIG.4-8 SETUP WORKBENCH VIRTUAL EMBODIMENT AND PHYSICAL PROTOTYPE RSFF-HDT 85
FIG.4-9 THE DESIGNER ENGAGED IN PHYSICAL INTERACTION STANDING AT WORKBENCH 86
FIG.4-10 INTERACTION WITH THE RSFF-HDT 86
FIG.4-11 SEQUENCES OF ITERATIVE MESHES DURING AN EVOLVING DESIGN PROCESS (A-I) ON THE RSFF-HDT 87 FIG.4-12 VIRTUAL SHAPING TOOL IN ACTION – POLYGON MESH ITERATIONS AND TRANSFORMATIONS 87
FIG.4-13 PROTOTYPE EARLY PHASE RSFFTOOL WITH KINECT (LEFT),VIRTUAL INSTANCES AND VISUALIZATION 88
FIG.4-14 DATA FLOW OF RSFF TOOL SYSTEM 88
FIG.4-15 PROTOTYPE EARLY PHASE RSFF-HDT- EQUIPPED WITH KINECT AND HYBRID UIA AND REPRESENTATION 89
FIG.4-16 PROTOTYPE EARLY PHASE RSFF-HDT- HYBRID IA AND REPRESENTATION 90
LIST OF TABLES
TABLE X1-1OVERVIEW PARTICIPANTS EXPERIMENT 1 21
TABLE X1-2TIME & QUALITY COMBINED (LEFT TO RIGHT - TOP TO BOTTOM) 27
TABLE X1-3 FINAL NUMERICAL RESULTS (RANKED BY TIME & QUALITY COMBINED) 99
TABLE X1-4 FINAL NUMERICAL RESULTS (RANKED BY TIME) 100
TABLE X1-5 FINAL NUMERICAL RESULTS (RANKED BY QUALITY) 101
TABLE X2-1OVERVIEW PARTICIPANTS EXPERIMENT 2 30
TABLE X2-2TIME & QUALITY COMBINED (LEFT TO RIGHT - TOP TO BOTTOM) 35
TABLE X2-3 FINAL NUMERICAL RESULTS (RANKED BY TIME & QUALITY COMBINED) 102
TABLE X2-4 FINAL NUMERICAL RESULTS (RANKED BY TIME) 103
TABLE X2-5 FINAL NUMERICAL RESULTS (RANKED BY QUALITY) 104
TABLE X3-1OVERVIEW PARTICIPANTS EXPERIMENT 3 38
TABLE X3-2 TIME & QUALITY COMBINED (LEFT TO RIGHT - TOP TO BOTTOM) 43
TABLE X3-3 FINAL NUMERICAL RESULTS (RANKED BY TIME & QUALITY COMBINED) 105
TABLE X3-4 FINAL NUMERICAL RESULTS (RANKED BY TIME) 106
TABLE X3-4 FINAL NUMERICAL RESULTS (RANKED BY QUALITY) 107
TABLE X4-1 OVERVIEW PARTICIPANTS EXPERIMENT 4 46
TABLE X4-2 TIME & QUALITY COMBINED (LEFT TO RIGHT - TOP TO BOTTOM) 51
TABLE X4-3 FINAL NUMERICAL RESULTS (RANKED BY TIME & QUALITY COMBINED) 108
TABLE X4-4 FINAL NUMERICAL RESULTS (RANKED BY TIME) 109
TABLE X4-5 FINAL NUMERICAL RESULTS (RANKED BY QUALITY) 110
TABLE X5-1 OVERVIEW PARTICIPANTS EXPERIMENT 5 54
TABLE X5-2 TIME & QUALITY COMBINED (LEFT TO RIGHT - TOP TO BOTTOM) 59
TABLE X5-3 FINAL NUMERICAL RESULTS (RANKED BY TIME & QUALITY COMBINED) 111
TABLE X5-4 FINAL NUMERICAL RESULTS (RANKED BY TIME) 112
TABLE X5-5 FINAL NUMERICAL RESULTS (RANKED BY QUALITY) 113
TABLE X6-1 OVERVIEW PARTICIPANTS EXPERIMENT 6 62
TABLE X6-2 TIME & QUALITY COMBINED (LEFT TO RIGHT - TOP TO BOTTOM) 67
TABLE X6-3 FINAL RESULTS AFTER CALCULATIONS (RANKED BY TIME & QUALITY COMBINED) 114
TABLE X6-4 FINAL RESULTS AFTER CALCULATIONS (RANKED BY TIME) 115
TABLE X6-5 FINAL RESULTS AFTER CALCULATIONS (RANKED BY QUALITY) 116
TABLE X7-1 OVERVIEW PARTICIPANTS EXPERIMENT 7 69
TABLE X7-2 TIME & QUALITY COMBINED (LEFT TO RIGHT - TOP TO BOTTOM) 74
TABLE X7-3 FINAL NUMERICAL RESULTS (RANKED BY TIME & QUALITY COMBINED) 117
TABLE X7-4 FINAL NUMERICAL RESULTS (RANKED BY TIME) 118
CONTENTS
PREFACE V
SUMMARY VI
SAMENVATTING VII
LIST OF ABBREVIATIONS VIII
LIST OF FIGURES IX
LIST OF TABLES XII
CONTENTS XIII
CHAPTER 1 - INTRODUCTION 1
1.1THE RAWSHAPING FORMFINDING PARADIGM (RSFF) AND FRAME OF MIND –EARLY PHASE RESEARCH 1
1.2ON INTUITION AND COGNITION IN SUPPORT OF MNEMONIC NETWORKS IN PCP AND/OR PEP 4
1.3THE RAWSHAPING FORMFINDING PARADIGM (RSFF) AND FRAME OF MIND –EARLY PHASE RESEARCH 4
1.4HEURISTICS IN DESIGN PROCESSING 5
1.5TECHNOLOGY SCAN ON THE POTENTIAL OF VIRTUAL FORMGIVING IN DESIGN EDUCATION (2004) 6 1.5.1 VFG a multi-disciplinary survey on design interaction and representation 8 1.6ON CAD-AGENERIC VIEW ON COMPUTER-AIDED DESIGN AND PEP/PCP 9
1.7THE NEXT STEP IN CAD&TOOLS (BRIDGING THE DESIGN GAP) 10
CHAPTER 2 - EDUCATION 11
2.1EDUCATIONAL TESTING AND ASSESSMENT OF THE RSFFMETHODOLOGY 11
2.2ANALYSIS AND EVALUATION RESULTS OF EDUCATIONAL DESIGN TASK 12
2.3INTERPRETATION OF FORM ORGANIZATION 14
2.4DEFINING MEAN QUALITY (MQ) FOR A SIMPLE EFFECTIVE REPRESENTATION OF AN AUTOMOTIVE DESIGN ICON 15
2.5MODELLING IN SLICES VS MODELLING IN CURVES 16
2.5.1 Modelling in slices without total overview 16
2.5.2 Modelling in 3-D curved lines 17
2.6RESEARCH QUESTION 18
2.7MQESTABLISHED FOR SEVEN REPRESENTATIONAL TESTS 18
2.7.1 Correlation coefficient for the trend lines 19
2.8PRELIMINARY CONCLUSIONS OF THE EARLY-PHASE EDUCATION TEST RESULTS 20
CHAPTER 3 - SEVEN REPRESENTATIONAL DESIGN EXPERIMENTS 21
3.1INTRODUCTION TO TESTING AND EXPERIMENTATION 21
3.2EXPERIMENT 1-PENCIL AND PAPER SKETCHING 21
3.2.1 Typical setup X1 22
3.2.2 Design representation task description X1 22
3.2.3 Design representation task X1 23
3.2.4 User interaction X1 23
3.2.5 Tangible test results X1 (selection) 24
3.2.6 Overall ranking results pencil sketching test 27
3.2.7 Analysis and evaluation X1 27
3.3EXPERIMENT 2–SAND SKETCHING 30
3.3.1 Typical setup X2 30
3.3.2 Design representation task description X2 30
3.3.3 Representation task X2 31
3.3.5 Tangible test results X2 (selection) 32
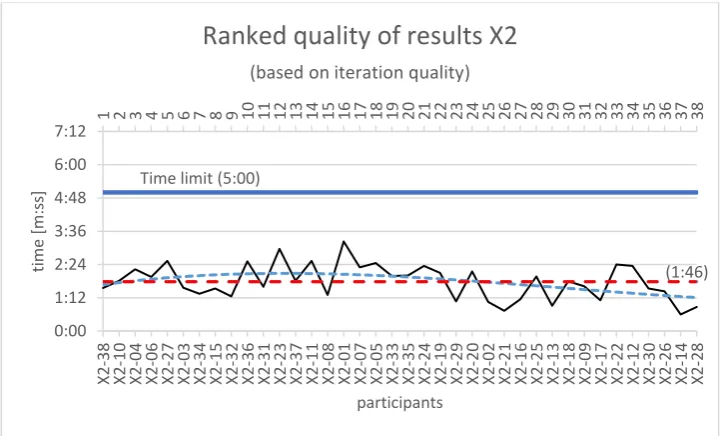
3.3.6 Overall ranking results sand sketching test 35
3.3.7 Analysis and evaluation X2 35
3.4EXPERIMENT 3-STEAM SKETCHING 38
3.4.1 Typical setup X3 38
3.4.2 Design representation task description X3 38
3.4.3 Representation task X3 39
3.4.4 User interaction X3 39
3.4.5 Tangible test results X3 (selection) 40
3.4.6 Overall ranking results ranking results steam sketching test 43
3.4.7 Analysis and evaluation X3 43
3.5EXPERIMENT 4–(3-D)SAND SCULPTING 46
3.5.1 Typical setup X4 46
3.5.2 Design representation task description X4 46
3.5.3 Representation task X4 47
3.5.4 User interaction X4 47
3.5.5 Tangible test results X4 (selection) 48
3.5.6 Overall ranking results sand sculpting test 51
3.5.7 Analysis and Evaluation X4 51
3.6EXPERIMENT 5–WIRE PLYING (3-D) 54
3.6.1 Typical setup X5 54
3.6.2 Design representation task description X5 54
3.6.3 Representation task X5 55
3.6.4 User interaction X5 55
3.6.5 Tangible test results X5 (selection) 56
3.6.6 Overall ranking results wire plying test (3-D) 59
3.6.7 Analysis and evaluation X5 59
3.7EXPERIMENT 6–3-DCADSOLID WORKS 62
3.7.1 Typical setup X6 62
3.7.2 Design representation task description X6 62
3.7.3 Representation task X6 63
3.7.4 User interaction X6 64
3.7.5 Tangible test results X6 (selection) 64
3.7.6 Overall ranking results 3-D Solid Works test 67
3.7.7 Analysis and evaluation X6 67
3.8EXPERIMENT 7–(3-D)VIRTUAL CLAY WITH HAPTIC FORCE-FEEDBACK DEVICE 69
3.8.1 Typical setup X7 69
3.8.2 Design representation task description X7 70
3.8.3 Representation task X7 71
3.8.4 User interaction X7 71
3.8.5 Tangible test results X7 (selection) 71
3.8.6 Overall ranking results virtual clay test 74
3.8.7 Analysis and evaluation X7 75
3.9ANALYSIS METHOD AND RESULTS 76
3.9.1 Combined results normalised over seven experiments 78
CHAPTER 4 - EARLY PHASE PROTOTYPING RSFF TOOLS 81
4.1TOWARDS TACIT TANGIBLE CAD SYSTEMS 81
4.2DESIGN AND BUILD A FUNCTIONAL RSFF-HDTPROTOTYPE 83
4.2.1 Vision system and 3-D image acquisition 83
4.2.2 Tacit- tangible CAD interaction with RSFF-HDT 85
4.3NEXT STEP RSFF-HDTPROTOTYPE WITH KINECT AND PRINCIPLE FUNCTIONALITY 87
4.3.2 Depth map construction from Kinect data points 89 4.3.3 Converting depth map data into 3-D objects for 3-D modelling 90
4.3.4 3-D model representation and visualization 90
4.3.5 Preliminary Conclusion 91
CONCLUSION 93
FUTURE WORK 95
REFERENCES 96
APPENDIX 99
A–X1 SPREAD SHEETS (PENCIL & PAPER) 99
A–X2 SPREAD SHEETS (SAND SKETCHING) 102
A–X3 SPREAD SHEETS (STEAM SKETCHING) 105
A–X4 SPREAD SHEETS (SAND SCULPTING) 108
A–X5 SPREAD SHEETS (WIRE PLYING) 111
A–X6 SPREAD SHEETS (3-DCAD) 114
A–X7 SPREAD SHEETS (3-DVIRTUAL CLAY) 117
B–GROUP RANK RESULTS 1ST,2ND AND 3RD 120
CHAPTER 1
- INTRODUCTION
1.1 The Rawshaping Formfinding Paradigm (RSFF) and Frame of Mind
–
Early Phase
Research
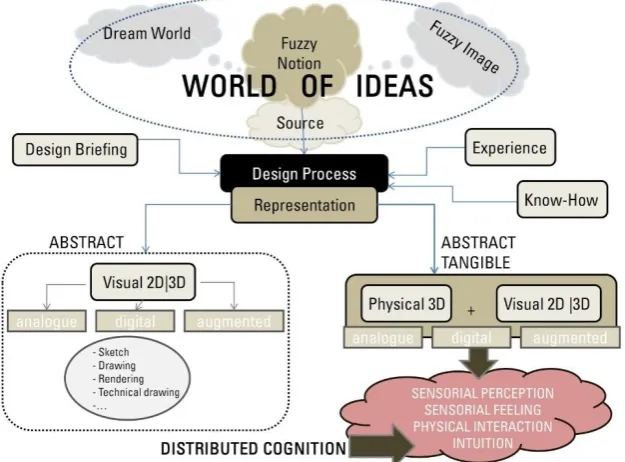
[image:17.595.141.454.252.483.2]To start a product creation process (PCP) and/or product engineering process (PEP), one of the first things a designer does is, after initially been documented or briefed, to pick up a pencil and paper and starts to sketch first ideas or impressions. These representations are quick, mostly random thoughts committed to paper and while sketching they start to portray the outlines of possible solutions for a specific design problem or task. Slowly but steady, these sketches become more sure, stable, and subsequently, through iterative steps, ideas become more clear, concise, and structured (Fig. 1-1).
Fig. 1-1 Human capacity to externalize meta-cognitive abilities (Wendrich, 2013)
Fig. 1-2 Product design process by means of 3-D material representation (Wendrich, 2008)
In this way the designer/engineer starts to represent and materialize ideas directly into touch-and-feel semantics and nudges itself into three-dimensional space by making use of the positive-negative connotations derived from ready-made or quick-thumb artefacts (i.e. low-resolution prototypes).
Fig. 1-3 Various Cube Sketch Representations
In sketching, for example a cube on paper (Fig. 1-3), the feeling of three-dimensions emerge from taking a certain perspective, the placement of lines, adding shadows applying hatching and so forth. The viewer will get some kind of notion of what the design entails without directly fully understanding the scope of the represented object. After all, the represented cube will stay an approximation and
most certainly an interpretation of the designer's mind’s eye, frame of mind, and inherent skills as
indicated and presented in the diagram on page 5 in Fig. 1-6 Left.
[image:18.595.145.453.72.306.2]
In representing and/or shaping a similar cube in a material or three-dimensional structure (Fig. 1-4), the designer has to think of many more aspects of the cube than in the case of sketching solely on paper. While trying to shape and form the cube, one has to make decisions on the fly about size, ratio and proportion, whilst producing and constructing a geometric object. By making use of tools, like for example; scissors, knife, ruler, glue, pliers, spatulas, etc. and a particular material (i.e. paper, cardboard, clay, sheet metal etc.), the designer supports the ideation process and the representational quality of the cube progressions in three-dimensions.
After tinkering and experimenting with several possible outcomes (iterative instances) the designer arrives at having many different cubes. All cubes represent and present manifestations within or outside the limits (set off constraints) of the designer's scope and ideas about the initial task, problem definition, and solution space.
Whilst materialising, constructing and representing the various cubes the designer creates knowledge and understanding of the problem space. At the same time ignites insight and feedback on all the essential elements of size, dimension, space, structure and construction needed to further the design process. Simultaneously the aspects of form, shape, aesthetic value and creative experiment are addressed and hitherto strengthen the problem-solving and design outcome (Fig. 1-6 Right, page 5).
Another beneficial factor in using the material-shaping-process is the allowance of ambiguous, uncertain, or accidental happenings (cookie luck). During tinkering and toying, the designer allows the unknown and unexpected into the process. Events that happen all of a sudden while cutting or shaping, setting off directions that are fully free from thought (intuition) or steered manipulation. In the event that something goes 'wrong' with the cube, the designer will continue to alter and change the shape to his liking without being distracted or misled by any fixed directions or preconceived notions.
Fig. 1-5 Tangible Serendipitous Cube Representations
1.2 On Intuition and Cognition in Support of Mnemonic Networks in PCP and/or PEP
Much research is dedicated to understand and come to terms with the intuitive qualities and traits of humans and the role it plays in for example memory and experience in judgment and problem solving (Dreyfus & Dreyfus, 1986; Meehl, 1957; Miller & Ireland, 2005; Lehrer, 2009;). Intuition in the context of discovery evolved out of the philosophical tradition that clearly implied intuition as a means of discovering basic truths unconsciously. Kahneman et al. (1974) challenged this concept stating that intuitive judgements are often misguided since they are overdetermined by a variety in cognitive heuristics. However, in some cases cognitive heuristics can be helpful if appropriately invoked (Nisbett et al., 1983). Determined cognitive heuristics such as representativeness and availability, and underdetermined normative considerations such as sample size, base rate, and regression effects implied this reasoning. While acknowledging that cognitive heuristics can sometimes be helpfully and appropriately invoked (Nisbett, Krantz, Jepson, & Kunda, 1983), the critical consensus clearly implies that intuition is frequently if not typically a systematic source of error in human judgment (Ross, 1977). We doubt this consensual reasoning very much, since it lacks in our opinion very much to take into account the advantages that individual knowledge and experience entails invoked through intuition (Bowers et al., 1988; Wendrich, 2009). Uncertainty and unexpected insights, decisions and choices (intuited) are particularly of interest and highly relevant to creativity and design ideation especially in the context of discovery (Reichenbach, 1938; Polanyi, 1966; Gigerenzer, 2007; Wendrich, 2009). Thus, human cognition is by its very nature intuitive, it inevitably involves the activation of internal and external mnemonic networks by relevant information (Anderson, 1983; Worthen & Hunt, 2011). What differs from one person to another is the nature and amount of information that has already been mnemonically encoded, as well as the complexity, gradient, and speed of the inter-associative connections (Andersen, 1983; Mednick, 1962; Simonton, 1988; Mlodinow, 2009). When a productive hunch or insight goes considerably beyond the information given (Bruner, 1961-1965; Westcott, 1968; Thaler & Sunstein, 2008; Lehrer, 2009; Wendrich, 2009), it is often described respectfully as intuitive, and people who are especially adept at generating productive hunches are often deemed intuitive in this qualitative sense. In essence we could say that everyone is considered intuitive, so far as clues to coherence activate relevant mnemonic networks. According to Worthen et al. (2011), mnemonics are useful in almost any situation in which learning and memory are the goals, but one size does not fit all. The effectiveness of a mnemonic requires that the technique matched to the particular circumstances of application (Worthen & Hunt, 2011).
1.3 The Rawshaping Formfinding Paradigm (RSFF) and Frame of Mind
–
Early Phase
Research
In the light of the aforesaid, RSFF emphasis on 3-D intuitive interaction design (IxD) where the designer is affected, engaged, and immersed in conjunction with hybrid design tools (HDT) (e.g. virtual formgiving) to develop ideas and/or innovative concepts during the product creation process (PCP) and/or product engineering process (PEP). The mix of real- and virtual worlds (hybrids), enable the designer to freely transform, translate, and manipulate two- and/or three-dimensional objects that become manifested in both the real and the virtual realms. In terms of timing, speed ratio, and clock frequency of the sequential process steps, this blending could be executed either in real-time, near real-time, on demand, or based on choice-architecture. Based on early stage research and investigation (Wendrich & Tideman, 2004) some preliminary aspects and points of interest in mixed reality (MR), in terms of advantageous and disadvantageous issues and topics were synthesized. The following points are construed to mark and envision the RSFF paradigm (See also Chapter 1.5.1): Apparent advantages of RSFF:
• Bringing out the tacit and tangible knowledge during design processing
• Intuitive meta-cognitive triggering and interaction during design processing
• Allowing and bringing out the idiosyncrasy of the designer
• Decrease in software program-direction steering
• More user control during ideation and conceptualization
• Untethered two-handed interaction with tangible materials
Relevant disadvantages and constraints of current digital design tools and methods:
• Intimate knowledge required of 3-D systems
• High or steep learning curve (threshold)
• Interaction constraints due to program-direction
• Workflow interruptions due to latency and program-direction
• Increase in process execution time in relation to level of expertise
• No intuitive and/or tacit (implicit) input possible
Fig. 1-6 The early-stage RSFF Frame of Mind ideation process (Wendrich, 2010)
1.4 Heuristics in Design Processing
in separating activities surrounding analysis and synthesis, rather than recognizing their duality. With the application of a heuristic, one is not merely recollecting previous solutions in order to apply them to similar problems, but instead, actively and dynamically constructing new solutions. Design heuristics may serve as a starting point for transforming an existing concept, altering it to introduce variation, or define variations among individual design elements. They may be most useful in preventing fixation or lingering on already-considered elements. Our hybrid approach constitutes on the exploration and experimental tradition, where we rely on an assortment of heuristics and operate mostly in a highly unpredictable, stochastic, and/or probabilistic manner across boundaries and often un-structured approaches. The oscillation between real and virtual realities merges the autonomy of user and machine (HMI) this will progressively enrich the intuitive user experience, increase knowledge acquisition, and advance insight in understanding (Csikszentmihalyi, 1990; Wendrich et al., 2009).
1.5 Technology Scan on the Potential of Virtual Formgiving in Design Education (2004)
After a thorough technology (Wendrich et al., 2010) scan, the conclusion was that the creation and development of a hybrid design tool (HDT) would benefit the design and design engineering industry. The tool could be an excellent addition to the existing and emerging tools and methods by assisting designers in their physical and virtual design process. The creation of a preliminary RST-framework (Fig. 1-7 and Fig. 1-8) is based on the combination of (a) a thorough technology scan (Fig. 1-9), (b) findings and results from questionnaires, devised for the purposes of a multi-disciplinary survey on the potential of Virtual Formgiving (VFG) in Design Education (Wendrich & Tideman, 2004), and (c) educational embedding of design tasks, processes and experimentation (see Chapter 2). This preliminary RST-framework for the analysis and evaluation of tangible-tactile interactions along a set of parameters and dimensions was devised to come to understand and create insight in the different levels of abstractions and similarities between the physical and digital representation activities. The framework allows us to explore novel devices in the design space, user’s intuition, device and tool capabilities, and underlying functionalities/semantics of CAD systems.
Fig. 1-9 Technology Scan (2010) (Wendrich, 2010)
1.5.1
VFG a multi-disciplinary survey on design interaction and representation
design engineering program over the last five years. There seems to be a predominance in abstract representation (visual) over material representation (reflective material representation) in most design educational programs (Woolley, 2004). More emphasis was laid on the use of both sensory perception, tactility and sensory feeling (Gilles, 1991; Hartson, 2003) within design assignments, hence the apparent dramatic increase in material representation in conjunction with the abstract representation. Learning in design is enabled through continually challenging abstract representations against material (reflective) representations (Schön, 1983 - 1992; Goldschmidt & Porter, 2004). This comparison between representations reveals gaps that inspire further design activity, experimentation and research.
Combined findings and results lead to possible requirements for further development of RST-HDT’s:
• Tool creates more insight and understanding
• Tool has low threshold in learning curve
• Tool increases processing speed in solution space
• Tool implies visual and tangible representation
• Tool triggers easy ideation and conceptualizing
• Tool generates and allows simulation
• Tool allows intuitive un-tethered interaction
1.6 On CAD - A Generic View on Computer-Aided Design and PEP/PCP
McCullough (1996) stated: ‘We must look very closely at craft. As a part of developing more engaging technology, as well as developing a more receptive attitude toward opportunities raised by technology, we must understand what matters in traditional notions of practical, 'form-giving' work.' This will require the study of tools, human-computer interaction and practice of the digital medium.'
Computers are not programmed to sense and cognitively understand the designer’s ideas and fuzzy thoughts that are externalized and transformed during the early-phases of a design process. As stated
by Simon (1983); “The computer was made in the image of the human.” Furthermore, current
computer aided design (CAD) tools have limited capabilities when it comes to translating tangible materials and models into digital/virtual representations. CAD programs use basic geometric mathematical elements and splines curves for shape and form representation (i.e. 2-D lines, arcs, B-Splines, 3-D lines, NURBS).
A powerful concept of RSFF is the combination of iteration speed, fast externalization, reduced level of detail (LOD), thinking-on-your-feet, learning-by-doing, reflection-in-action, reflection-on-action and application of loosely-fitted structures in 2-D and 3-D modelling (Schön, 1983).
1.7 The Next Step in CAD & Tools (Bridging the Design Gap)
With the RST-methodology the design and creation of ‘low-resolution’ models or modelling processes,
in conjunction with computational assistance could possibly significantly reduce the computation
load, increase performance, enhance interaction and lead to ‘fast’ tool (interface) response times. This
is both true for analogue tools as well as digital design tools.
In comparison, complex digital CAD systems, with plenty of menu/dialog driven computational functions, are expected to create ‘steep’ learning curves and will have a disruptive effect on transferring the creative flow of ideas into digital/virtual representations (Csikszentmihalyi, 1990; Wendrich et al., 2009).
Therefore, the following hypotheses are framed and based on the assumptions that:
• Fast and responsive design tools with analogue tangible feedback is what designers prefer as
a tool of choice.
CHAPTER 2
- EDUCATION
2.1 Educational Testing and Assessment of the RSFF Methodology
Several methods and strategies were devised and used as experiments within teaching and learning
contexts, ranging from very abstract-physical assignments to 5-phase design methods (i.e. idea
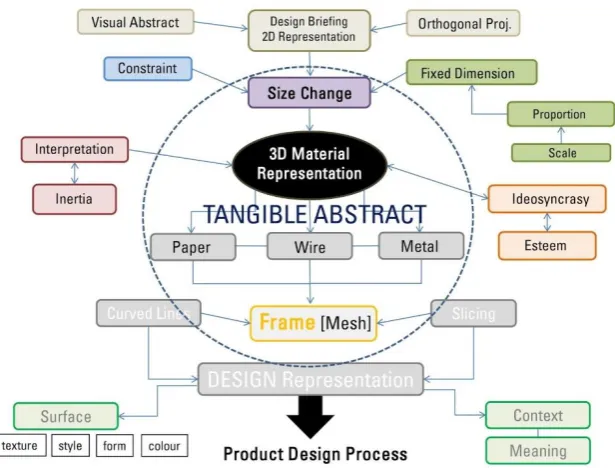
phase-concept phase-final phase-concept phase-execution phase-presentation phase). During this educational approach, a seemingly more structured method is assigned to design an artefact. In such we hand students an orthogonal projection (Fig. 2-1) of an automotive design icon (Citroën DS) on A4 paper-format. The elevations are in proportion, but not to a specific scale! The first task is to size-change (scaling) the elevation drawings to an exact dimension: 488 x 180 x 147 mm (Fig. 2-2, top left and top middle). Many students seem to find this a difficult task and noticeably many variations in size-change become apparent. Some students will take no direct action, contemplating, deliberating and thinking about their approach and following step. The assignment was to fabricate, form and shape, in conjunction with a 2-D orthogonal drawing of an automotive design icon, a three-dimensional wire-frame model of this artefact. The material used in most cases is aluminium wire and tape. The study and translation is based on and devised as a representational form study, finding and discovering aesthetic criteria, triggering aspects of form-giving and expanding the geometric vocabulary of novice designers (Fig. 2-2).
Fig. 2-1 2-D orthogonal drawing of design icon
Educational design task aims:
1. Translating 2-D orthogonal projection in 3-D tangible form and shape.
2. To discover different design approaches and form giving methods in 2-D to 3-D
representation.
3. Finding form and aesthetic criteria in tangible objects
4. Exploring form structure that results from form organization
5. Enhancing tacit knowledge, understanding and imagination
A wide variety and diversity in model representation and/or solutions due to difference in shape and proportions, as well as in form and textures were observed and notable. Learning-by-doing,
thinking-on-your-feet, and knowing-in-action are hard to “measure” and at the same time promising concepts
knowing and tangible modelling complement each other in a way it enhances results while allowing better understanding and more insight. Other advantages are an increase in self-esteem, confidence, value, awareness, passion and sense-of-ownership.
Fig. 2-2 Educational design experiment on 2-D to 3-D representation (From left to right, top to bottom: size-changing, tangible-tacit manipulation with reflective material, 3-D wire-frame
construction, final 3-D representation)
RSFF Design Task procedure and process for testing the students:
1. Getting to know and understanding RSFF
2. Setting up of new experiments
3. Enrolling participants in new experiments
4. Capturing and observing RSFF design processing
5. Administrating results of experiments
6. Analysing, evaluating and reporting the captured data
7. Presentation
To obtain knowledge about the effectiveness and emergent methodology of RSFF, the results should provide data, insight and understanding in correlation with the hypotheses postulated in paragraph 1.7.
RSFF Design Task effectiveness and representation performance in education:
• Understanding of tacit and tangible knowing
• Knowledge acquisition of 3-D tangible interaction
• Knowledge acquisition of RSFF design processing
• Acquiring insight in 3-D manipulation and representation
• Implementation of the RSFF intuitive 3-D design process
2.2 Analysis and evaluation results of educational design task
study, finding and discovering aesthetic criteria, triggering aspects of form-giving and expanding the geometric vocabulary of novice designers. All 36 models are placed in a ranking order the best result to the worst result (Fig. 2-3 and Fig. 2-4). The best model has been given number 01 and the worst model is number 36. In Figure 2-5 we show the multi-variables in solutions and representations that stem from the same design task, constraints and requirements. The diversity and variety in solutions and multiplicity in representative quality and interpretation is highly noteworthy and extremely
thought-provoking (Wendrich, 2010).
Fig. 2-3 Selection of 36 models and ranked in order of quality only (from left to right / top to bottom 01-36, whereby 01 is the best executed model representation)
Fig. 2-5 Wire frame DS and surface texture examples on DS wireframes (showing variety in shape and form, diversity in solutions and representations and a plethora in interpretations)
2.3
Interpretation of Form Organization
The interpretation and type of chosen slicing method based on the 2-D drawing determine the outcome. Mistakes and personal perspective in this stage have a direct effect on the model right from the start and will clearly show in the end result. Incorrect interpretations are frequently made. For example: the assumption that front hood midline is the headlight line. This is clearly not the case as shown in Figure 2-6.
The front hood is a difficult part in the shape of the Citroen DS. Figures 2-6 A, B, C, and D show the correct corresponding lines in a 3-D model of the Citroen and the drawing. Figure 2-6 F shows that
also a front view doesn’t really clarify the situation. In this case actually only a 3-D model shows
correctly how the model should be build. Another possibility is a ‘see through’ line of the front hood in the side-view of the drawing. Besides the fact that the drawing is hard to interpret, there is one incorrect interpretation that happens frequently which becomes clear from carefully inspecting the drawing. The pink line in Figure 2-6 D is frequently mixed up with line B. The result is that the front-hood is one piece in the model, without the characteristic separation of headlights and front-hood as Figure 2-6 E illustrates (Fig. 2-4 - DS17). With this the aesthetic and functional appeal of the model becomes significantly blurred and whimsical in representation.
2.4 Defining Mean Quality (MQ) for a Simple Effective Representation of an Automotive
Design Icon
[image:31.595.76.510.387.627.2]Modelling and interpretation of a 3-D model/wireframe is all about relations and distances between wires, views, surfaces etc. Correct distances between the wires give the model the right proportions and aesthetic quality. Contour lines of 3-D shapes are sometimes only visible from one specific 3-D view angle with a very narrow deviation from this angle before the next contour line appears for the same 3-D shape. These curved lines can be used as a starting point for constructing curved contour lines or sectional slice lines. Some of the curved lines can represent a hard separation edge between two or more surfaces. These line elements are still viewable from a much larger angle and signify a real distinctive 3-D trackable part on the surface of the 3-D shape.
Fig. 2-7 Citroen DS (2-D drawing and 3-D sculpting), design Flaminio Bertoni (1955)
Fig. 2-8 Two Citroen DS modelling approaches: curve contour lines (i.e. multiple flow lines) & sectional slice lines (i.e. 3 dominant slice lines)
2.5 Modelling in Slices vs Modelling in Curves
From the earlier educational tactile studies between 2004 and 2009, two significant modelling methods emerged (Fig. 2-8) after evaluating and analysing the tangible-tactile results of 150 individual iterations concluding this experimentation. Representation was either done by 3-D curves or by way of slicing (i.e. merging of elevation views).
2.5.1
Modelling in slices without total overview
In the case a designer builds the model from slices derived from the orthogonal drawing (Fig. 2-1) there is no need to have a total overview of the shape and form in advance. If the designer works precisely and uses the side- and top-views there is no chance of going wrong if the side- and top-views are correct and clear. However, types of problems that are found in this type of modelling are (Fig 2-9):
● Double use of side-views / elevations
● Location and placement of slice (-s)
● Missing or omitting a view(-s)
Fig. 2-9 Examples of slicing and significant modelling problems
a) Double use of side-views / elevations: To make a 3-D model an inviting option is to double the
side-view and then connect the two parts (i.e. similar to extrude in CAD). This is an easy way to get a 3-D model, but this model will never get the right shape and form. In the line-up of
the models (Fig. 2-3) the “artefact cars” with a double us of the side-view all end up at the end
of the row. All models with the use of a double side-view totally miss the translation and articulation of the front- and back view.
Observation: One side-view should be used in the middle of the model to get a good result.
b) Location/placement of slice (-s): The location of the slices can cause problems. In a front or
at the front or more in the middle. Also for the top-view it should be clear at which level this top-view is visible. In the models the top-view is mainly used as the lowest slice, but in fact the DS narrows down at the bottom. This means the top-view should be placed higher than the bottom.
Observation: To get a good result it should be clear where a specific view or section is located.
c) Missing or omitting a view (-s): The best result will be gained when every view is translated in
the model. The absence of front and side-views leads to inferior models.
Observation: To get the best result every view should be translated in the model.
2.5.2
Modelling in 3-D curved lines
Curved lines from the 2-D drawing have been used to create a 3-D model. The lines that are picked for the modelling are not exact outlines or sections but fluent lines that cover more than one view (Fig. 2-10 and Fig. 2-11). When modelling in 3-D curved lines the scaled 2-D drawings (view and elevations) are being used to create 3-D models. The chosen lines for executing the curved line model are not exact outlines or translated sectional views but flowing and fluent lines in 3-D space that cover more than one view or section and are combined / blended in the interpretative model/wireframe.
Fig. 2-10 Various fluid curves are used for 3-D model interpretation and representation
Fig. 2-11 Various fluid curves are used for 3-D model interpretation and representation
Fig. 2-12 Modelling in 3-D curved lines, shown is top-ranking model (see also Fig. 2-4 - DS1)
Modelling and interpretation of shape and form in 3-D curves generates the best representation and generates superior models if set-off against the slicing methods. Based on the aforesaid, we conclude
that to establish a MQ, 3-D curved lines models are virtually closest to the real model of the Citroen
DS car (Fig. 2-7). The actual Citroen DS was designed by a blended method of representational design methods, 2-D and 3-D sketching and drawings in conjunction with 3-D sculpting and prototyping (Fig. 2-7).
2.6 Research Question
The preliminary results and outcomes from the early-phase educational design tasks, showed promising outcomes and progressions.
In correlation with and aligned to these early-phase experimentations, seven design process test-benches were devised and developed to study and investigate various interaction modalities in congruence with execution time during an iterative design task process. The expected data coming from these seven tests are generated to gain more understanding, knowledge and apprehension in the relation between interaction modality, tool use, affordances, speed of interaction, iteration performance, and representation quality. The end-result of a design process or design task is not the only factor determining the final ranking. The iterative process (i.e. speed, duration, affordance) in itself is equally of importance and weigh on establishing the final ranking. Chapter 3 explains the process more in detail.
Research Question:
How fast (i.e. interaction-iteration speed) can one make a qualitative representation based on implicit (tacit) knowledge and skills, explicit tools, constraint-based execution, predefined time-set and reflective material?
2.7 MQ Established for Seven Representational Tests
In Chapter 3 the MQ for the seven representational tests and experimentations will be based on the MQ definitions as described and established in Section 2.5. We defined a weighted ranking that signify the relation between quality descriptors, tool interaction and iteration speed. The following formula will establish and generate the mean and will result in a weighted rank:
(T + Q) / 2 = R [Eq. 2-1]
Key to symbols: Q = Design Ranking
T = Ranking Average Iteration Time
The average is easy to calculate from two values and ranking on the list, except when a tie occurs this will generate a problem. For solving the tie as best as possible, a new tie break column (TBC) is needed. In effect, the weighted ranking with the tie break in the new column is calculated using the following formula:
((R * max_data_rows + T) * max_data_rows) + Q = TBC [Eq. 2-2]
The symbol “max_data_rows” equals the value that represents the length of the list per experiment.
This number is not a fixed rule for the “tie-break calculation” (TBC) strategy, it helps to get rid of some
unwanted floating-point number calculations. This way integer numbers are used for calculation, even if this means the numbers can get quite large very fast.
Formula Eq. 2-2 in algebraic notation:
𝑎 ∙ 𝑥2+ 𝑏 ∙ 𝑥 + 𝑐 = 𝑑 [Eq. 2-3]
In eq. 2-3 the variables a to c follow the order of importance for the input data columns. The output
variable d will result in an unique “tie-break” number. All rows from the spreadsheet should have an
unique number to be ranked and sorted. Finally, the data points can be plotted in a XY scatter chart.
The calculation results are sorted in ascending order, as described and shown in the analysis and evaluation diagrams of the seven experiments (see Chapter 3 and Appendix A).
2.7.1
Correlation coefficient for the trend lines
To improve the readability and facilitate easy comparison of the various experiment diagrams, we use
trend lines (3rd order polynomial) instead of actual real data points. Therefore, the visualization of
indicative trend lines are an approximation, showing the correlation coefficient (CC) between the actual number of hits on the weighted data points including data point deviations.
The choice for 3rd order polynomial trend lines was initially based on a graphical approximation of the
scattered data points per experiment. A trend line with the availability of two curvatures would fit nicely. When reviewing the CC from the first order (linear), over second order, to the third order polynomial trend line, the optimized curve fitted trend line showed too little increase in approximating the actual data points. Further increase to an even higher order polynomial trend line would not add more precision, only more mathematical and graphical complexity. Main purpose of the trend line is to visually reduce the number of curvatures between the data points and visualizes a possible mathematical trend curve in the scattered data.
A perfect match (100 %) equals a full CC that targets all actual data points, however in all cases this condition will never be fully met. The CC is defined as a numerical value between -1 and 1, where 0 means no correlation at all. The plus indicates an ascending slope, whereas the minus depicts a downward slope. In diagram Fig. X7-13 all seven trend lines are shown and illustrate clearly the variety and diversity of data points over the seven experimental results.
2.8 Preliminary Conclusions of the Early-Phase Education Test Results
CHAPTER 3
- SEVEN REPRESENTATIONAL DESIGN EXPERIMENTS
3.1 Introduction to Testing and Experimentation
In this Chapter seven tangible-haptic representational configurations and set-ups are introduced. The seven experiments are specifically designed and build for tacit-tangible experimentations and testing purposes. All seven experiments are tested with a variety of users with various skill- and expertise
levels in order to establish a heterogeneous distribution in representation results. The aim of the
experimentations is to measure, explore, and qualify the effectiveness of untethered and tethered tool use; apparent routines, mediation of restraints, signs of flow and stall, as well as gestural and skill development. Therefore, the assumption is that all seven individual experiments combined, will provide more knowledge, detailed insight and better understanding in intuition, tacit knowing, user-interaction (UIA), tool use, skill application, tactile perception, tangibility, and representation. Furthermore, all seven experiments are also based on the findings and results that stem from educational exercises; particularly the DS-Icon assignment (see Chapter 2). The core driver of each experiment is that each participant has to imagine (i.e. mindset, tacit knowledge) and interpret (i.e. mental image) how to reconstruct an automotive artefact into a 3-D visualization. In effect, to translate, manipulate, and transform a 2-D drawing (orthogonal projection) into a 3-D perspective representation. The externalization of tacit-tangible knowledge about the artefact, to trigger spatial insight, performance speed and enhance cognitive understanding of the artefact is key to the seven experiments. To bring out these factors of knowing is highly probabilistic, ambiguous and idiosyncratic in terms of interpretation and perception. Furthermore, the intuition and experience of the participants are tested with a variety and mixture of representational design tools (i.e. traditional
analogue and digital), time- and constraint-based.The tests are performed by bachelor and master
students Industrial Design Engineering (IDE) of the University of Twente. Additionally, we include expert designers and staff members of Engineering Technology (ET) in the user-test groups. Every experiment will be performed in a controlled setting in conjunction with a facilitator for guidance and observation. All experimentation and individual testing are videotaped and will be analysed afterwards. Video Interaction Analysis (VIA) (Jordan & Henderson, 1995) is used to analyse and evaluate the outcomes and results.
3.2 Experiment 1 - Pencil and Paper Sketching
Experiment 1 (X1) is based on freehand pencil sketching on standard A3 size of paper1. A group of 25
individual participants (19 male and 6 female) executed this first test. This X1 group consisted of 60 % BSc. (novice) and 20 % MSc. students (advanced) in the age of 18-26 years. The final 20 % were expert designers (i.e. lecturers IDE) in the age of 25-36 years. A detailed overview of participants is shown in Table X1-1.
Table X1-1
Overview participants Experiment 1
Participants X1
(Pencil & Paper)
25 19 6 15 5 5
100 % 76 % 24 % 60 % 20 % 20 %
18-36 years 18-26 years 25-36 years
Total Male Female Novice Advanced Expert
3.2.1
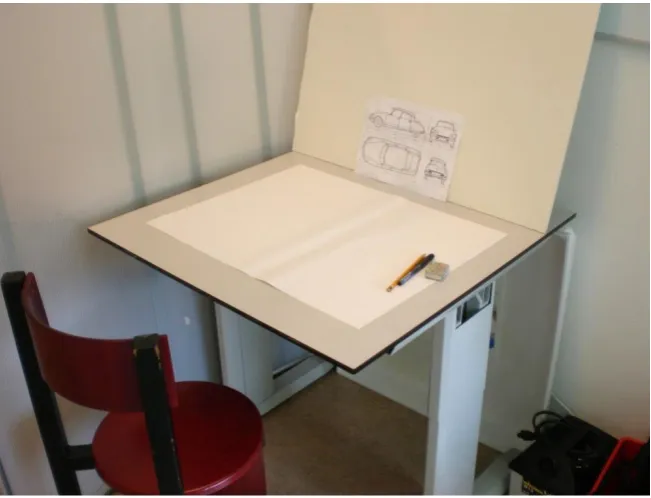
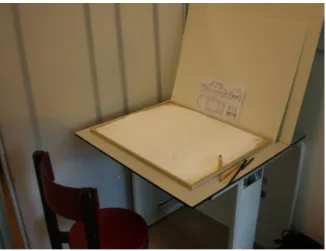
Typical setup X1
The X1-setup is kept very simple and effective in lay-out. A chair and a table allow the participant to comfortably sit and work during the test. In X1 traditional design tools are provided, such as pencil, fine-liner, and an eraser. A five-minute time limit is set for this experiment. However, in some cases we allowed additional time (Fig. X1-03).
3.2.2
Design representation task description X1
The participant is seated during the duration and execution of the test. The facilitator’s role is to instruct, observe, and capture the user-interaction (UIA) on video (Fig. X1-01). The facilitator provides a brief set of instructions and explains the X1 procedure as follows;
• Facilitator shows and hands the A4 to the participant and explains the meaning of the 2-D
drawing (Fig. X1-01).
• The design task of X1 is explained to the user.
• The template is placed on the A3 sketch paper and explained to the user.
• The facilitator asks consent of the user to capture UIA on video.
• A time constraint of 5 minutes is instructed.
[image:38.595.135.461.343.592.2]• Start and execution of design task X1.
Fig. X1-02 Orthogonal drawing (4) of a Citroën DS and diagram of setup X1
3.2.3
Design representation task X1
Individual participants are asked to interpret and create 3-D sketches based on the orthogonal drawing of the artefact (Fig. X1-02 left). The goal is to 3-D sketch, represent, and interpret as fast as possible the main features and characteristics of the automotive artefact. A perspective template enforcing a size constraint (Fig. X1-02 right and Fig. X1-03) is used to serve as temporary placeholder. The perspective template provides the participant with an initial direction and position on the sketch-plane. This constraint-based procedure is necessary to be able to compare (rank) the individual sketches, effectiveness and quality of the results after the experimentation concluded.
3.2.4
User interaction X1
Fig. X1-03 Start of test procedure participant with sketching constraint
3.2.5
Tangible test results X1
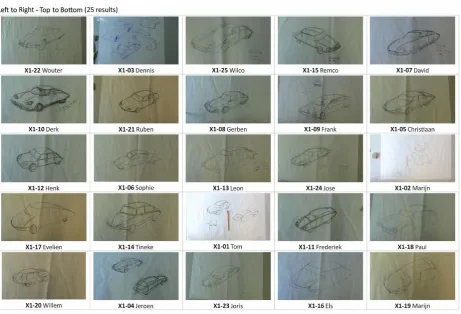
(selection)In Figure X1-04 to Figure X1-09 a selection of X1- representation results are shown. The presented selection has no particular order or based on qualitative indicators. The images show the variety and diversity in solutions and representational visualizations.
Fig. X1-04 Sketch participant no. X1-15
Fig. X1-06 Sketch participant no. X1-23
Fig. X1-07 Sketch participant no. X1-12
Fig. X1-09 Sketch participant no. X1-11
3.2.6
Overall ranking results pencil sketching test
Table X1-2
Time & quality combined
(left to right - top to bottom)In Table X1-2 the final ranked result are shown for experiment X1. The top left result equals position number 1. From left to right the numbering increases until the bottom right. This position equals the last position, based on the combined time and quality qualifiers.
Ranking the results makes it easier to see the gradual differences, from poor results all the way up to the best result. When the quality is weighted by the factor iteration time rank, we can differentiate between fast and slow iterations in relation to similar quality results in shape and form organisation.
While ranking by the iteration time is straight forward, ranking by design quality is quite subjective. The criteria for ranking the shape and form organisation (quality) was mainly based on the MQ as explained in Sections 2.4 through 2.6. Translation from 2-D to 3-D with respect to the original proportions was the next qualifier. And the level of detail (LOD) was another important qualifier. The experiment description did not mention the designer to aim for highly detailed drawings, though the pencil and paper medium allowed for a lot more detail. This detailing pointed the facilitator to interrupt the experiment and terminate or extend (in later experiments) the session.
3.2.7
Analysis and evaluation X1
Fig. X1-10 Ranked by time (left = fast, right = slow)
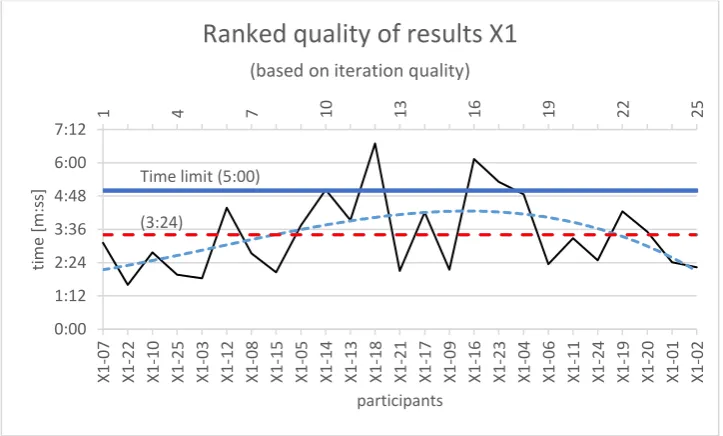
Presented in Fig. X1-10 are all 25 individual results (black jagged line). A steady curve (3rd order
polynomial) trend line (blue dashed curve) results in a CC = 99,6 %. The average iteration time is 3’ 24”
(red dash line) which stays well below the 5 minutes time limit.
Fig. X1-11 Ranked by quality (left = good, right = sufficient)
When we display the quality ranked iterations as in Fig. X1-11, the data points get more irregular and
jagged (black line). The (3rd order polynomial) trend line (blue dashed line) becomes convex curved
with a CC = 51,3 %.
Time limit (5:00) (3:24)
1 4 7 10 13 16 19 22 25
0:00 1:12 2:24 3:36 4:48 6:00 7:12 X1-2 2
X1-03 X1-25 X1-15 X1-21 X1-0
9
X1-02 X1-06 X1-01 X1-24 X1-0
8
X1-10 X1-07 X1-11 X1-20 X1-0
5
X1-13 X1-17 X1-19 X1-12 X1-04 X1-14 X1-23 X1-16 X1-18
ti
me
[m:s
s]
participants
Ranked time results X1
(based on avg. iteration time)Time limit (5:00) (3:24)
1 4 7 10 13 16 19 22 25
0:00 1:12 2:24 3:36 4:48 6:00 7:12 X1-0 7
X1-22 X1-10 X1-25 X1-03 X1-1
2
X1-08 X1-15 X1-05 X1-14 X1-1
3
X1-18 X1-21 X1-17 X1-09 X1-1
6
X1-23 X1-04 X1-06 X1-11 X1-24 X1-19 X1-20 X1-01 X1-02
ti
me
[m:s
s]
participants
[image:44.595.117.479.376.594.2]