University of Warwick institutional repository: http://go.warwick.ac.uk/wrap
This paper is made available online in accordance with publisher policies. Please scroll down to view the document itself. Please refer to the repository record for this item and our policy information available from the repository home page for further information.
To see the final version of this paper please visit the publisher’s website. Access to the published version may require a subscription.
Author(s): A. J. Window, A. Hentz, D. C. Sheppard, G. S. Parkinson, H. Niehus, D. Ahlbehrendt, T. C. Q. Noakes, P. Bailey, and D. P. Woodruff
Article Title: V2O3(0001) Surface Termination: Phase Equilibrium Year of publication: 2011
Link to published article:
The V
2O
3(0001) surface termination: phase equilibrium
A.J. Window1, A. Hentz1*, D.C. Sheppard1, G.S. Parkinson1†, H. Niehus2‡, D.
Ahlbehrendt2, T.C.Q. Noakes3, P. Bailey3, D.P. Woodruff1,4∗
1
Physics Department, University of Warwick, Coventry CV4 7AL, UK
2
Humboldt-Universität zu Berlin, Institut für Physik, Newtonstr. 15, D-12489 Berlin,
Germany
3
STFC Daresbury Laboratory, Warrington WA4 4AD, UK
4
Fritz-Haber-Institut der Max-Planck-Gesellschaft, Faradyweg 4-6, 14195 Berlin, Germany
Abstract
Complementary but independent medium-energy and low-energy ion scattering studies of the (0001) surfaces of V2O3 films grown on Pd(111), Au(111) and Cu3Au(100) reveal a
reconstructed full O3-layer termination creating a VO2 surface trilayer. This structure is fully
consistent with previous calculations based on thermodynamic equilibrium at the surface during growth, but contrasts with previous suggestions that the surface termination comprises a complete monolayer of vanadyl (V=O) species.
PACS: 68.35.B-; 68.47.Gh; 68.49.Sf
*
Present address: Universidade Federal do Rio Grande do Sul, Instituto de Fisica, Avenida Bento Gonçalves 9500,
91501-970 Porto Alegre, RS, Brazil
† Present address: Institüt für Angewandte Physik, TU Wien, 1040 Wien, Austria
‡ Also at: Divisão de Metrologia de Materiais (DIMAT), INMETRO, CEP 25250-020, Xerém, Duque de
Caxias, RJ, Brazil
Oxide surfaces in general, and those of vanadium oxides in particular, play a major role in practical heterogeneous catalysis [1], yet there have been very few quantitative experimental
structure determinations. The (0001) faces of corundum-phase structures, notably V2O3, α
-Al2O3, and Cr2O3, are particularly interesting because there are several distinctly different
atomic layers at which the bulk structure might be terminated. One fundamental question
that is particularly relevant to these materials is whether, in practice, a surface can be created that is truly in equilibrium with its surroundings under preparation conditions. Starting from a bulk crystal of the oxide one might anticipate that it may be difficult to overcome the kinetic barriers to achieve this equilibrium under conditions of temperature and oxygen partial pressure accessible to surface science experiments. Alternatively, epitaxial growth of the oxide on a suitable substrate, by deposition of metal vapour in the presence of a partial pressure of oxygen, may offer a better means of achieving this gas-solid equilibrium. Growth is intrinsically a non-equilibrium process, yet by using low metal deposition rates in an excess of oxygen gas, the kinetic barriers to achieving equilibrium may be much lower than those needed to modify an existing non-equilibrium surface. In fact, previous structural
studies of the surface of bulk crystals of α-Al2O3 and Cr2O3, and of Cr2O3 produced by
oxidation of metallic Cr, appear to be broadly consistent with the theoretically-predicted equilibrium structure. By contrast, spectroscopic, imaging, and chemical studies of the V2O3(0001) surface of epitaxial films grown in situ have been interpreted in terms of a
non-equilibrium surface (e.g. [2, 3, 4, 5, 6]). Here we show that two independent quantitative experimental determinations of the structure of V2O3(0001), using distinctly different ion
scattering methods, demonstrate that the structure does correspond to the equilibrium state predicted in density functional theory (DFT) calculations. We find this is true for the surfaces of V2O3 films grown under conditions that are both similar to, and distinctly
different from, those used in the earlier explorations of these surfaces. We discuss how these
apparently conflicting views of the surface may be reconciled.
Relative to the (0001) basal plane, the bulk structure of V2O3 comprises alternate buckled
layers containing 2 metal atoms per unit mesh, and planar layers containing 3 oxygen atoms per unit mesh; this layer structure is denoted here as ….O3VV’O3VV’O3VV’….. (Fig. 1).
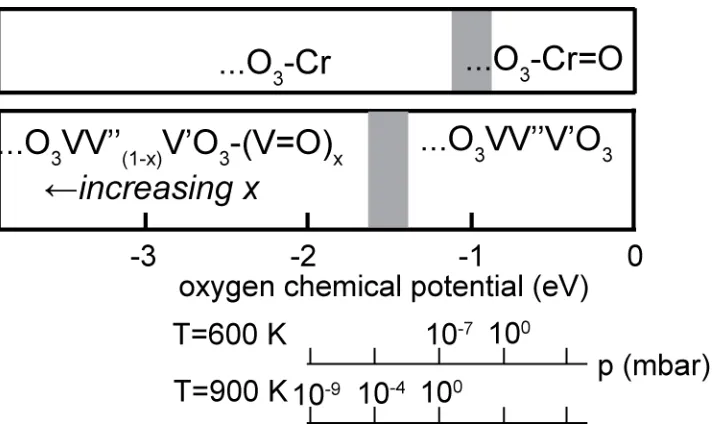
Vibrational spectroscopy [2, 3] indicates that vanadyl species, V=O, occur on the surface, and this has, together with scanning tunnelling microscopy images [4] and X-ray absorption spectroscopy [5], been interpreted as indicating that the stable structure is half-metal terminated but with O atoms atop all surface V atoms to produce a (1x1) vanadyl phase (Fig. 1). However, DFT calculations show [7, 8] that for typical preparation temperatures (~600-900 K), and partial pressure of oxygen (~10-7-10-5 mbar), the equilibrium surface structure
should actually be oxygen-terminated, possibly with partial coverage of V=O species on this surface (Fig. 2). This O3 termination is found to be stabilised by a reconstruction in which
the upper half-layer of V atoms in the second VV’ layer move up into the outermost VV’ layer to produce a …VO3VV’’V’O3 structure. In this termination the outermost O3V3O3
layers have the stoichiometry and local structure characteristic of VO2. According to these
DFT results, the (1x1) pure vanadyl termination, ….V’O3V=O, is never the equilibrium
structure, but is closest to equilibrium at oxygen chemical potential values beyond the left-hand edge of Fig. 2, far from those achievable experimentally. The only previously-published experimental structural study, using photoelectron diffraction, provided support for a half-metal termination, with or without vanadyl O atoms, but did not consider the possibility of the O3 termination [9]. An unpublished low energy electron diffraction
(LEED) study has found good theory-experiment agreement for the vanadyl-terminated structure [10].
The structural studies reported here exploit the techniques of medium-energy ion scattering (MEIS) and low-energy noble gas impact-collision ion scattering spectroscopy with detection of neutrals (NICISS) using, respectively, 100 keV H+ and 3 keV He+ incident ions. The MEIS experiments were performed at the Daresbury Laboratory UK National MEIS facility [11] on V2O3(0001) films grown in situ on Pd(111) and Au(111) substrates. The
NICISS data, obtained in a true 180° backscattering geometry [12], were obtained at the
Humboldt University in Berlin [13] on V2O3(0001) films grown on a Cu3Au(100) substrate.
Note that the fact that the symmetries of the substrates contain elements not present in V2O3
~570 K, followed by heating to ~670 K for 1-2 mins in vacuum. On Au(111) films up to 200 Å thickness were grown using a single dose (1-3 hours) at the same temperature and partial pressure, followed by annealing for 10-20 mins at 770 K in an oxygen pressure of 5x10⁻⁸ mbar. Both methods are closely similar to those used previously by others [3, 4]. Growth on Cu3Au(100), oxygen pretreated to form a CAOS (Copper Au Oxygen Surface) substrate,
was effected by depositing V at 300 K, followed by annealing at 650 K in 5x10⁻⁷ mbar
oxygen, leading to a V2O3(0001) film thickness of ~25 Å [13, 14].
Both ion scattering methods exploit the influence of ‘shadow cones’, created by elastic scattering from surface atoms, which exclude ions from regions behind the scattering atoms. In MEIS [15
12
] (with narrow shadow cones ~0.2-0.3 Å) fixed incident geometries are chosen to illuminate a few near-surface atomic layers, and one exploits the shadow cones produced by the scattering from near-surface atoms that ‘block’ the outward trajectories of ions first scattered by atoms from lower atomic layers. Dips in the ‘blocking curve’ of scattered ion intensity as a function of scattering angle are thus characteristic of the relative positions of atoms in the outermost few atomic layers. In NICISS [ ], using much lower energies, and He+ rather than H+ incident ions, the much stronger scattering and wider shadow cones (~2
Å) preclude significant sub-surface scattering. Using a 180° scattering angle, which ensures
that shadowing effects are almost identical in incidence and scattered trajectories, one can exploit the near-neighbour shadowing of the outermost layer atoms. The NICISS experiments reported here were conducted at fixed grazing incidence angles and variable azimuthal angles.
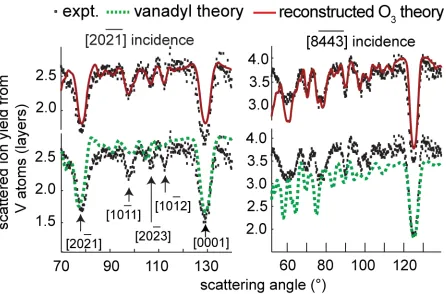
Fig. 3 shows experimental MEIS blocking curves of scattering from V atoms, recorded at two different crystallographic incidence directions, compared with the results of simulations using the VEGAS computer code [16], for two different structural models. These
experimental data were recorded from a 200 Å V2O3 film grown on Au(111); essentially
identical data were obtained from the thinner films grown on Pd(111). Fig. 3 shows clearly
experiment.
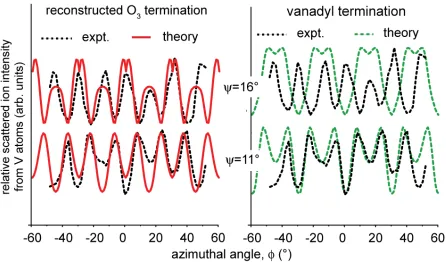
Fig. 4 shows the key experimental results of the NICISS experiments; azimuthal scans of the scattered ion yield from V atoms, recorded at two different grazing incidence angles, are compared with the results of simulations using the FAN computer code [17] for the same two structural models. For these data, too, the simulations based on the reconstructed O3
termination model provide a greatly superior description of the experimental data. In
particular, all the main maxima in the experimental azimuthal plots recorded at 11°
incidence switch to main minima when the incidence angle is increased to 16°; this
behaviour is reproduced for the O3 termination, but not for the vanadyl model, nor for other
models tested including half-metal and full-metal terminations (not shown). Table 1 provides a comparison of the best-fit values of the outermost interlayer spacings found in the two experimental studies and in the earlier DFT calculations; the agreement is good and the results are consistent.
This structural conclusion for V2O3(0001) contrasts with that of previous experimental
investigations of other corundum-phase surface structures, α-Al2O3(0001) [18, 19] and
Cr2O3(0001) [20, 21, 22, 23
18
]. For α-Al2O3(0001) the half-metal termination is favoured by
LEED [ ] and surface X-ray diffraction (SXRD) [19] studies, as well as DFT studies [24 20
]. For Cr2O3(0001) the original LEED study also favoured a half-metal termination [ ], but
later work indicated there may be fractional occupation of other sites [21, 22, 23]. The main conclusions of the DFT calculations [25] for the predicted equilibrium phases of the surfaces of V2O3(0001) and Cr2O3(0001) at different oxygen chemical potential values in the gas
phase are summarised in Fig. 2. For values in the range -1 eV to -1.5 eV, typical of the
preparation conditions, theory predicts for these two surfaces, the O3 and half-metal
terminations, respectively. Interestingly, at slightly smaller negative oxygen chemical
potentials (higher partial pressures) the chromyl, Cr=O, termination becomes stable on Cr2O3, consistent with observation of the associated Cr-O stretching mode in vibrational
spectroscopy after oxygen exposure [26 23
surface studies of corundum-phase surfaces are consistent with the predicted thermodynamic equilibrium, whether produced from bulk crystals, oxidation of a metal crystal, or via epitaxial growth in situ. Note that Fig. 2 and this discussion relates to the equilibrium between the surface and gas phase; the DFT studies indicate that under most surface preparation conditions VO2 and CrO2 bulk phases are more stable that the V2O3 and Cr2O3,
but these calculations take no account of the stabilising influence of the substrate epitaxy,
nor of the energetic barrier to a bulk structural transformation.
It remains to account for previous conclusions that the V2O3(0001) surface adopts the
non-equilibrium (1x1) vanadyl termination. The observation of a vanadyl V=O stretching frequency in vibrational spectroscopy is the most significant evidence for this interpretation, this provides no information on the vanadyl coverage. In fact partial coverage of vanadyl species, on an otherwise reconstructed-O3 termination, is consistent with the predicted
equilibrium structure within a range of oxygen chemical potentials close to those experienced by the growing crystal (Fig. 2). Our results are not incompatible with this possibility, although we find no explicit evidence for their presence; while ion scattering simulations of (random) partial occupation of different sites cannot easily be performed, we estimate (from Figs. 3 and 4) that up to 10-20% partial occupation of vanadyl sites could be consistent with our data. A predominantly O3 termination is also consistent with a
photoelectron diffraction study of hydroxylated V2O3(0001) which concluded that the
hydroxylated O atoms occupied (predominantly or exclusively) sites in a complete O3 layer,
and not in surface vanadyl species [27]. STM might be expected to distinguish the vanadyl termination, with one V=O surface species per unit mesh, from the O3 termination, with
three surface O atoms per unit mesh, but theoretical simulations indicate that both terminations should lead to a single atomic-scale protrusion per unit mesh [28]. There seems good reason, therefore, to reassess the interpretation of some of the conclusions of earlier
work on this surface insofar as they are be based on the assumption that the surface is fully vanadyl terminated. Our results indicate that is not the case, and that contrary to previous
suggestions, the V2O3(0001) surface structure, like that of Cr2O3(0001) and α-Al2O3(0001),
does correspond to that predicted in DFT calculations of the thermodynamic equilibrium with the gas phase under preparation conditions. Specifically, V2O3(0001) has a
Acknowledgements
Table 1. Interlayer spacings in the reconstructed O3 model as found in the original DFT
study [7] and in the MEIS and NICISS studies reported here. The labelling of the layers from the bulk is …V’(3)-O3(3)-V(2)-O3(2)-V(top)-V’’(top)-V’(top)-O3(top) . In NICISS
ions do not penetrate to the sub-surface layers. The precision in the MEIS and NICISS
values is ~±0.1 Å.
Parameter DFT [7] MEIS NICISS
V’(top)-O3(top) (Å) 0.86 0.91 0.85
V’’(top)-V’(top) (Å) 0.19 0.18 0.05
V(top)-V’’(top) (Å) 0.19 0.18 0.05
O3(2)-V(top) (Å) 0.99 0.98 -
V(2)-O3(2) (Å) 1.44 1.27 -
O3(3)-V(2) (Å) 1.06 0.98 -
Figure Captions
Fig. 1 Side views (viewed along [2110]) of V2O3(0001), showing three possible surface
terminations. In the reconstructed O3 termination second-layer V’ atoms move up to become
[image:10.612.87.519.98.282.2]Fig. 2. Simplified diagram showing the equilibrium surface phases of the V2O3(0001) and
Cr2O3(0001) surfaces under different conditions of oxygen partial pressure and temperature
in DFT calculations [7, 25]. For V2O3 the region on the left corresponds to partial coverage
Fig. 3 Comparison of experimental 100 keV H+ MEIS blocking curves from V2O3(0001)
grown on Au(111), recorded in two different incidence directions, with the results of VEGAS simulations for the reconstructed O3 and vanadyl termination models. The scattered
[image:12.612.90.536.96.390.2]Fig. 4 Comparison of experimental 3 keV He+ NICISS azimuthal scans from V2O3(0001)
grown on Cu3Au(100), recorded at two different grazing incidence angles, with the results of
[image:13.612.86.532.53.315.2]References
1 B. Grzybowska-Świerkosz, F. Trifirò, and J. C. Vedrine (eds) Appl. Catal. A 157, 1 (1997).
2 J. Schoiswohl et al., Surf. Sci. 555, 101 (2004). 3 A. –C. Dupuis et al., Surf. Sci. 539, 99 (2003).
4 S. Surnev, M. G. Ramsey, and F. P. Netzer, Prog. Surf. Sci. 73, 117 (2003). 5 C. Kolczewski et al., Surface Sci. 601, 5394 (2007).
6 D. Göbke et al., Angew. Chem. Int. Ed. 48, 3695 (2009). 7 G. Kresse et al., Surf. Sci. 555, 118 (2004).
8 T. K. Todorova, M. V. Ganduglia-Pirovano, and J. Sauer, J. Phys. Chem. B 109, 23523 (2005).
9 E. A. Kröger et al., Surf. Sci. 601, 3350 (2007).
10 Y. Romanyshyn and H. Kuhlenbeck, H. –J. Freund, to be published. 11 P. Bailey, T.C.Q. Noakes, and D.P. Woodruff, Surf. Sci. 426, 358 (1999).
12 H. Niehus, W. Heiland, and E. Taglauer, Surf. Sci. Rep. 17, 213 (1993) 13 H. Niehus, R. -P. Blum, and D. Ahlbehrendt, Surf. Rev. Lett., 10, 353 (2003). 14 H. Niehus, R. P. Blum, and D. Ahlbehrendt, Phys. Stat. Sol. A 187, 151 (2001). 15 J.F. van der Veen, Surf. Sci. Rep. 5, 199 (1985).
16 R.M. Tromp and J.F. van der Veen, Surf. Sci. 133, 159 (1983).
17 H. Niehus and R. Spitzl, Surf. Interface Anal. 17, 287 (1991); a free copy of the FAN code can be requested via e-mail to [email protected]
18 C.F. Walters et al., Surf. Sci. 464, L732 (2000). 19 P. Guénard et al., Surf. Rev. Lett. 5, 321 (1998).
20 R. Rohr et al., Surf. Sci. 372, L291 (1997); erratum 389, 391 (1997). 21 Th. Gloege et al., Surf. Sci. 441, L917 (1999).
22 M. Lübbe and W. Moritz, J. Phys.: Condens. Matter 21, 134010 (2009). 23 O. Bikondoa et al., Ohys. Rev. B 81, 205439 (2010).
24 R. Di Felice and J.E. Northrup, Phys. Rev. B 60, 16287 (1999).
25 A. Rohrbach, J. Hafner, and G. Kresse, Phys. Rev. B 70, 125426 (2004). 26 B. Dillmann et al., Farad. Disc. 105, 295 (1996).
![Fig. 1 Side views (viewed along [2110] ) of V2O3(0001), showing three possible surface](https://thumb-us.123doks.com/thumbv2/123dok_us/9672161.469041/10.612.87.519.98.282/fig-views-viewed-v-o-showing-possible-surface.webp)