The effect of a multi-vendor loyalty programme
The effect of a multi-vendor loyalty programme
From a customer loyalty perspective
Eline Beltman Master in Business Administration University of Twente Innovation and Entrepreneurship
S1356879
1st supervisor: Ir. J.W.L. van Benthem
Acknowledgements
With this master thesis, an end has come to my study Business Administration at the University of Twente and also to my life as a student. I feel ready and excited to enter the labour market.
Writing a thesis is a process to be done by yourself. However, you are also dependent on professionals, family and friends and situations in your near surrounding. Therefore, I would like to thank a few people. I would like to thank my both supervisors, Jann and Raymond, for their guidance and believe in the subject I chose and their ability to accelerate the writing process at the end. I would also like to thank the organization that provided me with research opportunities and respondents, for their time and energy investments. Due to confidentially, I cannot name the organization and its people. I would like to thank my family and especially my parents for providing me a stable home, having all the faith in me that I would graduate, giving me time for that and not asking every day about the progress of the thesis. I would like to thank my friends for their support and the ‘Biebgangers’ for making the numerous days in the library more fun. Three people I would like to thank for their
substantive contributions to the thesis: Mariëlle and Merel for their critical reading skills and Linda for her advice regarding the graduation process.
Abstract
Loyalty programmes have become a familiar marketing tactic and appear in different designs. Regarding their organizational structure, single-vendor loyalty programmes, multi-vendor loyalty programme and joint loyalty programmes can be distinguished (Cao, Nsakanda, & Mann, 2010). The establishment of multi-vendor loyalty programmes is on the rise, however academic literature on the effects of this type of loyalty programme on customer behaviour is still in its infancy (Breugelmans et al., 2014; Dorotic, Bijmolt, & Verhoef, 2012; Lemon & Wangenheim, 2009; Rese, Hundertmark, Schimmelpfennig, & Schons, 2013). This explorative research aims to fill this gap, by answering the question: What is the effect of a multi-vendor loyalty programme on customer loyalty? The quantitative research strategy and the comparative design enabled the comparison of customer loyalty among members of a single-vendor loyalty programme and a multi-vendor loyalty programme, while both samples stem from one loyalty programme in Europe. With a self-completion survey, the two underlying constructs of customer loyalty are measured among 141 respondents: brand loyalty, consisting of behavioural and attitudinal loyalty, and programme loyalty.
The results show no statistical significant differences in customer loyalty between members of a single-vendor loyalty programme and a multi-vendor loyalty programme, meaning that in this research situation no effects of a multi-vendor loyalty programme on customer loyalty can be noted. Also on the levels of brand loyalty and programme loyalty no statistical significant differences are uncovered. Several test variables have been analysed as well. Satisfaction with the purchase process at the host or partner was not different between the two samples, whereas more satisfied members show higher levels of customer loyalty. Regarding partnership portfolio of multi-vendor loyalty programmes, members who appreciated the collaboration between the two vendors show higher levels of customer loyalty, as the same result is found for the level of how members evaluate the fit between the vendors. Although members of both samples differ on their length of membership with the programme, no significant interaction effect is uncovered, while length of membership is found to be a main effect with moderate effect size. The last finding revealed that members of both types of programmes do not show difference in holding the programme’s host responsible for their obtained reward, however: members of a single-vendor loyalty programme are more associated with unfamiliarity of which organization to hold responsible and holding another organization than the host of the loyalty programme responsible than multi-vendor loyalty programme members.
Concluding that in this research setting multi-vendor loyalty programmes have no different effects on customer loyalty than a single-vendor loyalty programme, this research made one of the first contributions on the effects of multi-vendor loyalty programme on customer loyalty. Beside this theoretical relevance, this research provides practitioners in the field with the advice that the
Table of contents
Acknowledgements ... I
Abstract ... II
1. Introduction ... 1
1.1 Research question 3
1.2 Theoretical and practical relevance 3
1.3 Outline 4
2. Theoretical framework ... 5
2.1 Loyalty programmes and the effect on customer loyalty 5
2.2 Partners in loyalty programmes 6
2.3 Customer loyalty 8
2.3.1 Brand loyalty 8
2.3.2 Programme loyalty 9
2.4 Conceptual model 10
3. Research methodology ... 11
3.1 Research strategy and design 11
3.2 Operationalization of concepts 12
3.3 Research site 13
3.4 Research instrument 13
3.5 Data analyses 15
4. Results ... 17
4.1 Sample description 17
4.1.1 Single-vendor loyalty programme 17
4.1.2 Multi-vendor loyalty programme 17
4.1.3 Customer loyalty 18
4.2 Effect of type of loyalty programme on customer loyalty 18
4.2.1 Effect of type of loyalty programme on brand loyalty 18
4.2.2 Effect of type of loyalty programme on programme loyalty 19
4.3 The relationship between satisfaction with the purchase process and customer loyalty 19
4.4 Correlation between level of appreciation of collaboration and customer loyalty 20
4.5 Correlation of the logic of selected partner and customer loyalty 20
4.6 Length of membership 21
4.7 Organization hold responsible for reward, from a customer’s perspective 21
5.1 Conclusions & discussion 23
5.2 Theoretical relevance 25
5.3 Practical relevance 25
5.4 Discussion of limitations and directions for future research 26
Bibliography ... 28
Appendix I. Internal consistency of measurement scales ... 32
Appendix II. Survey single-vendor loyalty programme and multi-vendor loyalty programme ... 33
Appendix III. Detailed information on samples ... 37
Appendix IV. Statistical analyses ... 39
1. Effect of type of loyalty programme on customer loyalty 39
2. Effect of type of loyalty programme on brand loyalty 40
3. Effect of type of loyalty programme on behavioural loyalty
41
4. Effect of type of loyalty programme on attitudinal loyalty 42
5. Effect of type of loyalty programme on programme loyalty 43
6. The relationship between satisfaction with the purchase process and customer loyalty 44
7. Correlation between level of appreciation of collaboration and customer loyalty 45
8. Correlation of the logic of selected partner and customer loyalty 45
9. Tests on length of membership and customer loyalty 46
1. Introduction
Stemming from relationship marketing, which is based on the principle that keeping customers is more valuable than attracting new customers, American Airlines was the first organisation to launch a loyalty programme that became famous all over the world (American-Airlines, 2011; Reichheld, 1996). Increasingly, after this introduction in the 1980s organizations introduced this marketing tactic. To visualize with some facts: in the United States in 2012 2.65 billion people were registered in a loyalty program; on average, that is 21.9 loyalty programmes per household (Berry, 2013). These loyalty programmes appear with different designs. These days, the classical design in which one organization exploits the programme, has been challenged by loyalty programmes in which organizations collaborate and become partners, so called multi-vendor loyalty programmes (Dorotic, Fok, Verhoef, & Bijmolt, 2011). To make and evaluate decisions concerning loyalty programme design, organizations aim to rely on academic literature. However, there appears to be a lack of academic literature on the influences of a multi-vendor loyalty programme on customer behavior. The effects on many aspects of the classical design are well discussed in literature (Dorotic et al., 2012). Yet, only a few academics distinguish between these different designs while measuring the effects on consumer behaviour (Rese et al., 2013). More specifically, it remains unknown what impact this multi-vendor loyalty programme has on customer loyalty (Breugelmans et al., 2014). This research will explore these effects with the unique design of comparing data from two samples of one target group: a single-vendor loyalty programme and a multi-vendor loyalty programme. This will be beneficial to companies, advising them if multi-vendor loyalty programmes are effective from the customer loyalty perspective or not and it will fill the void of the academic debate.
Loyalty programmes try to create a long-lasting relationship between the organization and the consumer. To establish this relationship, customers will be rewarded for purchases with the organization. The frequently used definition of loyalty programme is “structured marketing efforts which reward, and therefore encourage, loyal behavior: behavior which is, hopefully, of benefit to the firm” (Sharp & Sharp, 1997, p. 474). Dorotic et al. (2012) extend and specify this definition by arguing that a loyalty programme should enhance loyalty, need subscription of members in order to gain customers’ information, has a long-term focus, reward customers for their loyalty and it should include continuous marketing activities towards its target group.
organization. The third mechanism, personalized marketing, tries to make the programme even more attractive to the customer by offering for example personalized deals.
From a customers’ perspective, becoming a member of a loyalty programme is a trade-off between expected benefits and sacrifices (Leenheer, Van Heerde, Bijmolt, & Smidts, 2007). Expected benefits can be economic as well as non-economic benefits (Mimouni-Chaabane & Volle, 2010). Economic benefits are benefits like receiving discounts and non-economic benefits refer to sociological and psychological benefits like belonging to a group (Leenheer et al., 2007). The sacrifices consumers make by entering into a loyalty programme can also be divided in economic costs and non-economic costs. Economic costs can appear in the form of a fee when joining the loyalty programme (not applicable in every situation). Non-economic costs can come in the form of loss of customers’ privacy (Leenheer et al., 2007): personal information is one of the success-factors of the loyalty programme for the
organization (Berman, 2006c).
From the organizations’ point of view, a loyalty programme is seen as a marketing tool to enhance a relationship with the customer. Research on the effectiveness of loyalty programmes shows different findings, which might be attributed to the complexity of examining this effect (Leenheer et al., 2007). Sharp and Sharp (1997) emphasise that a loyalty programme should have effects on the average purchase frequency instead of on market penetration, because a loyalty programme focuses on existing customers rather than new customers. Other effects of loyalty programmes are the increase of net yearly revenues of a customer on average, lifetime duration, decrease of price sensitivity of customers, positive word-to-mouth advertisements and reverse members’ negative into positive evaluations compared to competitors (Bolton, Kannan, & Bramlett, 2000; Kumar & Shah, 2004; Leenheer et al., 2007; Meyer-Waarden, 2007).
Considering the design of a loyalty programme, typically one organization exploits the loyalty programme: customers become member, collect points and redeem these at the organization for their reward. Creating a partnership around a loyalty programme implies allying partners to the programme for which members can earn and/or redeem points (Breugelmans et al., 2014). From a customers’ perspective, a multi-vendor loyalty programme provides faster point collection, convenience and enlarge the possibilities for point redemption and increased perceived value (Dorotic et al., 2012; Dorotic et al., 2011). Additionally, customers have different needs and therefore value rewards
Although the relationship between loyalty programmes and customer loyalty is well discussed in academic literature, only a few academics differentiated between types of loyalty programmes and their effect on customer loyalty (Breugelmans et al., 2014; Dorotic et al., 2012; Lemon & Wangenheim, 2009; Liu & Yang, 2009; Reinartz, 2010; Rese et al., 2013) and therefore authors make a call for action (Breugelmans et al., 2014; Dorotic et al., 2012; Lemon & Wangenheim, 2009; Rese et al., 2013). This research aims at filling this gap, by giving an answer on the research question, as discussed in the following section.
1.1 Research question
To uncover what effect a multi-vendor loyalty programme has on customer behaviour, and specifically on customer loyalty, the following central research question has to be answered:
What is the effect of a multi-vendor loyalty programme on customer loyalty?
This research will take a quantitative research strategy with a comparative design. A comparative design differs from cross-sectional design, because it takes two samples into account instead of one. For this research customer loyalty among respondents from a multi-vendor loyalty programme is compared to those of a single-vendor loyalty programme. Data on customer loyalty was gathered by online self-completion surveys among respondents from a loyalty programme in Europe of a global commercial organization. To answer the research question, the gathered data was analysed using various statistical techniques. More detailed information about the methodology of this research can be found in chapter three.
1.2 Theoretical and practical relevance
1.3 Outline
This chapter introduced the topic of interest: loyalty programmes and the creation of partnerships around them, and formulated the research question. Chapter two discusses academic literature on multi-vendor loyalty programmes and customer loyalty and ends with the conceptual framework. Chapter three explains how an answer is given to the research question followed by chapter four, which presents the results of the surveys. Chapter five discusses these results in more detail and links this to literature from chapter two, thereby giving thoughtful conclusions and advises to academics as well as
2. Theoretical framework
The roots of loyalty programmes can be found in relationship marketing. The underlying idea of relationship marketing is the principle that acquiring new customers is more expensive than keeping customers to the organization and that the value of a customer increases with the length of the customer-organization relationship (Reichheld, 1996). To make these customers stick to the brand, customer-organizations can create relationships with the customer (Reichheld, 1996). Different marketing means are available, the so-called relationship marketing instruments or marketing tactics. These tactics can be distinguished into short-term and long-term tactics (Mason & Staude, 2009). Examples of short-term tactics are coupons and rebates and a loyalty programme is an example of long-term tactics. To establish such a loyalty programme, organizations have to make various decisions regarding its design, such as the associated decision to launch the programme alone or in collaboration with other organizations. Single-vendor loyalty programmes are frequently present, although partnerships in loyalty programmes are becoming more apparent in practice (Breugelmans et al., 2014; Capizzi & Ferguson, 2005; Dorotic et al., 2011; Ferguson & Hlavinka, 2009).
Since the objective of this research is to uncover the effect of a multi-vendor loyalty programme on customer loyalty, this chapter describes recent literature on loyalty programmes and the effect on customer loyalty. To focus on the particular type of loyalty programme this research is interested in, the chapter further elaborates on literature on partnerships in loyalty programmes and the concept of customer loyalty in order to create a conceptual research model.
2.1 Loyalty programmes and the effect on customer loyalty
Several authors claim that loyalty programmes have positive effects on behavioural, attitudinal, and programme loyalty (Bolton et al., 2000; Kumar & Shah, 2004; Leenheer et al., 2007; Pan, Sheng, & Xie, 2012; Verhoef, 2003; Yi & Jeon, 2003). The effect of loyalty programme on behavioural loyalty is measured with different measures, such as share-of-wallet and purchase frequency (Leenheer et al., 2007; Verhoef, 2003). Loyalty programmes can increase the share of expenditures of a customer in a product category (Leenheer et al., 2007). Focussing on customer usage level, loyalty programmes impact mostly light and moderate buyers, because heavy buyers already buy the brand frequently, which renders it more complicated to increase this already high level (Liu, 2007).
Contrary to these positive findings, other academics argue that the effects of loyalty programmes are overlooked and claim that they have no significant impact on customer loyalty (Dowling & Uncles, 1997; Sharp & Sharp, 1997).
To summarize, academics found different results on the relationship between loyalty programmes and customer loyalty. This is due to the complexity of examining this effect and the industry and market conditions in which the organization operates (Dowling & Uncles, 1997; Leenheer et al., 2007; Rust, Zeithaml, & Lemon, 2001; Verhoef, 2003).
2.2 Partners in loyalty programmes
One of the aspects of the design of a loyalty programme is its organizational structure (Cao et al., 2010). The organizational structure of a loyalty programme refers to the relationship between the host/vendor of the programme, its partner(s), loyalty programme and service provider. Different designs can be found in practise: (a) one organization hosting the programme and making redemption at partners possible; (b) one organization collaborating with partners more intensively and offering members the opportunity to accumulate points at these partners as well; (c) multiple organizations launch a
programme together and all are owners. To classify these different designs Cao et al. (2010) developed a framework along the dimensions of organizational structure and redemption scheme of the loyalty programme, of which the former is the field of interest for this research. They distinguish three types of programmes on the dimension of organizational structure, namely single-sponsor loyalty programme, multi-sponsor loyalty programme and joint loyalty programme. Single-sponsor loyalty programme - also called stand-alone or single-vendor programmes – is the simplest version of a loyalty programme, in which one organization owns and hosts the programme. A multi-sponsor loyalty programme is in essence the same as a single-sponsor loyalty programme with the addition of partners for accumulation and/or redemption of points. Although these partners are involved in the programme, the management and ownership stays with the host. A joint loyalty programme is when two or more organizations create a loyalty programme together and are equally represented in ownership and management of the
programme.
non-partners. Furthermore, multi-sponsor loyalty programmes have the capability to increase purchase intention with partners of the programme in all likelihood (Rese et al., 2013) and partners could take advantage of each others positive brand images (Dorotic et al., 2012). Schumann, Wünderlich, and Evanschitzky (2014) augment the role of the special treatment benefits of coalition loyalty programme and see them as a means to create resilience in case of service failures, for the company as well as for loyalty towards the programme. In term of finance, the feature of multi-vendor loyalty programmes to give the consumer the opportunity to collect and redeem points at multiple organizations, has a positive effect on profitability (Dorotic et al., 2011; Liu & Yang, 2009) and thereby increase profitability further by spillover effects and cross-selling opportunities (Lemon & Wangenheim, 2009; Liu, 2007) . On the debit side of the profit and loss account, partnerships give organizations the opportunity to share costs for the exploitation of the programme (Berman, 2006c).
On the contrary, Rese et al. (2013) concluded that switching barriers, which could be a goal of a loyalty programme, are created in single-vendor loyalty programmes but are not in multi-vendor loyalty programmes. However, this finding should not be taken as decisive to not implement multi-vendor loyalty programmes at all, but the creation of switching barriers should not be the aim of exploiting the programme either. Because this reduction in switching barriers, Rese et al. (2013) advise a multi-vendor loyalty programme as a means to attract members to the programme rather than to increase customer loyalty. Dorotic et al. (2011) focused on promotions in a loyalty programme and the difference in effect between single-vendor loyalty programmes, multi-vendor loyalty programmes, and joint loyalty
programmes. They failed to prove coalition benefits for a multi-vendor loyalty programme. Moreover, the promotion of offers by multiple partners together has revealed to be less effective than by one vendor alone, which can be explained by facilitation of customers with price transparency. This transparency might also lead to switching behaviour between partners, due to programme loyalty (Evanschitzky et al., 2012): members become loyal to the programme rather than to the brand and search for the best purchase option among partners in order to collect points. Another pitfall of a multi-vendor loyalty programme is suggested by Reinartz (2010), warning for the loss of meaning and customer connections when the desired amount of vendors is exceeded. Additionally, as Liu and Yang (2009) mention, members may get confused by the portfolio of loyalty programme partners by the increase of brand images.
As discussed, one of the effects of a multi-vendor loyalty programme is cross-buying, which means that customers shop at different partners in the programme. Experiences at these partners have proven to influence customers’ perceptions of other vendors (Washburn, Till, & Priluck, 2000). In practise this could result in a customer who extrapolates negative experiences at one partner to other partners.
the selection of partners for the loyalty programme an important process while designing the
programme. Not only should the partners fit each other (Dorotic et al., 2011; Lemon & Wangenheim, 2009), also the amount of partners is an important decision as well, since this might have an effect on customer behaviour (Reinartz, 2010).
2.3 Customer loyalty
Coming to the dependent variable of this research – customer loyalty – different academics have done research on the relationship between loyalty programmes and customer loyalty, or brand loyalty, or programme loyalty (Evanschitzky et al., 2012; Sharp & Sharp, 1997; Yi & Jeon, 2003). As described in the previous section, loyalty programmes can be classified according to their organizational structure. However, it remains to be researched what these different types do for customer loyalty. The next section gives a definition of customer loyalty and specifically brand loyalty and programme loyalty are introduced.
In the academic literature customer loyalty is defined as “the relationship between relative attitude and repeat patronage” (Dick & Basu, 1994, pp. -). In line with Ehrenberg (1988), several academics agree that only a fraction of consumers is fully loyal to one brand (Felix & Lindridge, 2014; Yi & Jeon, 2003). Therefore the term ‘polygamous loyalty’ is introduced, to describe that consumers can be loyal to more than one brand. Taking this into account would imply that consumers cannot only be loyal to a brand, but also become loyal to the loyalty programme itself. Therefore, customer loyalty is
distinguished into brand loyalty and programme (Evanschitzky et al., 2012; Yi & Jeon, 2003).
2.3.1 Brand loyalty
As done by different academics, this research divides brand loyalty in attitudinal loyalty and behavioural loyalty (Dick & Basu, 1994; Kumar & Shah, 2004). Attitudinal loyalty refers to the attitude of the consumer towards the brand, also described as the emotional side of the relationship, and is defined as “the consumer’s predisposition towards a brand as a function of psychological processes. This includes attitudinal preference and commitment towards the brand” (Jacoby et al., 1978, pp. -). Behavioural loyalty refers to the actual purchases of a brand; how consumers actually behave concerning purchases. When using these two types of loyalty as dimensions of a table, four types of loyalty can be distinguished: (a) true loyalty; when a customer is highly attitudinal loyal as well as in behaviour which makes this type the most preferred type, (b) latent loyalty; when a customer is highly loyal regarding his attitude but not regarding behaviour, (c) spurious loyalty; when the customer buys the same brand over time, what makes him brand loyal in fact, but it has not to do with being loyal to the brand when for example other brands are out of stock or financial reasons and (d) low loyalty in which the customers acts low in behavioural and attitudinal loyalty (Dick & Basu, 1994).
To become truly brand loyal as a consumer, one has to go through different phases (Oliver, 1999). It starts with the cognitive phase, in which the consumer bases its decisions on prior experience or knowledge, also called “loyalty to information” (Oliver, 1999, p. 36). This phase is followed by the affective phase in which the consumer establishes feelings for the brand. The conative phase is the next phase during which the consumer develops the intention to repeat buying the brand whereas the last phase results in truly loyal consumers, called the action phase. Action loyalty represents the transition of the consumers’ behaviour from having the intention to buy the brand repeatedly into actually buying the brand repeatedly.
2.3.2 Programme loyalty
Although members of a loyalty programme can become loyal towards the brand, they can also become loyal to the programme, the so-called programme loyalty (Evanschitzky et al., 2012; Yi & Jeon, 2003). This would imply that when the programme is owned by another brand, the customer would buy products from this other brand and so value the programme more than the brand; the driver of this high repeated patronage is not the product itself, it is the programme (Yi & Jeon, 2003).
The main driver of programme loyalty is economic value, rather than social benefits and special treatment (Evanschitzky et al., 2012). This means that programme loyalty appeals to members’ trade-off between expected benefits and sacrifices of the programme, whereas brand loyalty examines the
emotional relationship between member and brand.
Yi and Jeon (2003) tested the relationship between value perception of a loyalty program,
relationship between value perception and brand loyalty via programme loyalty in a high involvement situation. However with low involvement, only the direct relationship between value perception and brand loyalty can be uncovered.
2.4 Conceptual model
In short, attracting partners into a loyalty programme is a trend in practise and academics are slowly getting more interested in this topic. Although the relationship between loyalty programmes and customer loyalty is well discussed in academic research, this research will shed a light on the effect of a multi-vendor loyalty programme on customer loyalty. In order to distinguish different types of loyalty programmes, the framework of Cao et al. (2010) is chosen as most appropriate. They distinguish types of loyalty programmes according to their organizational structure and therefore take into account the option of collaboration with partners. This distinction results in three types of which the following two are evaluated based on their effect on customer loyalty: single-vendor loyalty programme and multi-vendor loyalty programme.
As in line with academics, this research approaches customer loyalty as consisting of the constructs of brand loyalty and programme loyalty (Yi & Jeon, 2003). Taking brand loyalty as a multidimensional construct, brand loyalty is divided into attitudinal- and behavioural loyalty, whereas attitudinal
behaviour refers to the emotional side of the relationship and behavioural loyalty refers to actual purchase behaviour.
Combining these decisions on concepts with the central research question, results into the following conceptual framework, visualized in Figure 1.
Now the research question is set and the conceptual model is described, the next chapter describes how and according to which methodology an answer is given to the research question.
Multi-vendor loyalty programme
Customer loyalty
Brand loyalty
• Attitudinal loyalty
• Behavioural loyalty
•
Programme loyalty
3. Research methodology
This chapter presents the research methodology on how this research gives an answer to the research question. This gives meaning to the results and makes the research replicable. The first
paragraphs focus on the research strategy and design in general followed by the operationalization of the variables under research. The following paragraphs will outline the research site, research instrument, and a sample description. The last paragraph discusses data analysis and describes how conclusions are drawn from this dataset. To describe the research methodology, the action plan for quantitative research by Bryman (2012) functions as the framework.
3.1 Research strategy and design
Due to the lack of current knowledge of how multi-vendor loyalty programmes affect customer loyalty, this research is explorative in nature. This purpose of research often appears in research on new topics (Babbie, 2015).
Quantitative research is chosen as research strategy in order to make general statements to provide other academics with starting propositions, rather than finding the rationale behind the relationship under research. Because quantitative research entails investigation on numerical data, it allows for more adequate description on the relationship (Bryman, 2012). Quantitative research starts with describing academic theory, as done in chapter two. Although explorative research is characterized with deriving hypotheses from theory, this is only done by a minority of researchers, because of their experimental settings (Bryman, 2012). Due to the explorative nature of this research, no hypotheses are derived from theory.
The next step involves decisions regarding research design. This research is guided by a comparative design. Comparative design is based on cross-sectional design with the addition of measurement of two or more situations instead of one (Bryman, 2012). So two or more situations are measured, on two or more cases at one point in time. This enhances our knowledge on the topic of interest, because it creates a reference framework for the obtained results.
more than ten years and therefore assumed to be stable. Thereby, reliability is enhanced by a pilot test of the research instrument among 10 people, to prevent from ambiguities and errors.
Regarding replication, meaning the ability of replicating the research and asks for detailed description of the research procedures (Bryman, 2012). For this matter, this chapter describes the research methodology in detail.
Concerning validity, which is about uprightness of the conclusions drawn from the research, and can be distinguished into measurement validity, internal validity, external validity and ecological validity (Bryman, 2012). Measurement validity is about the degree to which the measures measure the concept well and is assured by the reliability of the research method of this research and the pilot study, as discussed in the penultimate section. Internal validity refers to whether the uncovered relationship is real and no other variables are causing or intervening the relationship (Bryman, 2012). This research controls for several other potential causing or intervening variables, which will be discussed in more detail in the next paragraph. Another form of validity is external validity and questions the
generalizability of the research results. One major threat to external validity is the lack of random assignment. Because the vision of the applied research design is retrospective and so the event or treatment already happened, the two samples are formed non-randomly. Rather than a weakness, this is been seen as strength of this research; respondents have already experienced the treatment and therefore are able to recall the experience of the purchase at the loyalty programme better than by simulating the acquisition process in an experiment with inexperienced subjects. This argument also advocates for strong ecological validity, which refers to the applicability of the findings in daily life (Bryman, 2012).
To measure the effect of a multi-vendor loyalty programme on customer loyalty after the purchase of a reward, two situations of respondents’ customer loyalty are compared: the level of customer loyalty among loyalty programme members who bought an article of a single-vendor loyalty programme and the level of customer loyalty of loyalty programme members who bought an article of a multi-vendor loyalty programme.
3.2 Operationalization of concepts
scale, often a 5-point or 7-point scale. This technique is used to measure attitudinal, behavioural and programme loyalty, as will be discussed in the next sections.
Chaudhuri and Holbrook (2001) operationalized attitudinal and behavioural loyalty into statements in their research on brand trust, brand affect and brand performance and these have been frequently used in academic literature afterwards. In order to measure behavioural loyalty, the respondents rated
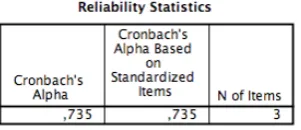
statements regarding their intentions to buy products from the loyalty programme vendor on the short and long term. Attitudinal loyalty was measured by asking the respondents to rate statements regarding their commitment and willingness to pay a higher price, and was supplemented with a statement on word-to-mouth advertisement (Yi & Jeon, 2003). These five statements were judged using a 7-point scale, as in line with the original research, ranging from 1 = very strongly disagree to 7 = very strongly agree (Chaudhuri & Holbrook, 2001). In their researches, these items to measure attitudinal and behavioural loyalty reported a Cronbach alpha of 0.83 and 0.9, respectively. For this study, attitudinal loyalty has a Cronbach alpha coefficient of 0.74 and behavioural loyalty a coefficient of 0.93 meaning that both concepts consisted of acceptable to highly interval consistent reliable items (Pallant, 2010), see table 1 and 2 in appendix I.
Programme loyalty was measured with the multiple-indicator of three statements taken from Yi and Jeon (2003). These statements measure the likeliness, level of preference and willingness for word-to-mouth advertisement for the loyalty programme vendor. These three statements were judged on a 7-point scale, as in line with the original research, ranging from 1 = very strongly disagree to 7 = very strongly agree (Yi & Jeon, 2003). The original research found these items reliable with an average Cronbach alpha of 0.86 and 0.88. For this research, these items register a high Cronbach alpha, namely 0.92 and therefore has good internal consistency, see table 3.
Overall, taken all the three operationalizations of customer loyalty together, the customer loyalty scale reports a Cronbach Alpha of 0.88, indicating a good internal consistancy, see table 4.
3.3 Research site
The data is gathered from a sample of a loyalty programme in Europe of a global commercial organization. Because of confidentially reasons no further information on the research site and sample is published.
3.4 Research instrument
self-completion surveys, the respondents themselves fill in the survey instead of the researcher. This makes the data collection process cheaper and quicker, interviewer effects are absent, questions are asked consistent and it offers convenience to the respondents (Bryman, 2012). On the contrary, the researcher does not know its respondents, leading for example to undesired situations in which other persons than the designated respondent fills in the survey. Moreover, the respondent cannot ask for help when questions arise. The aforementioned pilot study has assumed to minimize this problem. Another problem is the risk of losing respondents because they lose interest in the survey. To minimize this threat, the survey is minimized in length, the expected time to complete the survey is mentioned in the introduction of the survey and an active graph indicated the amount of remaining questions.
The survey is distributed by the programmes’ fortnightly newsletter and therefore also branded with their logo and written in their type of language. Members who received this newsletter were asked to help the brand by filling out a survey, which was hosted by Survey Monkey.
Because the aim of the survey is to measure customer loyalty for the two types of loyalty programmes, two different surveys were available: one for those who bought a reward at a single-vendor loyalty programme and one for those who bought a reward at a multi-single-vendor loyalty programme. The difference between these two surveys was the introduction of the brand or the partner and the associated images of the purchase process, as to be discussed later.
To make stronger statements about the relationship under research, also several test variables are taken into account (Babbie, 2015). A test variable is a variable that allows the researcher to test whether other variables have influence on the relationship between the independent and dependent variable, by keeping this variable constant. The test variables are stemming from academic literature, as discussed in chapter two, as well as from researchers’ thoughts. The fist test variable is “satisfaction with purchase process”, and incorporates the respondents’ experience with the purchase process at the loyalty programme’s host, or at the partner. The second and third variable, measure how much the respondent valued the collaboration between the vendor and the partner and their opinion about the logic of this collaboration. The first three test variables are investigated with a question with a 7-point scale and are introduced after the programme loyalty statements and the last two test variables in the section for personal questions.
The survey can be distinguished into four phases. The first phase was to assign the respondent to the survey to the single-vendor loyalty programme, to the multi-vendor loyalty programme or to eliminated the respondent from the survey, because they are not of value for this research. The second phase visualized the purchase process, which respondents already experienced for real during their own purchase, with pictures to recall the purchase experience. The next phase in the survey was the
contained questions regarding the respondent’s personal characteristics and situation and, time of being member of the loyalty programme en time of last acquisition. It was decided to ask personal questions at the end, because these questions might be seen as irrelevant and give respondents the incentive to leave the survey before completion (Bryman, 2012). In the last phase respondents were to thank for their time and energy and leave room for reactions on the loyalty programme and this survey. The survey structure and questions in Dutch as well as in English language for members of a single-vendor loyalty
programme and multi-vendor loyalty programme can be found in appendix II.
3.5 Data analyses
The data gathered by the survey is transformed from Survey Monkey into a SPSS database. The concepts behavioural, attitudinal and programme loyalty have been measure by the Likert scale, which includes several statements judged on a 7-point scale. During data analysis the results of these multiple-item measures were reproduced toward the concept by their mean score and seen as interval variables, as in line with Bryman and Cramer (2011). However, single-item measures should be and treated as ordinal.
Outliers are extreme scores in the dataset. During the data analysis two outliers were found on the dependent variable customer loyalty. A researcher has several options to process outliers, if these are not found to be an error: one can ignore them, change in a less extreme value or keep them (Pallant, 2010). This research left out these two outliers, because they significantly influenced the results and the respondents were extremely negative about the programme. This conclusion is drawn from the reactions the respondents gave at the end of the survey by comments like “stop the programme” and “organize the supplies better”.
The goal of the parametric independent-samples t-test is to compare two groups on the mean score of a continuous variable (Pallant, 2010). After the test was run, the effect size of the test is calculated and evaluated according to criteria of Cohen (1988).
Because not all variables could meet the requirements of the parametric tests, also non-parametric tests were run. A Mann-Whitney U test tests the difference in a continuous dependent variable for two independent groups (Pallant, 2010). The last aspect of this test is the calculation of the effect size, evaluated according to Cohen (1988) and reflects the practical significance of the difference.
To test correlation between two variables which not can meet the assumptions of the parametric test, the non-parametric Spearman’s rho test assessed correlation (Pallant, 2010). This test calculates the direction and the strength of the correlation. The strength of the relationship equals the effect size for this test.
The parametric test, a two-way between-groups ANOVA is able to test the effect of two categorical independent variables on a continuous dependent variable and is also able to test the interaction effect (Pallant, 2010). The effect size for this test is calculated as the partial eta squared and conclusions are derived from Cohen’s criteria (Cohen, 1988; Pallant, 2010).
The last type of test run during data analyses is the non-parametric chi-square test for
4. Results
This chapter discusses the results stemming from the surveys in order to draw conclusions about the effect of a multi-vendor loyalty programme on customer loyalty. The output of SPSS tests can be found in appendix IV. But first, this chapter starts with a description of the respondents of the survey.
4.1 Sample description
In total, 1,027 respondents completed the survey. Of these, only 141 respondents belong to the target group of this research and are therefore useful for analyses.
Of these 141 respondents, 110 bought a reward in the single-vendor loyalty programme and 31 bought a reward in the multi-vendor loyalty programme. The next two subparagraphs summarize these two samples. More detailed information of both samples can be found in appendix III.
4.1.1 Single-vendor loyalty programme
For the sample on single-vendor loyalty programme members, 17.3% of the respondents did not fill in the personal questions. Of the remaining 91 respondents, 14.5% is male and 68.2% is female.
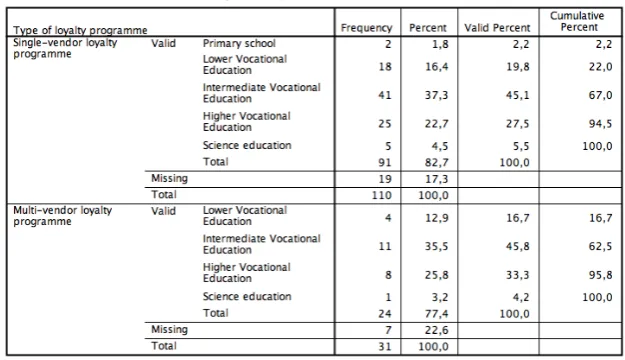
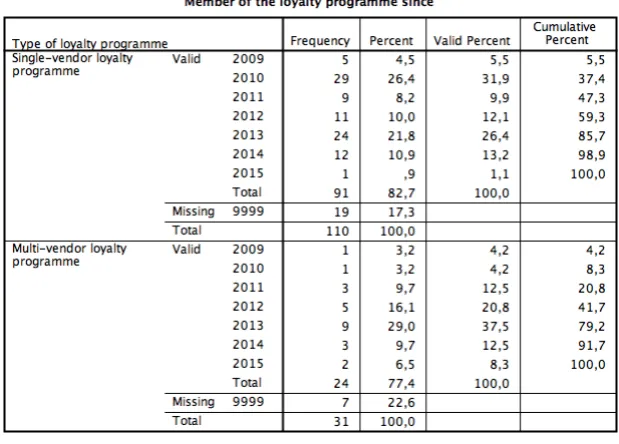
Regarding age, the major groups of respondents are between 45 and 55 years and 55 and 65 years old, whereas the mean can be found in the 45 < 55 years category. Concerning highest completed level of education, intermediate vocational education represents the largest category with 37.3%, followed by higher vocational education with 22.7%. The majority of the respondents (22.7%) have a personal yearly gross income of less than €10,000, followed €20,000 and less than €30,000 (21.8%). The average personal yearly gross income can be found in the category of €10,000 and less than €20,000. Most of the respondents are member of the loyalty programme since 2010 with 26.4%, followed by those who are member since 2013, with 21.8%. Most of the respondents’ last purchase was 2 till 6 months ago, representing 20.9% of the sample.
4.1.2 Multi-vendor loyalty programme
followed by 2012 (16.1%). Most of the respondents’ last purchase was less than 2 months ago, representing 45.2% of the sample.
4.1.3 Customer loyalty
Respondents from both samples show a variety of level of customer loyalty, ranging from 1.33 to 7.00, with a mean of 4.81.
4.2 Effect of type of loyalty programme on customer loyalty
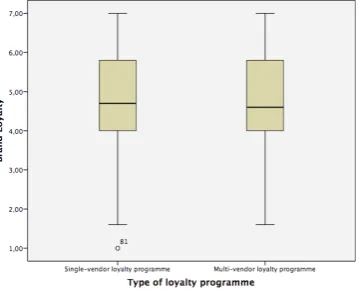
To compare the results on customer loyalty for respondents of a single-vendor loyalty programme and respondents of a multi-vendor loyalty programme, an independent-samples t-test was run. The assumption of normal distribution on the scores of the dependent variable is checked by a visual indication of the Normal Q-Q Plot and is found to be normally distributed, see figure 2 and 3. Thereby, no outliers are found by a visual indication of the boxplots, see figure 4 and 5. The assumption of homogeneity of variances was violated, as assessed by Levene's test for equality of variances (p = .035). Therefore, the unequal variance t-test was performed and no significant differences in mean scores for customer loyalty for a single-vendor loyalty programme (M = 4.79, SD = 1.10) and multi-vendor loyalty programme (M = 4.89, SD = 1.46; t (40.2) = -0.345, p = 0.732, two-tailed) is found, although the mean for a multi-vendor loyalty programme lays slightly higher. The magnitude of the differences in the means (mean difference = -0.10, 95% CI: -0.67 to 0.47) was very small (eta squared = 0.0008); meaning that only 0.08% of this variance in customer loyalty can be explained by type of loyalty programme.
The next paragraphs take a more detailed look into this relationship on the bricks of customer loyalty: brand loyalty and programme loyalty.
4.2.1 Effect of type of loyalty programme on brand loyalty
To test for the effect of type of loyalty programme on brand loyalty, an independent-samples t-test was run. Concerning the assumptions for this test, the results on the dependent variable are normally distributed, as visually indicated from the Normal Q-Q Plot, see figure 6 and 7. From the boxplot is concluded that one outlier is present, see figure 8. It is decided to keep this outlier into the analysis, because it has no decisive impact on the outcome. The assumption of homogeneity of variances has not been violated, as assessed by Levene’s test for equality of variances (p = 0.266). The independent samples t-test shows no significant difference in brand loyalty mean scores between respondents of a single-vendor loyalty programme (M = 4.82, SD = 1.26) and respondents of a multi-vendor loyalty programme (M = 4.77, SD = 1.51; t (139) = 0.171, p = 0.865, two-tailed). The magnitude of the
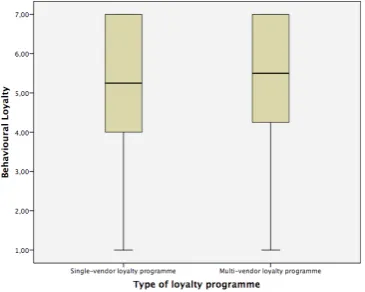
Because brand loyalty consists of the constructs of behavioural loyalty and attitudinal loyalty, also at this level an independent-samples t-test was performed. Concerning behavioural loyalty, data is normally distributed, checked by a visual indication of the Normal Q-Q Plot, see figure 9 and 10. From a visual indication of the boxplot, no outliers are found, see figure 11. Also the assumption of
homogeneity of variances is not violated, as assessed by Levene’s test for equality of variances (p = 0.192). The independent-samples t-test does not detect significant differences between scores of
behvarioural loyalty from respondents of a single-vendor loyalty programme (M = 5.28, SD = 1.46) and those of a multi-vendor loyalty programme (M = 5.06, SD = 1.84; t (139) = 0.690, p = 0.491). Only 0.34% of the variance in behaviour loyalty is explainable by the type of loyalty programme and therefore the magnitude of the differences in means is very small (eta squared = 0.003).
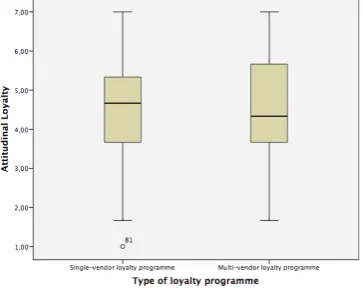
Also for attitudinal loyalty, no significant differences can be found on the means of customer loyalty between a single-vendor loyalty programme (M = 4.51, SD = 1.25) and a multi-vendor loyalty programme (M = 4.58, SD = 1.49; t (139) = -0.259, p = 0.796). The magnitude of the differences in the means are also found to be very small (eta squared = 0.0005), implying that only 0.05% of the variance in attitudinal loyalty can be explained by the type of loyalty programme.
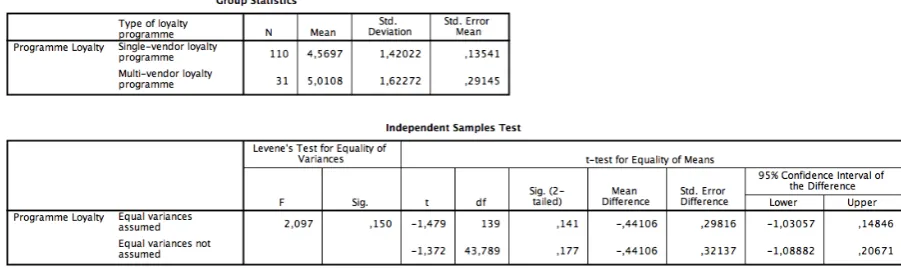
4.2.2 Effect of type of loyalty programme on programme loyalty
To test the effect of loyalty programme type on programme loyalty an independent-samples t-test was run. The assumption on normal distribution of the data on the dependent variable is checked by a visual indication of the Normal Q-Q Plots, see figure 15 and 16. Also no outliers are found in the boxplot on programme loyalty on both samples, see figure 17. The assumption of variances is met, as assessed by Levene’s test for equality of variances (p = 0.150). The t-test for independent samples then found no differences between respondents of a single-vendor loyalty programme (M = 4.57, SD = 1.42) and those of a multi-vendor loyalty programme (M=5.01, SD = 1.62; t (139) = -1.479, p = 0.141, two-tailed). The magnitude of these differences in the means (mean difference = -0.44, 95% CI: -1.03 to 0.15) was very small (eta squared = 0.015), meaning that only 1.55% of the variance in programme loyalty can be explained by the type of loyalty programme.
4.3 The relationship between satisfaction with the purchase process and customer loyalty
This paragraph assesses the influence of satisfaction with the purchase process at the vendor or at the partner on customer loyalty for a single-vendor loyalty programme and a multi-vendor loyalty programme.
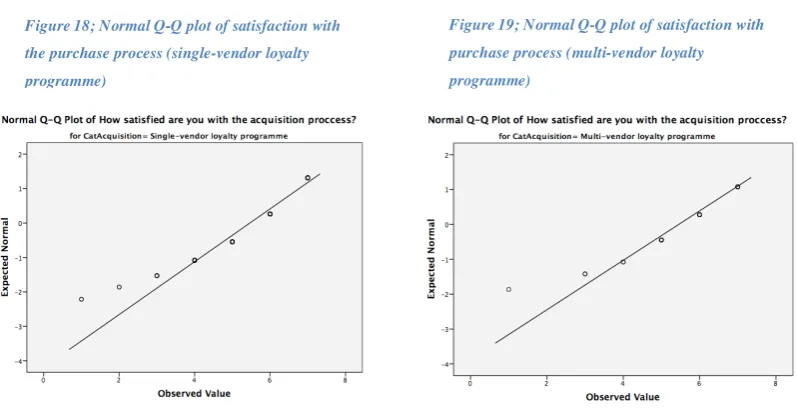
The execution of a Mann-Whitney U test was run to reveal the differences in satisfaction with the purchase process between single-vendor and multi-vendor loyalty programmes. The scores on
with a visual inspection of the Normal Q-Q Plot, see figure 18 and 19. The test did not find significant differences in satisfaction with the purchase process between respondents from a single-vendor loyalty programme (Md = 6.0, n = 110) and a multi-vendor loyalty programme (Md = 6.0, n = 31, U = 1,696.0, z = -0.47, p = 0.963), with a small effect size (r = -0.04).
Correlation between the level of members’ satisfaction with the purchase process and customer loyalty was assessed by Spearman’s rho test and results of a single-vendor loyalty programme and a multi-vendor loyalty programme both show positive correlation between the two variables; for a single-vendor loyalty programme there is a moderate positive correlation between satisfaction with the purchase process and customer loyalty, rs = 0.452, p < 0.0005 whereas this relationship is strong for
respondents from a multi-vendor loyalty programme rs = 0.698, p < 0.0005. Comparing the strength of
the correlations between both samples, no statistical difference can be found, Zobs = -1.80, meaning that
the level of satisfaction with the purchase process explains the variance in positive effect for both samples equally.
4.4 Correlation between level of appreciation of collaboration and customer loyalty
The correlation between the level of how respondents’ appreciate the collaboration between the vendor and the partner and customer loyalty is assessed with a Spearman Rho’s test on the level of customer loyalty, and also on programme loyalty, because it might be suspected that this variable is more correlated with programme loyalty than with customer loyalty. For a multi-vendor loyalty
programme, a strong positive correlation is found between the level of appreciation of the collaboration between the vendor and its partners and customer loyalty, rs = 0.597, p = 0.0004, with high rating levels
associated with high levels of customer loyalty.
On the level of programme loyalty, a strong, positive correlation is found between the two variables, rs = 0.658, p = 0.00006, with high rating levels associated with high levels of programme
loyalty.
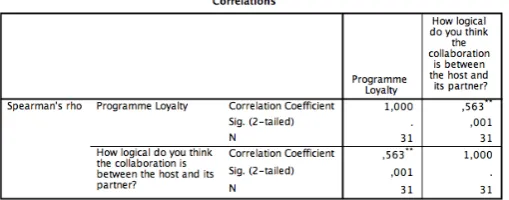
4.5 Correlation of the logic of selected partner and customer loyalty
The correlation between how respondents consider the logic of the two collaborating vendors and customer loyalty is assessed with a Spearman Rho’s test on the level of customer loyalty, and also on programme loyalty. On the level of customer loyalty, Spearman’s rho reveals a strong, positive correlation between the two variables, rs= 0.511, p = 0.003, with high levels of logic associated with
high levels of customer loyalty.
On the level of programme loyalty, a strong, positive correlation is found rs= 0.563, p = 0.001, with
4.6 Length of membership
An independent-samples t-test assessed the difference in mean scores on length of membership, to make inferences about possible covariate variables. The assumption of normal distribution of the scores is met; assessed by a visual indication of the Q-Q plots in figure 20 and 21. Several outliers are found, see boxplots in figure 22. It is decided to keep de outliers into the analysis, because it has no
implications for conclusions derived from the test. The assumption of homogeneity of variance is violated, as assesses by the Levene’s test, therefore the scores are compensated by SPSS and an alternative t-value is given. There is a significant difference in scores in length of membership between respondents from a single-vendor loyalty programme (M = 3.34, SD = 1.63) and a multi-vendor loyalty programme (M = 2.46, SD = 1.44; t = (40) 2.588, p = 0.013, two-tailed). The magnitude of the
difference in the means (mean difference = 0.88, 95% CI: 0.19 to 1.57) was moderately (eta squared = 0.06).
With the finding that respondents of both types of loyalty programmes significantly differ on the length of membership with the loyalty programme, the two-way between-groups ANOVA was
performed to test whether an interaction effect exists between type of loyalty programme and the length of membership on customer loyalty. Participants were divided into three groups according to their length of loyalty programme membership (group 1: 0 till 2 years, group 2: 3 till 4 years and group 3: 5 till 6 years). Regarding the check of the assumptions for this test, one outlier has been found, as being more than 1.5 box-length from the edge of the boxplot and less than 3.0. For this outlier, it has been decided to keep in het dataset. Also the assumption of homogeneity of variances was violated, as assessed by Levene's test for equality of variances, p = 0.030 and therefore the results from the ANOVA test are evaluated on a higher level of significance, namely on a 0.03 level (Pallant, 2010). Data is normally distrusted as assessed by Shapiro Wilk’s test (p > 0.05). The interaction effect is not found to be statistically significant, F (2, 109) = 3.263, p = 0.042. There was a statistical significant main effect for length of membership, F (2, 109) = 3.718, p = 0.027, with a moderate effect size (partial eta squared = 0.064). Using Tukey HSD test to make post-hoc comparisons indicated that the mean scores for members with a short (M = 4.90, SD = 1.23), middle (M = 4.46, SD = 1.18) and long (M = 4.85, SD = 1.13) membership duration were not significantly different. The main effect for type of loyalty programme, F (1, 109) = 2.267, p = 0.135, was not statistically significant.
4.7 Organization hold responsible for reward, from a customer’s perspective
To analyse whether respondents of a single-vendor loyalty programme differ on which organization they hold is responsible for their obtained reward compared to those of a multi-vendor loyalty
type of loyalty programme and respondents who think the loyalty programme’s host is responsible for their obtained reward, χ2 (1, n = 141) = 0.091, p = 0.763 with a small effect size (phi = -0.043).
Regarding respondents who did not know which organization they hold responsible for their obtained reward, the test indicated significant associations with the type of loyalty programme, χ2 (1, n = 141) =
4.239, p = 0.04, with a small to medium effect size (phi = 0.193). Also, the type of loyalty programme and whether respondents hold another organization than the loyalty programme’s host or the partner responsible for their obtained reward are significantly associated, χ2 (1, n = 141) = 6.289, p = 0.012,
5. Conclusion & discussion
In chapter four the results from the data analyses have been presented. This chapter discusses the conclusions stemming from the results and elaborates upon them in more detail together with present academic literature from chapter two. Besides discussing the strengths and contributions of this research from a theoretical and practical point of view, it also presents limitations of the research and guidelines for future research.
5.1 Conclusions & discussion
Loyalty programmes are present in large numbers in today’s consumer markets. Loyalty
programmes aim to make customers loyal to the brand by creating a long-lasting relationship between the brand and the customer by rewarding those customers that continue to buy the organization’s products. These programmes can be designed differently regarding its organizational structure, resulting in different types of loyalty programmes: single-vendor loyalty programme, multi-vendor loyalty programme and joint-vendor loyalty programme (Cao et al., 2010). The trend of the rise of the last two types in practise does not grow equally with academic literature on this topic, especially not from the customer loyalty perspective (Breugelmans et al., 2014; Dorotic et al., 2012; Lemon & Wangenheim, 2009; Rese et al., 2013).
This master thesis addressed one of the first contributions to fill this research gap. The comparative design tested the difference in effect of a single-vendor loyalty programme and a multi-vendor loyalty programme on customer loyalty. No statistical differences can be found on customer loyalty between the two types of loyalty programmes; the type of loyalty programme can explain only 0.08% of the
difference in customer loyalty. Also the two constructs of customer loyalty, brand loyalty and
programme loyalty do not show statistical significant differences amongst the two types. This confirms the statement by Rese et al. (2013) that a multi-vendor loyalty programme should not be established when its aim is to increase customer loyalty. Although multi-vendor loyalty programmes are seen as more beneficial for consumers because they offer convenience, improve speed of point collection, and a wider assortment of rewards (Berman, 2006c; Dorotic et al., 2011), consumers could consider these benefits to be appealing to enrol into the programme rather than becoming loyal to the brand (Rese et al., 2013). Another aspect that should be taken into account is that however a multi-vendor loyalty programme has no effect on customer loyalty towards the host of the brand, it has impact on buying behaviour of consumers so that members of a multi-vendor loyalty programme are more likely to buy at partners of the programme than from non-partners (Meyer-Waarden & Benavent, 2006).
online location of reward purchase, at the vendor or partner, did not result in a difference on the level of satisfaction with the purchase process. These results are in line with the theory that experiences at other vendors influence the customer’s perception of the other vendors (Washburn et al., 2000).
Scrutinize respondents’ opinions regarding the selected partner for the multi-vendor loyalty programme, their opinion about to what level they appreciate the collaboration of the vendor and its partner strongly positively correlates with customer loyalty, with high levels of appreciation associated with high levels of customer loyalty. The same applies to correlation between how respondents rate the logic of the chosen partner and the vendor. The more the respondents found the collaboration to be logical, the higher levels of customer loyalty are registered. Although correlation does not imply the existence of a relationship between two variables, other academics already mention the importance of the partnership portfolio of a loyalty programme (Breugelmans et al., 2014).
Considering the length of membership, this time is not found to be interacting with the type of loyalty programme on customer loyalty. Regarding an intervening variable for this framework, respondents from a single-vendor loyalty programme and a multi-vendor loyalty programme do not differ in level of customer loyalty. However, a statistical significant effect is found of the length of membership on the level of customer, but without significant differences between members who are member for a short, moderate and long term. So both samples have had the same time to become loyal to the brand.
The organization that the respondents hold responsible for their obtained reward varied between the two types of loyalty programmes. Though the majority of respondents from both samples agree on that the loyalty programme’s host is responsible for their reward, they vary in the amount that holds another organization than loyalty programme’s host or the partner responsible, and the part that does not know which organization to hold responsible for their obtained reward. Respondents from a single-vendor loyalty programme were more likely to be unaware which organization to hold responsible for their reward than respondents from a multi-vendor loyalty programme. The same applies to respondents that hold another organization than the loyalty programme’s host or the partner responsible for their reward. These outcomes suggest that a single-vendor loyalty programme is less capable of making the customer link credits for the obtained reward towards the brand than a multi-vendor loyalty programme, while there are less actors involved in a single-vendor loyalty programme. This contradicts the findings of Liu and Yang (2009), warning that an increase of brand images within one programme may lead to brand confusion of members. From the members’ perspective, the confusion of which organization is
So overall, a short answer can be given on the research question of this research: what is the effect of a multi-vendor loyalty programme-vendor loyalty programme on customer loyalty? From this
research, among respondents of a loyalty programme in Europe from a worldwide commercial
organization, of which 31 acted like members of a multi-vendor loyalty programme and 110 as members of a single-vendor loyalty programme, no significant effect of a multi-vendor loyalty programme on customer loyalty can be noted.
5.2 Theoretical relevance
The academic literature is still in its infancy in the field of different types of loyalty programmes and its effect on customer loyalty. This research takes one of the first steps in this field to make propositions as bricks for future research. Due to the comparative research design, the findings of respondents from a single-vendor loyalty programme function as a reference framework for the findings on multi-vendor loyalty programme respondents in order to make more salient conclusions. This is especially valuable, because both samples are derived form the same target group. In other words, the respondents all stem from the same loyalty programme, distinguished on the type of loyalty programme by their purchase(s).
This research is one of the first reactions to the call for action from several academics
(Breugelmans et al., 2014; Dorotic et al., 2012; Lemon & Wangenheim, 2009; Rese et al., 2013). With the finding that a multi-vendor loyalty programme is no different on customer loyalty effects than single-vendor loyalty programmes, academics can build further to uncover why these types of loyalty programme result in equal levels of customer loyalty.
More detailed contributions of this research can be found in the test variables. Satisfaction with the purchase process does positively correlate with customer loyalty for both types of loyalty programmes. Another finding is the correlation between logic of the collaboration between vendor and customer loyalty and, partner and the appreciation of this collaboration and customer loyalty.
5.3 Practical relevance
The practical relevance of this research is to give practitioners in the field of loyalty programmes guidelines and advise to what extent they should implement multi-vendor loyalty programmes when their aim is to enhance customer loyalty. Since the level of customer loyalty is not found to be different between members of a single-vendor loyalty programme and a multi-vendor loyalty programme,
In the discussion, partnership portfolio is put forward as an important topic to consider when partners are chosen for collaboration in the programme. Therefore, the advice is to evaluate the partnership portfolio, because the composition of the vendor and the partner has shown to positively correlate with customer loyalty as well as advocated by other academics (Lemon & Wangenheim, 2009; Liu & Yang, 2009; Reinartz, 2010).
Another important process a vendor should monitor while the programme is operating is satisfaction of members with the purchase process of the reward at the partner. The beginning of this chapter already discussed the positive correlation between members’ satisfaction with the purchase process and customer loyalty, and since experiences at partners influence opinions about other organizations in the programme (Washburn et al., 2000), practitioners should not only monitor their own processes but also their partners’.
The last advice for practitioners managing a single-vendor loyalty programme is the branding of the loyalty programme. This research made clear that members of a single-vendor loyalty programme differ from members of a multi-vendor loyalty programme on the knowledge which organization contributed to the members’ obtained reward. Significantly more single-vendor loyalty programme members did not know to which organization credits could be addressed.
5.4 Discussion of limitations and directions for future research
Besides this research’ contributions, this research also has its limitations. These will be discussed in this section, together with the directions for further research to improve knowledge on the field of type of loyalty programmes and their influence on customer loyalty.
One field for improvement is the generalizability this research. An aspect of the level
generalization of a study is the sample size, since a small sample size increases the chance that the sample does not cover the variety of people in the population (Bryman, 2012). Overall 1,027 members of the loyalty programme responded to request to participate in this study, of which 141 belong to the target group of this research. To make generalizations about all consumers, a sample size of 377 is needed, with z = 95%, p = 0.5 and F = 5%. Thereby is this research held among respondents of a specific loyalty programme in Europe and since this is only one loyalty programme and many more exist, it is advisable to this research among different loyalty programmes to enhance external validity. Another issue is that all the respondents come from Europe, so generalizations about populations worldwide cannot be made. Therefore, further research should enlarge the scope.
and leads to results on a higher measurement level and more options for parametric analyses (Callegaro, Manfreda, & Vehovar, 2015).
The combination of the operationalization of the concepts from English literature and the survey among Dutch respondents, requested for translation of the English operationalized variables into Dutch statements. Because English is not the mother tongue of the author of this research, this might cause small errors with the translation of questions and therefore the concepts might be measures slightly different than the original English concepts. However, to compensate, the author tested the survey among 10 respondents to ensure clarity of the questions.
Another limitation of this research is that although multi-vendor loyalty programmes have been distinguished from single-vendor loyalty programmes and joint-vendor loyalty programmes by Cao et al. (2010), still different types exist within these types. For example, at some programmes it is possible to redeem points at the loyalty programmes’ partner but not to collect points via these partners, while in some multi-vendor loyalty programme it is also possible to collect points at these partners. Therefore the author requests for agreement of a typology framework that incorporates all the types of loyalty
Bibliography
American-Airlines. (2011). HISTORY OF AMR CORPORATION AND AMERICAN AIRLINES. 2014
Babbie, E. (2012). The practice of social research: Cengage Learning. Babbie, E. (2015). The practice of social research: Cengage Learning.
Berman, B. (2006a). Developing an Effective Customer Loyalty Program. California Management Review, 49(1), 123-148.
Berman, B. (2006c). Developing an effective customer loyalty program. California Management Review, 49(1), 123.
Berry, J. (2013). The 2013 COLLOQUY Loyalty Census (pp. 1-14). Cincinnati (OH): LoyaltyOne. Blattberg, R. C., Kim, B.-D., & Neslin, S. A. (2008). Why Database Marketing? : Springer.
Bolton, R. N., Kannan, P. K., & Bramlett, M. D. (2000). Implications of loyalty program membership and service experiences for customer retention and value. Journal of the academy of marketing science, 28(1), 95-108.
Breugelmans, E., Bijmolt, T. H., Zhang, J., Basso, L. J., Dorotic, M., Kopalle, P., . . . Wünderlich, N. V. (2014). Advancing research on loyalty programs: a future research agenda. Marketing Letters, 1-13.
Bryman, A. (2012). Social research methods (Fourth edition ed.): Oxford university press.
Bryman, A., & Cramer, D. (2011). Quantitative data analysis with IBM SPSS 17, 18 and 19: a guide for social scientists: Routledge.
Callegaro, M., Manfreda, K. L., & Vehovar, V. (2015). Web survey methodology: SAGE. Cao, Y., Nsakanda, A. L., & Mann, I. J. S. (2010). A Typology Framework of Loyalty Reward
Programs E-business Technology and Strategy (pp. 159-170): Springer.
Capizzi, M. T., & Ferguson, R. (2005). Loyalty trends for the twenty-first century. Journal of Consumer Marketing, 22(2), 72-80.
Chaudhuri, A., & Holbrook, M. B. (2001). The chain of effects from brand trust and brand affect to brand performance: the role of brand loyalty. Journal of marketing, 65(2), 81-93.