estimating the scale and impacts of
migration at the local level
LGA
research
Contents
page
Executive summary 3
Recommendations 7
1 Introduction 9
2 Estimating population dynamics and change 10
3 The nature and scale of international migration 23
4 Developing local measures 29
5 Assessing local impacts 45
Key documents and sources 56
Appendices
1 Supporting tables
1a: Local authorities ranked by BME population, 2001and NINO
registrations to foreign nationals, 2005/06, and WRS, 2005/06 59
1b: Ranking of local authorities by Flag 4 registrations, 2006 and National Insurance Number registrations to foreign nationals as a
percentage of total international migration, 2005/06 68
2 Review of migration impact research
2a Analysis by themes – comments and quotes from local research reports 77
2b Summary of local evidence on impact 106
2c List of authorities which responded to the survey 124
Executive summary
Estimation of population dynamics and change
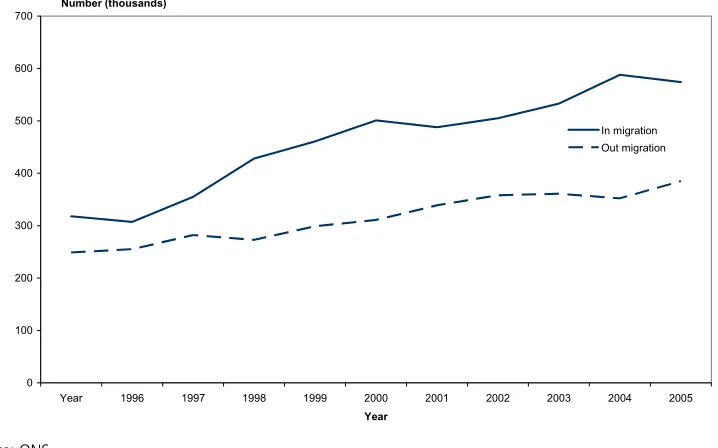
1. International migration is a growing global phenomenon. Long-term migration to the UK (defined as stays of over twelve months) has increased from 320,000 in 1997 to 574,000 in 2006. Out migration has also increased during this period, but more slowly. Since 1998 migration has been the principal component of population change overtaking natural change through births and deaths. Short term migration has almost certainly also increased, although this is currently not measured. Further, the growth of international migration is not a temporary phenomenon. All the indicators are that it will continue alongside and as part of globalisation.
The focus on migration and the demand for better statistics has increased since the accession of 10 countries to the EU in 2004 (A10 or A8 excluding Malta and Cyprus). Long term A8 migration officially increased from 20,000 in 2003/04 to 77,000 in 2004/05 and 74,000 in 2005/06. Total registrations for National Insurance numbers (NINO) from all 12 accession states, which also reflect short term migration, reached nearly 720,000 between 2004/05 and 2006/07. A8 migrants are predominantly from Poland, and are generally young and without dependents. They have attracted attention because of the sudden increase in their numbers, their focus on work and their geographical distribution beyond the traditional areas of international in-migration and diversity.
2. Despite the attention it has received A8 migration comprised only 16 per cent of non-British long term in-migration in 2005/06, according to the official figures; migration from the New Commonwealth made up 26 per cent. Most long-term migration continues to be to traditional reception areas: London boroughs occupied 15 of the top 20 places for the proportion of in migrants to total population in 2006.
3. Migration has many beneficial impacts, particularly in the economic sphere, and these were generally recognised by the local authorities that were contacted in the course of this study. But migration is increasing the population of the UK and, with it, the demands upon local services. Even if the increased local demand is recognised in local population estimates and thence by increased grant from the centre, there is often a lag between the additional grant and the immediate demands upon services. In addition, many areas are experiencing high levels of both in and out international
migration, and internal migration, which may have little effect on net population but significant impact on service provision and administration.
4. We have presented a wealth of material, provided by local authorities, about the scale and nature of impacts on local services. Nevertheless, some of the impacts are only now beginning to be
documented and costed. This gives rise to a number of specific concerns: the adequacy of the
population estimates themselves; the speed and flexibility of funding adjustment, particularly now the grant is set for three years; whether the population projections and financial adjustments reflect the new range of diversity and the challenges that this creates – the current projections used in funding formulae are based on 2004 estimates which predate the recent rise in A8 migration; whether the impact of ‘churn’ is recognised and whether its impact is even more significant than the overall number of people.
5. There is general recognition that official statistics on migration are inadequate and need to be
ultimately on the 2001 Census rather than more recent local data (although the Labour Force Survey (LFS) was used for the first time in 2006 to allocate the IPS to regional level and below this in London). A range of evidence from administrative data (such as NINO and NHS ‘Flag 4’ data) and local studies seriously questions the robustness of the national, and particularly the local, estimates.
6. There is a range of administrative and other data available which relates to migration, including NINO; the Workers Registration Scheme (WRS) for A8 migrants; first health registration of new arrivals – Flag 4; the annual School Census (PLASC); the Higher Education Statistics Agency (HESA) count of
students; Electoral Registers (ER); and the LFS, a sample survey of 60,000 households per quarter. All have limitations, particularly around recording de-registration, but taken together they can offer a fuller picture and pick up, particularly, rapid change and flows of migrants. There is also scope to enhance these sources and make better use of the information they collect.
7. The Office for National Statistics (ONS) established an Inter-departmental Task Force which proposed in Dec 2006 a wide range of recommendations for improved data on migrants entering and leaving the country, and better information on migration within the country. Key to the latter is access to data on individuals to allow linkages to be made for aggregate statistical purposes. Implemented in full the recommendations should go a long way to provide the step change in data that is needed. However, there are questions about timing; funding; action from other agencies over issues such as e-borders; and Parliamentary approval for access to administrative data. Ministers are yet to give their explicit backing to the Task Force proposals.
8 A Leeds University Team has obtained ESRC funding to establish a national New Migrant Databank over two years which would bring together data from six national administrative sources and aim to provide projections by ethnic group for each authority. This is a positive development but more work will be needed at the end of the two years to ensure ‘off the shelf’ projections for all local authorities and although ONS is supporting the project there is no commitment to take it over or continue development. There are also questions about the place of locally generated data in the databank and the treatment of nationality.
9. The growth in migration generally, particularly of migrant workers, has also increased the demand for data on short term migrants, ie those staying less than 12 months. ONS is to produce the first national estimate in October but local figures cannot be estimated accurately from these and will need local data sources, ideally linked to data on individuals.
10. Notwithstanding the concerns about the adequacy of national data, local authorities need to
Impact of migration on public services – overview of 100 responses
11. The detailed impact of migration varies, depending upon the region’s demography, labour market and economy, the stretch already being experienced on services and the previous experience in dealing with diverse communities and cohesion issues.
12. Many areas have undertaken studies to assess the economic benefit of migration and stress that migrants are over-represented in hard to fill occupations and are helping to fuel local economic growth.
13. Information collected from over 100 councils and other public bodies indicates that whilst most report pressures on their services very few have quantified the costs but rather have focussed on dealing with the impacts. Whilst one-off projects and small targeted initiatives are sometimes costed, pressures on mainstream services such as housing, education, information and advice services and measures to promote cohesion are, of necessity in the context of finite budgets, being absorbed by stretching other budgets, and therefore the financial impact is hidden. Most migrants’ service requirements will be best met through developing mainstream services rather than creating separate specialist services.
14. The longer term costs of migration, in which migrants begin to settle permanently, attract dependents and make demands upon the social and physical infrastructure associated with population growth, have rarely been considered although a few authorities were beginning to address such issues. These should be the subject of a further study.
15. The key issues for public services are:
The impact of ‘churn’ in schools – the pressures include translation services, numeracy and literacy of young children, understanding cultural differences, mid-term arrivals, and the lack of records and assessments. The reduction in Ethnic Minority Achievement Grant funding is of further concern.
Child protection – it can be highly complex to investigate the family situation of transient families and ensure effective safeguarding of children, the complexities being exacerbated by language difficulties and cross-cultural issues.In addition, some councils are incurring costs linked to the care of unaccompanied children, be they from countries with unregulated entry to the UK, or linked to asylum seeking.
Language barriers – meeting the basic information needs of migrants, translation and interpretation, supporting complex advice needs and communicating in emergencies are issues faced by all public sector partners. There is insufficient provision of ESOL (English language teaching) to meet the increasing demand, stemming from a shortage of teachers and funding rules (which are about to become tighter).
Housing – in areas experiencing significant economic growth many migrants are living in overcrowded properties in a poor state of repair, sometimes with a high fire risk or other health and safety problems. Demand on social housing has, as yet, been low but the costs of increased housing benefit processing and issues of homelessness and destitution are issues in some areas. The complexities of supply, demand, entitlement and need pose short and longer-term
Community cohesion – this was seen as a high priority by most respondents and there are many examples of good practice across councils and agencies. Many respondents reported tensions and different levels of conflict and had put action plans in place to give information to both migrants and the host communities, engaging with employers and housing providers and developing inter-agency approaches. None were costed.
Community safety – many authorities reported that migrants were more likely to be victims of crime than perpetrators. Vehicle related crime including absent or forged documentation and drink driving is being addressed by information campaigns in some police authorities. Fire and Rescue services are also producing publicity in other languages, particularly regarding risks in HMOs.
Health – the impact is increasing albeit from a low base, particularly in relation to inappropriate use of A&E instead of GPs and increased use of maternity services, often late, making planning difficult. Mental health needs are being identified particularly for asylum seekers and refugees who have experienced trauma.
Recommendations
1. The Inter-departmental Task Force proposals for significantly improving migration statistics should receive the necessary financial and legislative backing and be progressed with greater urgency, with full support from government departments and explicit support from ministers.
2. High levels of migration have increased the need for a mid-term five-year Census and the case for a 2016 Census should be considered.
3. At the same time, better use could be made of NINO, PLASC, Flag4, HESA and Electoral Registration data. A working party of advisors and local authority practitioners should be established to
recommend enhancements which would increase the usefulness of these sources for monitoring; and to consider ways in which they could be incorporated in official population estimates.
4. If timing allows these revised approaches to administrative data should feed into the data collected by the New Migrant Databank (NMD).
5. Government departments should adopt a more open and consistent approach to the availability of administrative data to local authorities at a small area level.
6. Further investigation should be carried out into the practical and political feasibility of introducing population registers which are used widely elsewhere in Europe.
7. Local authorities should continue to develop local knowledge of the makeup, changing nature and needs of their communities: there are many good examples to draw from. Advice will also emerge from the working party referred to above.
8. It is clear that service impacts and costs associated with migration are only beginning to be understood and we would recommend a further study and review of evidence as these develop.
9. Child protection issues are a particular concern. The recommendations of the DfES and GOL London Child Mobility Project (May 2006) should therefore be pursued and its wider implications for migration and child protection examined.
10. There should be some recognition of the short-term impact of high or rapid levels of migration, independent of any net impact on population. One possibility is to include an allowance for migration in grant formulae, which could be likened to the current judgemental allowance for population ‘sparsity’. This could go some way to meet the extra costs experienced by those areas which are consistently the focus of migration. Another approach, which would be more sensitive to short-term changes, would be to allow bidding against a mobility fund where major and rapid shifts in
population could be demonstrated. This could to some extent counterbalance the distorting effects of basing three year grant funding on 2004 estimates of population.
12. The longer term costs of migration arising from permanent settlement and the arrival of dependents have hardly been considered and should be the subject of a further study. They should also be considered by local authorities themselves.
1 Introduction
1.1 The research brief
The Local Government Association (LGA) required a rapid review and analysis of available evidence of the scale of recent population changes and the impact on local services. The purpose of the work was to:
• establish what is known about the scale, nature, distribution and impact of these changes from the significant body of work already available; and
• provide an assessment of what this evidence suggests about how better to measure and monitor population change given common agreement that current methods for extrapolating local from national data are insufficiently sensitive or timely to describe and predict impacts on local public services.
The work was carried out in August and early September 2007. It consisted of a review of published studies, some new analyses of data on population and migration based on the mid-year estimates and a range of recent administrative sources and a survey of all local authorities. Although timescales were short and the survey took place over the summer holiday period, over one hundred written replies were received and these were supplemented by a series of interviews with key personnel.
1.2 A new context
Migration is not new; people have been on the move since time began. But the ease of modern
communications, together with the growing globalisation of trade and business, means the international movement of people is a growing global phenomenon. The UN Population Division estimated the international migrant population in 2005 as 190 million or 2.9 per cent of the total global population.
Migration is often considered in terms of the impacts upon the receiving nations, but it is clearly a two way process. Around 10 per cent of British born people now live outside the UK, with 600,000 living permanently in Spain alone and over 3 million have second homes in other countries. Britain received 32 million tourists in 2006 but was responsible for nearly 70 million trips to other countries.
Migration also brings huge benefits to the UK, with some estimates suggesting that 3 per cent of GDP is attributable to new migrants and total revenue from migrants growing in real terms from £33.8bn in 1999/00 to £41.2bn in 2003/04 according to the Borders and Immigration Agency, and this before the impact of migration from the EU accession states after 2004 is taken into account. Many industries, such as horticulture and residential and care facilities for the elderly, would simply not be able to operate without migrant labour with a consequent impact on many other jobs. Migrants also return a significant proportion of their earnings, in the form of ‘remittances’, to their country of origin, providing the largest source of overseas aid.
However, our governmental and administrative processes have not kept pace with the change. Our data sources are inadequate at both the national and local level to measure population change and we are unable to plan for or respond to increased demands for public services and to anticipate trends and developments. Further, whilst the economic gains at the national level are significant, the mechanisms to identify needs and allocate resources to the local level are clearly insufficient, perhaps leading to
2 Estimating population dynamics and change
Summary
With the growing importance of international migration the inadequacies of existing methods of
estimating migration have gained much attention. There is general recognition that statistics on migration are inadequate and need to be improved, particularly at local level.
• The International Passenger Survey (IPS) is the principal source of data for movement in and out of the country but the sample is very small: 2,965 ‘in’ and 781 ‘out’ in 2005. Local allocation within official statistics depends ultimately on the 2001 Census rather than more recent local data (although the Labour Force Survey (LFS) was used for the first time in 2006 to allocate the IPS to regional level and below this in London). A range of evidence from administrative data and local studies seriously questions the robustness of the national, and particularly the local, estimates. For example, NINO registrations from A8 migrants are very much higher than the official migration figures and it is difficult to see that this is entirely attributable to short term migrants.
• There is a range of administrative and other data available which relates to migration including National Insurance Numbers (NINO); the Workers Registration Scheme (WRS) for A8 migrants; first health registration of new arrivals – Flag4; the annual School Census (PLASC); the Higher Education Statistics Agency (HESA) count of students; Electoral Registers (ER); and the LFS, a sample survey of 60,000 households per quarter. All have limitations, particularly around recording de-registration and hence out-migration, but taken together they can offer a fuller picture and pick up, particularly, rapid change and flows of migrants. There is also scope to enhance these sources and make better use of the information they collect.
• The ONS established the Improving Migration and Population Statistics (IMPS) project that has led to a number of marginal changes. ONS also established an Inter-departmental Task Force. This reported in Dec 2006 with a wide range of recommendations covering improved data on migrants entering and leaving the country – including improvements to the IPS – and better information on migrants in the country. Key to the latter is access to data on individuals to allow linkages to be made for aggregate statistical purposes. The Department for Work and Pensions (DWP) databank which covers around 95 per cent of the population is potentially a very rich source. Implemented in full the recommendations should go a long way to provide the step change in data that is needed. However, there are questions about timing – the report had at least a seven year timescale; funding – the total cost of
implementation, estimated at £50m, is beyond the ONS’ resources and would require support from elsewhere; action from other agencies over issues such as e-borders; and Parliamentary approval for access to data. Ministers are yet to give their explicit backing to the Task Force proposals.
• Migration is increasing the population of the UK. In addition, many areas are experiencing high levels of both in and out international migration, and internal migration, which may have little effect on net population but significant impact on service provision and administration. The ONS is shortly to produce the first estimates of this ‘churn’ in population.
• Some other European countries use a compulsory residential register to record moves by individuals which potentially remove the need for periodic censuses.
2.1 Problems in estimating international migration
With the growing importance of international migration the inadequacies of existing methods of
estimating migration have gained much attention. Mervyn King, the Governor of the Bank of England, has been widely quoted as saying “that we do not have the ability to measure accurately at present, the size of the population”. David Rhind, the Chairman of the Statistics Commission has stated that “there is no dispute – current data is inadequate for many key government purposes”. The Audit Commission has also added its voice to this chorus claiming that “current local population projections and diversity data do not fully reflect the recent increases in migration”.
ONS has acknowledged these concerns and accepted that “there is now a broad recognition that available estimates of migrant numbers are inadequate to meet all the purposes for which they are now required. They are the weakest component in population estimates and projections in the United Kingdom, both nationally and at a local level.” (Karen Dunnell, Report of the Inter-departmental Task Force on Migration Statistics). In order to address these weaknesses ONS set up the Improving Migration and Population Statistics (IMPS) project and an Inter-departmental Task Force on Migration Statistics (ITFMS).
In essence, the problems are the lack of a single, all-inclusive system to measure the movement of people into and out of the UK as a whole and the lack of a system to allocate these migrants to the localities where they reside; local estimates are arrived at by allocating the national figure by using survey and past census data, not by taking measurements locally.
The estimates for migration are based on a number of data sets. At the heart of this process is the
International Passenger Survey (IPS). This is a voluntary face-to-face sample survey of passengers arriving at or departing from UK ports. It is a major survey, over a quarter of a million people are interviewed per year, and in the absence of any alternative, clearly a very valuable source of information about international migration (though it is interesting to note that it was originally established to give
information about international tourism and expenditure by visitors to the UK). However, there are serious doubts about the reliance on the IPS as the primary source of data for both the total figure and local estimates. These doubts are based on both the methodology of the IPS and evidence of disparities between the IPS and other data.
• Although the survey covers large numbers, it is only a very small sample of all international
• The survey relies on a question about intention to stay in the UK which clearly relies on the honesty and certainty of the respondent. Only those staying over 12 months are counted as long term migrants in accordance with international definitions.
• Because not all ports of entry and timings are covered (ONS estimate 90 per cent) there is some concern that some migrants, such as those from A8 states, who are said to favour certain routes, may be underestimated.
ONS has acknowledged the particular weakness of the sampling of out migration and since January 2007 ‘emigration filter shifts’ have been used to boost this figure. A report is also expected in October 2007 which will consider the scope for optimising the IPS samples by, for example, including smaller airports. To arrive at the figure for Total International Migration (TIM) the ONS add to the IPS estimates for - Irish flows
- Asylum seekers
- ‘Visitor and migrant switchers’ ie those who end up staying for more or less than 12 months contrary to their original stated intention.
2.2 The conversion of national estimates to local areas
The estimation of international migration becomes more problematical, and perhaps inevitably, more controversial, at the local level. The IPS sample is simply too small to allow direct estimation of migrants at local authority level. A formula is therefore applied to allocate the TIM across countries, regions, sub regions and local authorities.
The IPS includes a question on intended destination. Inevitably the answers tend to be biased towards the main, and best known, urban centres. Until 2007, this was used as the basis for allocating international migration down to a sub regional level and then distribution to local authorities was based on previous levels of migration as measured by the 2001 Census. This meant that the allocation was not based on any local measure other than the Census and was therefore insensitive to relatively rapid local changes in migration.
In the face of these criticisms – and as an output of the ongoing IMPS project – the ONS made some changes to its methodology for distributing international in migrants for the recently produced 2006 estimates (August 2007). In particular, it used the Labour Force Survey, which includes questions on migration (address one year ago and year of arrival in the UK) in combination with the IPS. Use of the LFS avoids the ‘node’ effect of the IPS mentioned above. However, because of the small sample size, 60,000 nationally, this could only be used down to the level of the English regions, except for London where the sample of immigrants is sufficient. The 2001 Census is still used for distribution, within the overall totals, at sub regional and local authority level, and again this means that rapid local change in new migrant destinations are not captured. In summary the changes were:
• changing the distribution of IPS international in migrants to the constituent countries of the UK and the regions on the basis of the LFS;
• using the LFS to allocate in migration to a new sub regional geography in London;
• estimating out migration at the sub regional level using the IPS. Using a propensity to migrate model to produce estimates of out migration at the local authority level.
There is a range of evidence which, while not conclusive, raises serious questions about the accuracy of international migration estimates:
• there were large differences between the 2001 Census and population estimates based on the 1991 Census;
[image:13.595.72.397.505.648.2]• there are very large differences at a national level between the numbers of National Insurance registrations of foreign nationals and the estimates of in migration. The Data Management and Analysis Group (DMAG) of the Greater London Authority (GLA) has done an analysis of National Insurance registrations for EU accession states which shows that these have far outstripped the figure for migration inflow drawn from the IPS even though not all A8 migrants would register to work. Table 1 compares National Insurance Number (NINO) registration from all 12 EU accession countries with the official A8 inflows (the vast majority of A12 in-migrants come from the A8 states). Whether year of arrival or registration is taken the NINO in flows far outweigh the migration estimates. In 2004/05 arrivals exceeded the estimate of migration in flow by 120,000 and in 2005/06 this had risen to 188,000. In the three years 2004/05 to 2006/07 there were nearly 720,000 NINO registrations from A12 nationals. The official migration figures cover only those who intend to stay for over one year. DMAG suggest that much of the difference between the official migration figures and the NINO figures may be accounted for by short-term registrants, staying less than 12 months. However, firstly it is difficult to accept that this can account for the whole of the difference, in which case the official figures are significantly underestimating total in migration. Secondly, the sheer scale of short term migration, which has an important impact on service providers, is not being captured. The presence of so many short-term migrants is an issue which is discussed later.
Table 1: A12 NINO registrations and A8 migration 2000/01 to 2006/07: United Kingdom: thousands
NINO year of arrival
NINO year of registration
Migration in flow (A8 only)
2000/01 15 - -
2001/02 20 - -
2002/03 29 18 -
2003/04 52 29 20
2004/05 198 119 78
2005/06 262* 277 74
2006/07 - 321 -
*incomplete
Source: DMAG: Update 14-2007: August 2007: updated from ONS
up to 6,000. These underestimates partly reflect international migration but also the inadequacy of systems to measure internal migration.
• Other authorities have drawn on a range of administrative data sources (described in 2.4) to question ONS estimates. Newham carried out an exercise to compare mid year estimate international inflow figures with ‘Flag 4’ GP registrations by London borough over four years. (When a new patient, whose previous address was abroad, registers with a GP, then a ‘flag’ is recorded on that registration. This includes those of British nationality returning from abroad). While the London totals per year were broadly comparable the distribution across boroughs varied considerably. For example, while Kensington and Chelsea had three to four times the number of migrants to Flag 4 registrations, Newham had two thirds to one half. Newham also did a comparison of resident pupil data with the population estimates. This showed that there were 750 more resident pupils in the borough than children of that age in the borough according to the ONS mid year estimates for 2005. Stoke-on-Trent cross-referenced Child Benefit claimants with education data in order to show that ONS mid year estimates were 2-3 per cent below actual numbers in the 5-10 age group.
2.3 Estimating population ‘churn’
Table 2: Areas with the highest volume of internal and international migration per 1,000 population
Mid-2001 to mid-2006
Internal migration International migration Volume of migration per 1,000 population 1
Area In Out In Out All
migration
International migration 1 Cambridge 54,100 57,900 28,500 18,200 278 82 2 City of London 3,900 3,600 1,500 1,500 276 78 3 Westminster 88,700 95,200 65,700 37,700 259 93 4 Oxford 66,000 70,800 31,900 17,000 258 68 5 Wandsworth 123,400 142,300 40,800 27,300 243 50 6 Camden 86,200 96,900 53,400 25,800 243 73 7 Hammersmith &
Fulham
66,900 83,200 33,200 22,900 242 66
8 Isles of Scilly2
1,200 1,300 - - 238 6
9 Islington 77,300 90,200 29,000 17,200 234 51 10 Lambeth 109,300 142,000 32,800 16,400 222 36
Table 3: Areas with the highest volume of international migration per 1,000 population
Mid-2001 to mid-2006
Internal migration International migration Volume of migration per 1,000 population 1
Area In Out In Out All
migration
International migration 1 Westminster 88,700 95,200 65,700 37,700 259 93 2 Kensington &
Chelsea
48,200 59,200 49,400 29,100 217 91
3 Cambridge 54,100 57,900 28,500 18,200 278 82 4 City of London2
3,900 3,600 1,500 1,500 276 78 5 Camden 86,200 96,900 53,400 25,800 243 73 6 Oxford 66,000 70,800 31,900 17,000 258 68 7 Hammersmith &
Fulham
66,900 83,200 33,200 22,900 242 66
8 Islington 77,300 90,200 29,000 17,200 234 51 9 Brent 71,100 109,200 46,900 20,300 184 50 10 Wandsworth 123,400 142,300 40,800 27,300 243 50
Source: ONS: http://www.statistics.gov.uk/statbase/Product.asp?vlnk=601&More=N
Notes to tables:
1. Volume of migration per 1,000 population is calculated as (in migration + out migration)/population*1000 (separately for all migration and international migration).
2. Rates for the City of London and Isles of Scilly are based on less than 10,000 population.
[image:15.595.73.535.385.614.2]2.4 The range of data sources
In the absence of a comprehensive register of residential moves (which is used by some European countries) it is now widely acknowledged that significant improvements in migration data will only be achieved by drawing on a range of additional data sources. There are many relevant sources, all of which have limitations, but which taken in combination have the potential to provide better information. Further improvements could also be achieved if some relatively minor modifications were made to the way in which some of this data was collected or interrogated.
To get a full picture of migration and to plan for its impact, we need to be able to estimate both stocks – the total migrants at any given time – and flows – numbers arriving and numbers leaving – over a period. A brief summary of the main sources and their potential is set out below under the categories of censuses, surveys and administrative data:
(a) Censuses
UK Census –the 10 yearly national Census is the most reliable and comprehensive source of data on population and migration. Its migration question provides a measure of migrant in-flows during the census year, but not out-flows during that year. A stock picture is available using country of birth statistics but the lack of questions on nationality and year of arrival is a limitation. In 1966 a sample 10 per cent census was carried out and this was also planned in 1976, but cancelled. There have been no further mid-term sample censuses.
School Census (or Pupil Level Annual School Census/PLASC) – this provides an annual
comprehensive count of all children in grant maintained schools in the UK, some 8 million. Available on a consistent national basis since 2002 it includes address, age, ethnicity and first language. There is no question on nationality but first language provides a reasonable proxy. Pupils are recorded when they enter the system but not when they leave. Year on year comparison can provide a strong indicator of migration by families with children using the variables described and by identifying children who join the system at an age above the start of schooling, although this will not capture children arriving and leaving during the year. Fuller use could be made of the information on date of arrival at the school to give an indication of ‘churn’ where migrants are accompanied by their children.
(b) Surveys
IPS –As described above, theIPS is a sample survey of those entering and leaving the UK. Despite its small sample size this is important as the only measure of immigration and emigration for all types of migrant.
Labour Force Survey (LFS) – the LFS is a rolling quarterly survey of 60,000 households. It includes questions on nationality, ethnicity and current address, address one year ago and date of arrival in UK. Its main drawback is its sample size. Local boost samples can provide more robust data locally but in their absence ONS currently extrapolates from the 2001 census which does not capture the new migrant destinations.
(c) Administrative data
There is a range of administrative data which can provide important supporting information on migration and could be modified to provide more. Most of these sources are concerned with registrations rather than de-registrations and so are more valuable for measuring arrivals rather than those currently resident.
NHS central register/Flag 4 –Information derived from patient re-registration following a change of address (or change of GP) is the principal source of data used by the ONS to estimate internal
migration. A person registering with a GP whose previous address is outside the UK is flagged (and a different flag is given to a returning migrant where this is known). Flag 4 data can therefore provide an indication of international migration to an area. Flag 4 data can be valuable in capturing those who may be staying for less than 12 months (although those staying for a short period are less likely to register). Its limitations are that there is a time lag between entering the UK and registering and some, particularly young men, are known not to register, or to delay registration unless and until they have a medical need; the flag is lost when a patient moves within the UK and registers with another GP; and no date is held for the registration. However, if data could be provided on when a Flag was assigned to a patient record it could be improved as a measure of international migrant flows.
National Insurance Number (NINO) registrations – National insurance numbers are a necessary first step for employment/self employment and for claiming benefits and tax credits. NINOs provide a record of residential postcode, arrival and registration date, country of origin and age. The data is available at local level and provides valuable information about migrants who have come to work in a particular area (although the individual may live in one and work in another neighbouring authority, depending on housing availability and transport links). It does not provide data on how long the migrant intends to stay, nor record de-registrations, so cannot currently be used as a basis for
estimating migrants currently resident (and indeed it will not pick up on migrant changes of residence within the UK).
DWP are looking at ways of identifying the date of the last economic activity of each number holder and this should give an indication as to whether the holder is still in the country, although there clearly could be other reasons for ceasing to be in work, such as having a child.
Worker registration scheme (WRS) –this scheme was introducedspecifically to regulate access to the labour market and restrict access to benefits for the A8 accession countries who joined the EU in 2004 (together with Malta and Cyprus, which are not covered by the scheme). It is intended to be a temporary measure. Registration is required to take employment (but not self employment) in the UK. Data is produced for first job by occupational status, date of birth, gender and nationality. This provides useful information about the arrival of specific types of migrants to an area although the data is grouped by address of employer rather than applicant, and it will be first rather than
Higher Education Statistics Agency (HESA) – The HESA maintains a record of all students in the UK including those whose country of usual residence is outside the UK. These students comprise a large percentage of the total of migrants coming to the UK (nearly 300,000 from outside the EEA in 2004). Students give an estimate of their intended length of stay. There is an eleven-year time series of data which can provide information on stock (the total number of international students) and flow (new students and departing students). The main drawback is that data is recorded by administrative address of the institution, not domicile. However, the latter is to be introduced from 2007 and should provide a complete picture by 2010. Students who work should also be included in the data on applications for national insurance numbers.
Electoral Register (ER) – Each local authority is required to keep a register of all those entitled to vote. An annual, in theory compulsory, form is sent to every household and there is a rolling revision throughout most of the year. The ER form records nationality in order to determine in what, if any, elections the registrant is entitled to vote. If the nationality has no voting rights then the name is not added to the register and if this applies to the whole household than the register will show no elector. However, there is potential to make much greater use of the ER process. The new ER software
packages allow flags to be added to names so that they can be selected at times of elections. In theory this means that all names on completed forms could be recorded and non-electors flagged. This would then go some way to reflecting the population aged over 17. In addition, for those who have moved, the form asks for a previous address. This allows internal and external cross checks for ER purposes but it could also be used as a proxy migration figure. Comparison with the previous year’s register should also give a view on out migration. The drawback of using ER data is that it tends to under record in those areas of high migration or temporary residents. Greater efforts to capture all residents would be needed if it was decided to make greater use of the register to track migration and support better data on local populations currently resident.
National Asylum Support Service (NASS) – can provide local data on those asylum seekers currently receiving national support for accommodation or subsistence.
2.5 The challenge to improve estimates of migration
As already mentioned ONS has acknowledged the many concerns about the accuracy of its Total
International Migration data and mid year estimates, and set up the Improving Migration and Population Statistics Project (IMPS) to explore solutions. A key step was the establishment of an Inter-departmental Task Force on Migration Statistics. This reported in December 2006 and made a wide range of
recommendations for improving statistics over the next one to seven years. These included:
• Obtaining more information about migrants as they enter or leave the country
- Interviewing a larger sample of migrants having better identified which travellers are migrants. The recommendation was that this could be achieved by bringing forward key elements of the e-borders project including passport scanning
- Gaining more data from landing cards and requiring a sample of all travellers to complete them - Ensuring that migration data could be collected from the points based system being developed
• Obtaining more information about migrants living in this country
- Including a migration module in the Integrated Household Survey (which will replace the LFS from 2008)
- Including questions in the 2011 Census that identify short and long term migrants
• Link different data systems to improve information on migrants’ intentions on entry to the UK to subsequent events such as current and changing place of residence, employment, having a child and leaving the country
- Work and Pensions longitudinal study could be used to provide information on patterns of employment, children and benefits among migrants and linked to, for example, NINO and WRS (while this continues)
- Access to individual level School Census data would allow linking to other sources to improve statistics on migrants and their families
- Additional information on student migrants should be collected by HESA and access to individual data provided to allow linking to other sources
- Barriers to record linkage must be addressed. Work should start initially on sample data from entry records and two or more of NINO, NHS registration, Work and Pensions longitudinal study, PLASC, HESA, or WRS.
• Improve use of statistical and demographic models and bring together key information on migration held across government into a single report.
This is a powerful set of recommendations which, if implemented in full, would go a long way to providing the step change in the quality of migration statistics which is being sought. The concerns are around pace and the extent to which the recommendations will be implemented. The timescale in the report itself was one of up to seven years to introduce these improvements and the ONS action plan in response to the report is still to be agreed.
ONS has costed the full implementation of the report at £50m. It has recently produced proposals for prioritising the work in the light of its recent CSR settlement (and are suggesting an increase in their own expenditure of some £12m on migration and population) but it is clear that to implement the report in full will also require ‘innovative funding models’, which is to say financial support from other parts of
2.6 The use of case studies
Following on from the Task Force report, the ONS has conducted case studies in four local authorities to investigate whether other data sources or methods might improve the accuracy of population estimates in areas with specific characteristics. The areas were chosen because they had characteristics which were known to make estimating particularly difficult. The four areas and the principal recommendations were:
• Welwyn Hatfield was selected to represent a cluster of 17 local authorities from university cities and towns spread across England and Wales. The main factor affecting estimates in these areas is the high proportion of students in the population. The study recommended that the feasibility of treating students as a special population group should be investigated (this would require data on students’ term time addresses which is to be collected by the HESA from 2007)
• Hammersmith & Fulham was selected to represent a cluster of central London Boroughs with a high population density, high rates of migration and a high proportion of young males, and well above the national average proportions of students and population belonging to ‘non-White’ ethnic groups. The study endorsed the Welwyn conclusions and also recommended that further work should be done, in line with the recommendations of the Task Force, to explore the use of NINO, NHS registration data and the School Census and the linkages of this data with sources such as the Work and Pensions Longitudinal Study.
• Barnet was chosen to represent a cluster of outer London boroughs and some areas outside London with above average population density and migration, high proportions of young males, students and people from ‘non-white’ ethnic groups. The study also endorsed the proposals to consider students as a separate population and explore the wider use of NINO. It also recommended exploring how far the School Census could support ONS estimates of ethnic groups for compulsory school age (while acknowledging the absence of independent schools)
• Derby the most prominent factors in the Derby cluster were high proportions of people from ‘non-white’ ethnic groups, students and young men, as well as high population density. The
recommendations on students and the investigation of the wider use of sources such as NINO were as in the other studies. However, they also identified two local sources of information being used by Derby which justified further investigation to assess their value in testing the plausibility of population estimates:
- People UK is an individual life stage based classification tool produced by CACI, a private marketing and information company, to order. It can assign each adult in the UK into one of 50 different types based on their life stage, wealth and lifestyle. It is based on Ocean, a CACI database of individuals built up from a variety of different sources including data from the Electoral Roll and lifestyle surveys. It lists all persons aged over 18 but does not contain information on age and sex, so, for example young men cannot be separately identified. However, the study considered that it might have potential as an estimate of all persons aged 18 and over or to indicate changes in population over time if additional years’ data were obtained. More work would be needed to investigate the quality of this data source.
While the case studies clearly represent an attempt better to understand local sources of data on population and migration, and have made some useful recommendations, particularly in respect of students, these are still largely of the ‘further investigation is needed ‘ variety and therefore agreed solutions continue to stretch into the future. An assessment of the overall conclusions from the studies and their applicability to other authorities is not planned until the end of 2007.
2.7 Other reports and projects
The Community Cohesion Data and Population Mapping (COHDMAP) project was established by the Institute of Community Cohesion (ICoCo) in 2005 to help develop more accurate estimations of local populations and in particular, the changing nationality and ethnic mix of neighbourhoods. The first phase of the project, lead by Professor Mark Johnson of Leicester De Montfort University, consisted of a
consideration of those groups about whom it would be valuable to have information and an audit of available data sources. He identified the following sources as offering the greatest potential to meet the needs of service planners: PLASC; NHS patient registration records; electoral roll registrations (particularly if these could be ‘enhanced’); WRS; the registration of births and deaths with the future possible inclusion of ethnicity data; and information from social housing landlords who are required to record the ethnicity of their tenants (using the ONS categories).
Following the completion of the COHDMAP report a further piece of work has been done to develop an approach to estimating local populations and their health characteristics. The work, which has been led by Andrew Lawrence (an ICoCo associate) and Dr Colin Thunhurst of Coventry University, has involved case studies in two areas of Coventry and two in Leicester where there has been a high rate of “churn”. The COHDMAP results were used to identify those sources that could provide the most reliable data on population change in terms of both ethnicity and nationality and a series of focus groups and key informant interviews were carried out to draw on the intelligence of people within the communities themselves. The report, which was published in September 2007, makes a series of recommendations to central government and local practitioners about how information management could be improved to enable more reliable estimating to support service planning.
The Mayor of London commissioned Professor Phil Rees and Dr Peter Boden of Leeds University to undertake a review of methodologies which could underpin better estimates of London’s new migrant population. The review gives an extensive description of the various potential sources of data and argues the case for using a range of complementary data sets alongside the ONS’s Total International Migration (TIM) figures. “Definitional and conceptual issues are often cited as reasons why a data set cannot be used, primarily because of the desire for a ‘one number’ view of new migrants. We argue that the differences that exist between the datasets are the reason why the data should be used…”
The study recommended that a New Migrant Databank (NMD) be established which brings together the various data sets in a consistent and replicable manner. The proposed NMD would have:
• assembled tables of counts and derived indicators, geographic distribution, population composition, time series indicators for the UK, regions and local authorities (with the Leeds team referring particularly to London as required by their brief);
Subsequently the Leeds team won ESRC funding to develop a NMD on a national basis. The project is planned to begin in October 2007 and last for two years. The NMD now envisaged would aim to
aggregate the statistics from around six different national data sets (yet to be finalised) from 2001 – 2006 then harmonise them in order to be able to provide base projections for the 16 census ethnic groups. There will probably not be one golden number but projections for long term migrants, long term plus short term migrants, and long term plus short term migrants and visitors.
A steering group is being established to support the project which will include the ONS, who are backing the project, and the GLA. This is an important development and offers the prospect of more consistent and robust figures about the census ethnic groups nationally. However, after two years the NMD will not be in the fully-fledged state originally envisaged. While area profiles could be produced on request it is felt that further work will be needed to ensure ‘off the shelf’ profiles are available for all local authority areas. While the ONS is backing the project it has not given any commitment to take over the NMD at the end or progress the work at that stage.
It is also not clear how far nationality and immigration status will be included in the databank. This is a major drawback for migration work. The NMD will use nationally available data, much of which is broken down to the local authority level and below, to generate local estimates. However, at present there is no facility to draw upon locally generated local data, which is a limitation.
The NMD will be using existing data. It will also be important that steps are taken, outside the project, to improve the capacity and usefulness of current sources such as NINO, Flag 4, HESA and particularly electoral registration along the lines described earlier. Government departments should be pressed to be more open and consistent in making small area data available from administrative sources and to make individual level data available – at least to the ONS –so that the work on linkages can be progressed.
2.8 Using a residential register
3
The nature and scale of international migration
• International migration is a growing global phenomenon. Long-term migration to the UK (defined as stays of over twelve months) has officially increased from 320,000 in 1997 to 574,000 in 2006. Out migration has also increased during this period, but more slowly. Since 1998 migration has been the principal component of population change, overtaking natural change through births and deaths.
• The focus on migration and the demand for better statistics has increased since the accession of 10 countries to the EU in 2004 (A10 or A8 excluding Malta and Cyprus). Long term A8 migration officially increased from 20,000 in 2003/04 to 77,000 in 2004/05 and 74,000 in 2005/06. But total registrations for National Insurance numbers from all 12 accession states, which also reflect short term migration, were much higher reaching nearly 720,000 between 2004/05 and 2006/07. A8 migrants are predominantly from Poland, and are generally young and without dependents. Despite the attention it has received A8 migration comprised only 16 per cent of non-British long term in-migration in 2005/06, according to the official figures, although, as noted above, the numbers recorded by National Insurance registrations are much higher; migration from the New
Commonwealth made up 26 per cent.
• The growth in migration generally, particularly migrant workers, has also increased the demand for data on short term migrants, that is those staying less than 12 months. This is an area where even the Census is of limited value as it can only provide a snap shot. The definition of short-term migrants is not straightforward involving both intention (holiday, study, work etc) and length of stay. Initial IPS figures, for 2004, show an increase in short term migration for work but these appear too low to account for the gap between the figures for NINO registrations and long term in migration. ONS is to produce the first official national estimates in October but local figures cannot be estimated accurately from these and will need local data sources, ideally linked data on individuals.
3.1 The scale of international migration
Figure 1: Total international migration UK, mid 1996 to mid 2006
Source: ONS
Figure 2: Natural change and net migration and other changes UK, mid 1995 to mid 2006
Source: ONS
Total International Migration UK, mid-1996 to mid-2006
0 100 200 300 400 500 600 700
Year 1996 1997 1998 1999 2000 2001 2002 2003 2004 2005
Year Number (thousands)
In migration Out migration
Natural change and net migration and other changes UK, mid-1995 to mid-2006
0 50 100 150 200 250 300
Mid-year 1995 1996 1997 1998 1999 2000 2001 2002 2003 2004 2005
Year Number (thousands)
Natural change
[image:24.595.86.447.415.640.2]The focus on migration, and the need for better statistics, has sharpened since the accession of 10 countries to the European Union in 2004 (usually referred to as the A10 countries or A8 excluding Malta and Cyprus which already had migration rights to the UK). Table 4 shows international migration for the three years from 2003/04 to 2005/06 by main area of origin.
Table 4: Total long term international migration, mid-year estimates: Citizenship, 2003-4, 2004-5, 2005-6, United Kingdom (thousands)
Citizenship
European Union Commonwealth
All British
Non-British
EU15 A10 A8 EU25 All Old New Other
foreign
Inflow
2003-04 526 93 433 67 21 20 82 195 70 125 155
2004-05 593 87 505 68 78 77 146 202 69 133 157
2005-06 559 91 468 73 76 74 149 179 58 121 140
Outflow
2003-04 353 195 158 37 11 10 40 57 39 18 61
2004-05 334 188 146 37 4 3 42 58 35 23 47
2005-06 383 196 187 45 17 16 62 60 38 22 65
Balance
2003-04 +173 -101 +275 +30 +11 +9 +42 +138 +30 +108 +95
2004-05 +258 -101 +359 +30 +74 +74 +104 +144 +34 +110 +110
2005-06 +176 -105 +281 +28 +59 +58 +87 +119 +20 +99 +75
Source: ONS: News Release 22 August 2007
A traditional measure of diversity in the UK has been the percentage of people from black and minority ethnic backgrounds (BME). However many BME residents are, of course, longstanding British citizens and residents, often 2nd
or 3rd
[image:26.595.79.372.206.396.2]generation. Another measure of diversity is the percentage of UK residents born outside the UK. This has been rising steadily from 4.2 per cent of the population in 1951 to 8.3 per cent in 2001. It is almost certainly higher than that now (Figure 3).
Figure 3: Overseas born population as a percentage of total UK population
Source: ONS
3.2 A8/A12 migration
The numbers of long term A8 migrants officially increased from 20,000 in 2003/04 to 77,000 in 2004/05 accounting for the great majority of the increase in migration that year. This level of A8 migration has continued into 2005/06. Table 4 above also shows that A8 migrants officially comprised only 16 per cent of non-British long term in migration in 2005/06 and their numbers continue to be well below those of new commonwealth migrants who made up 26 per cent.
However, as we have seen from Table 1 there is evidence from National Insurance registrations that the figure for long term A8 migration is a considerable underestimate and does not, of course, include substantial levels of short term migration. Almost 720,000 A12 migrants registered for National Insurance between 2004/05 and 2006/07. The majority of the A8 migrants have been Polish.
3.3 Short term migration
Defining short-term migrants is more complex than long term and depends on both the reason for a visit and the length of stay. The UN definition is: “A person who moves to a country other than that of his or her usual residence for a period of at least three months but less than a year except in cases where the movement to that country is for purposes of recreation, holiday, visits to friends and relatives, business, medical treatment or religious pilgrimage.” This could, however, be extended to include for example all those coming to work even if less than three months, or those on long term holiday. ONS have consulted on the definition. Local government users were generally more interested in extending the UN definition to include all reasons for visits, central government departments generally wanted to include employment and study of less than three months. Data on average length of stay was also requested.
Table 5 sets out an initial view of in-flow and out flow of overseas residents by length of stay and reason for visit drawn from the IPS. Between 2003 and 2004 the number of short-term migrants who came for employment or study grew from 71,000 to 104,000. This growth was due almost entirely to an increase in those coming here to work, from 13,000 to 40,000, but this figure was still less than those coming to study. Moves for less than three months for ‘other visits’ (including holidaymakers) was overwhelmingly the largest category. The size of these flows shows the potential difficulty of including all moves of less than 12 months. Out-flows for under and over three months were much greater than in- flows but driven by ‘other visit’ reasons.
[image:27.595.75.532.518.759.2]It is difficult to square these relatively modest figures for the increase in those short term migrants coming to work, between 2003 and 2004, with what we know from Table 1 about the gap between the numbers of foreign nationals registering for National Insurance and the official figures for long term migration. Clearly there is either a significant underestimation of short term migrants, long term migrants or both. Again, the reliability of the IPS, which is the basis for both estimates, is called into question. It will be important to see the estimates for short term migration for 2005 and 2006 when they are produced in October 2007 as, again as we see from Table 1, the gap between the estimate of long term migration and NINO registrations to foreign nationals is widening year on year.
Table 5: Flow of overseas residents into England and Wales: length of stay and reason for visit
Thousands
Reason for visit 2003 2004
Inflow <3 months 3-12 months <3months 3-12 months
Total 19,699 216 22,045 237
Employment and study 537 71 528 102
Employment 53 13 89 40
Study 484 58 438 63
Other Visits 19,162 144 21,517 135
Outflow
Total 56,933 431 59,176 375
Employment and study 185 41 161 34
Employment 141 31 118 24
Study 44 11 44 10
Other Visits 56,748 389 59,014 341
Whatever their accuracy nationally, the new short term migration estimates will not be available at a local level. It is also difficult to estimate stocks, rather than flows, of short-term migrants. Again, as with long term migration, work needs to be done to capture more effectively the data available from other sources. In the case of short term migration the most promising are likely to be NINO, work permits, WRS, LFS and GP registration. PLASC and electoral registration are clearly less useful in this case.
3.4 Illegal migrants
For obvious reasons it is very hard to arrive at a credible estimate of illegal or clandestine migrants. Using the ‘residual method’, which takes the total foreign born population in 2001 as the benchmark and then deducts the number of migrants known to be here legally, the Home Office has estimated that there were 430,000 illegal migrants in 2001 (0.7 per cent of the total population) with a range of 310,000 to
570,000. Others, such as the pressure group Migration Watch, have argued that the figure is much higher. Evidence of the levels of illegal migrants from amnesties in other European countries varies widely. If the UK had the same proportion of illegal migrants as Italy, then the number would be close to 900,000, if it was more like France the number would be only 100,000. John Salt of the Migration Research Unit at University College London, who was special advisor on the Home Office study, has estimated that in his opinion the level of illegal migrants in Britain is somewhere between the French and Italian levels – 400,000 to 500,000 or 14 per cent to 17.5 per cent of the legally resident migrant population. It is likely that illegal migrants are concentrated in localities of traditional migration and that their impact in those areas is significant. Ideally that should be recognised and understood but without periodic amnesties it would be very difficult to record numbers.
3.5 Asylum seekers
4 Developing local measures
Given the inadequacy of national data on migration local authorities have sought to use a range of administrative and other data sources to provide a fuller picture of migration and its distribution. These have been described in chapter 2. All have some limitations but, particularly taken together, they can both provide a powerful challenge to the accuracy of current ONS estimates, especially those at local level, and useful information about the changing make up of a local area which local authorities need to plan and deliver services. This chapter covers the following:
• Tables comparing NINO registrations to foreign nationals, WRS and Flag 4 GP registrations with ONS estimates for international ‘in migration’ at local authority level show a degree of variation which casts serious doubts on the adequacy of the ONS data. For example, a comparison of Flag 4 data with migration estimates by authority shows 50 authorities where the Flag 4 figure is over 200 per cent higher than the migration estimate and over 70 others where it is 70 per cent or less.
• All the administrative sources can provide a partial picture of the distribution of migrants. NINO and WRS have been used to show that A8 migrants have had a much wider geographical distribution than other migrants, many going to areas with little previous experience of migration and diversity – only 13 of the local authorities with the highest proportion of BME residents in 2001 were also in the top 50 for the proportion of WRS registrations between May 2004 and March 2007.
• The growth in the percentage of births to women born outside the UK, from 12.8 per cent to 21.9 per cent of all births between 1996 and 2006 is a clear indicator of the growth of migration in recent years and its particular concentration in certain areas, notably London.
• PLASC data is used to show those authorities with the highest proportion of pupils whose first language is not English (a proxy for international migrants) and how this is changing year on year. Again London boroughs predominate.
• A range of examples are given of the many local authorities which have carried out local studies to understand better the changing nature of their communities using both the kind of data described above and qualitative methods including interviews with migrants and those who come into contact with them.
4.1 The development of additional indicators
4.1.1 National Insurance Numbers (NINOs)
[image:30.595.85.473.242.784.2]The first of these is NINO registration to overseas nationals. As discussed earlier, these give the residential address, and give an indication of the arrival of economic migrants. However they do not indicate whether the migrant changes residence within the UK, or leaves the UK, and do not include migrants who do not work, or are working in the informal economy. They are therefore not a good measure of migrants currently resident in a locality.
Table 6: Local authorities ranked by BME (2001) and NINOs registered to overseas nationals (2006/7) as percentage of population: top fifty
Authorities in italics appear in only one table all others appear in both
Authority ranked by percentage
BME (2001 census) %
Authority ranked by percentage
NINO (2006/07) %
Newham 60.6 City of London 7.9
Brent 54.7 Newham 6.6
Tower Hamlets 48.6 Brent 5.8
Ealing 41.3 Tower Hamlets 5.5
Harrow 41.2 Hammersmith and Fulham 5.2
Hackney 40.6 Haringey 4.9
Lambeth 37.6 Westminster 4.8
Southwark 37 Ealing 4.7
Redbridge 36.5 Hounslow 4.6
Slough UA 36.3 Waltham Forest 4.3
Leicester UA 36.1 Wandsworth 4.2
Waltham Forest 35.5 Lambeth 4.2
Hounslow 35.1 Southwark 3.8
Haringey 34.4 Slough UA 3.7
Lewisham 34.1 Kensington and Chelsea 3.7
Croydon 29.8 Boston 3.7
Birmingham 29.6 Camden 3.7
Luton UA 28.1 Hackney 3.7
Camden 26.8 Islington 3.6
Westminster 26.8 Merton 3.4
Barnet 26 Oxford 3.3
Merton 25 Cambridge 3.0
Islington 24.6 Peterborough UA 3.0
Enfield 22.9 Reading UA 3.0
Hammersmith and Fulham 22.2 Isles of Scilly 2.9
Wolverhampton 22.2 Barnet 2.8
Blackburn with Darwen UA 22.1 Lewisham 2.8
Wandsworth 22 Leicester UA 2.6
Bradford 21.7 Manchester 2.6
Kensington and Chelsea 21.4 Harrow 2.6
Hillingdon 20.9 Greenwich 2.6
Sandwell 20.3 Bournemouth UA 2.5
Manchester 19 Northampton 2.2
Coventry 16 Watford 2.1
Oadby and Wigston 16 Crawley 2.1
Kingston upon Thames 15.5 Redbridge 2.1
City of London 15.4 Coventry 2.0
Nottingham UA 15.1 Enfield 2.0
Pendle 15.1 Nottingham UA 2.0
Barking and Dagenham 14.8 Southampton UA 2.0
Preston 14.5 Corby 2.0
Kirklees 14.4 Kingston upon Thames 1.9
Watford 14 Barking and Dagenham 1.9
Oldham 13.9 Welwyn Hatfield 1.9
Walsall 13.6 Croydon 1.9
Reading UA 13.2 Bristol, City of UA 1.8
Bedford 13 South Holland 1.8
Oxford 12.9 Hillingdon 1.8
Derby UA 12.6 Brighton and Hove UA 1.7
[image:31.595.82.464.85.580.2]Sources: ONS, DWP
Table 6 uses NINO figures for all registrants who were overseas nationals. The geographical distribution becomes more widespread when the focus is on A8 migration. The maps at Figure 4 show, among other things, London with a relatively smaller proportion of A8 migrants than non A8 migrants and East Anglia higher.