Improving the Security of AODV Protocol using
V-Detector Algorithm
Alaa Althalji
Postgraduate Student (MSc) Systems and Computer NetworksDept
Aleppo University, Syria
Souheil Khawatmi
Assistant Professor Systems and Computer NetworksDept
Aleppo University, Syria
Mohamed Khatib
DoctorArtificial Intelligence and Natural Language Dept Aleppo University, Syria
ABSTRACT
Routing in Mobile Ad Hoc Networks (MANETs) is very important because they are infrastructure-less, so the routing protocol in these networks works on each node. If routing protocols do not work properly, the network will stop. In these networks, there is no centralized control or server to control the activities of nodes, so they are more vulnerable to many security risks and attacks such as the black hole attack and the gray hole attack. In this paper, the proposed Defensive AODV protocol (DAODV) is used to defend against these attack using the V-Detector algorithm which is an artificial immune system algorithm. The results show that the proposed DAODV provides much better performance than the normal AODV in the presence of malicious nodes in the network.
Keywords
Mobile Ad-hoc networks, AODV, black hole attack, gray hole attack, V-Detector, Artificial Immune Systems.
1.
INTRODUCTION
Mobile Ad Hoc Network is a collection of mobile wireless nodes, which create a temporary network. Nodes in this network are free to move, so the wireless network topology can be changed quickly and unexpectedly, because new nodes may join in the network, and other nodes can leave it. In MANETs, most routing protocols are designed without regard to security precautions to protect routing, assuming that all nodes are reliable. This creates a lot of security problems because some nodes can affect the discovering route process to make the packets arrive at them. AODV is the most popular and widely used reactive routing protocol, but it suffers from vulnerabilities so the attackers exploit them to drop data packets in the network [1].So this paper aims to overcome these weaknesses by proposed the defensive protocol, DAODV is simulated in ns-2 environment. This paper is organized as follows. In the second AODV and its vulnerabilities are given. Section 3 brings related works. In section 4 the immune system is illustrated and section 5 proposes approach. Simulation setup and results can be found in section 6 and concluding are given in section 7.
2.
AD HOC ON-DEMAND DISTANCE
VECTOR ROUTING (AODV)
In AODV, when a node wants to send data packets to the destination node, it checks its routing table to see if it has a route to the destination, If Yes, it forwards packets to the next hop, else it initiates a route discovery process, and broadcasts a route request packet (RREQ). It uses sequence numbers to make sure that the route is loop free and fresh. When a node forwards a route request packet to its neighbors, it also records RREQ information in its routing tables. The neighbors
in turn broadcast RREQ to their neighbors till it reaches to an intermediate node that has recent route information about the destination or till it reaches to the destination, then it sends a Route Reply (RREP) to the source, which can start sending data after accepting the first RREP packet [2].
2.1
The significant Vulnerabilities present
in the AODV Protocol
2.1.1
Deceptive increasing of Sequence Numbers
The Sequence number aims to decide the freshness of a route. It is refreshed when a fresher control packet is received with a bigger sequence number. A malicious node may maximize the Sequence number to advertise a fresher route towards a particular destination [3].
2.1.2
Deceptive decrementing of Hop Count
Nodes prefer the RREP packet with a higher destination sequence number and shorter route length. Malicious nodes exploit this mechanism to generate false RREP with low value of hop counts [3].
2.2
Types of attack
The attackers exploit the Vulnerabilities of AODV protocol to attack the network, the following is some types of attack:
2.2.1
Black hole Attack
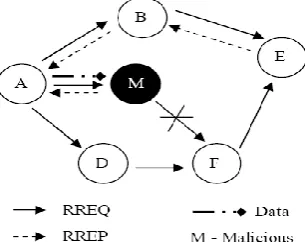
[image:1.595.342.495.622.743.2]This attack is done by one malicious node or more, which use fake RREP packets to advertise that they have the freshest and the shortest route to the destination node. In this attack, the purpose of the malicious node is to drop all packets that are directed to it, instead of forwarding them as intended [4]. Figure 1. shows an example of the black hole attack in MANET network, node M is a malicious node. When node A wants to send data to node E, it will send a broadcast of RREQ, when M receives this RREQ, it sends fake RREP, and when this RREP arrives at node A, it will start sending data, but malicious node M will drop this data.
2.2.2
Gray hole Attack
This attack is like Black Hole Attack, but malicious nodes partially drop data packets during the connection, thus reducing the probability of attacker detecting [4].
3.
RELATED WORK
In [5] Abdelshafy and King used Blackhole Resisting Mechanism (BRM) to resist attacks. A node regularly sends a fake RREQ from a fake source node to a fake destination node, so only malicious nodes will reply to this fake RREQ. If a node receives RREP to its fake RREQ from one of its neighbors, the node ensures that this neighbor is a malicious node. The simulation was done with a network of 100 nodes, results showed that BRM-AODV is less overhead than SAODV but more overhead than AODV because of periodically sending a fake RREQ. In [6] Dhende et al proposed a secure AODV protocol (SAODV) for detection and removal of the black hole and gray hole attacks in MANETs, the neighbor’s opinion is taken into account, but the disadvantages of this method is that opinions are not always correct. The simulation was done with a network of 85 nodes. In [7] Baghel et al proposed an approach for detecting black hole nodes in MANETs. All incoming RREPs are collected in a table, then source node calculates the average of the destination sequence number of these RREPs, and set it as threshold (Th) value. If the destination sequence number is greater than or equal to Th value, then it will be considered as fake RREP. But when many of malicious nodes exist this will affect the value of average, so in [7] when the number of nodes increased to 90 nodes, the packet delivery ratio did not reach more than 70%. In [8] Behzad et al proposed an approach for detecting black hole attacks in MANETs based on the artificial immune system. The simulation was done with a network of 100 nodes. Simulation results showed that the overall performance of AIS-DSR is better than DSR routing protocol in terms of throughput, packet drop ratio and lost packets, but The proposed AIS-DSR technique still drops about 20% of packets.
The previous studies did not work to repel the attack for networks larger than 100 nodes, so this paper aims towork on large networks up to 300 nodes and propose a better mechanism to detect the attack with getting the best performance of AODV protocol. This is the major cause of choosing the AIS approach into MANETs, which is based on modeling the behavior of the human immune system.
4.
IMMUNE SYSTEM
The immune system is a host defense system comprising many biological structures and processes within an organism that protects against disease. This section explains the biological immune system (BIS) in our body and the artificial immune system, which is inspired by BIS.
4.1
Biological Immune System (BIS)
The BIS is an adaptive system that has evolved to protect against pathogens. The BIS provides this protection through sophisticated pattern discrimination and response mechanisms. The antibody recognizes a unique molecule of the pathogen, called an antigen. Proteins found on the surface of pathogens are called antigens and are unique to that pathogen. Like pathogens, our body tissues also contain antigens known as self-antigens and those found on the surface of pathogens are called nonself antigens. The process of recognition between self-antigens and nonself antigens is known as self/nonself discrimination. The thymus gland is responsible for the maturation and production of immune cells
called lymphocytes, which are responsible for the recognition of nonself antigens. [9]
4.2
Artificial Immune System (AIS)
The artificial immune system is a collection of intelligent algorithms inspired by the characteristics of the Biological Immune System (BIS), which is able to detect abnormalities, so the negative selection algorithm inspired by the thymus is developed. Thymustrains T cells to distinguish self cells from non-self cells and thus detect any foreign cell. Application fields of AIS are computer security, clustering, classification, anomaly detection, and function optimization. [10]
4.2.1
Negative Selection Algorithm
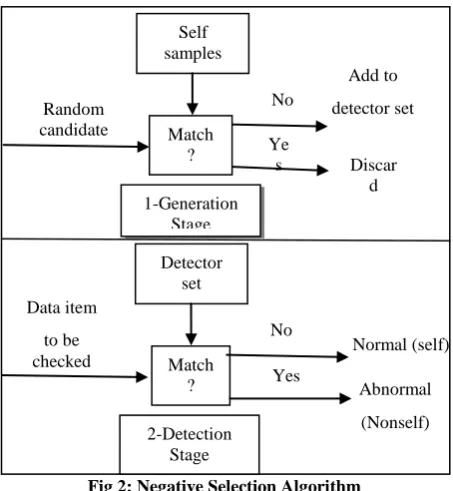
[image:2.595.316.543.238.484.2]The negative selection algorithm consists of two phases: the generation and detection phases (see figure 2) [11].
Fig 2: Negative Selection Algorithm
There is a various family of NSAs that has been developed, the basic characteristics of the original NSA introduced by Forrest are remaining. However, the first NSA has high time cost complexity and space complexity. According to data representation there are two types of NSA: the binary NSAs(BNSAs) and the Real-Valued NSAs (RNSAs). Table1 shows a simple taxonomy of NSA. [12]
Table 1. NSA classification
NSA types
Criteria’s Binary NSA
Real NSA
Constant-sized detector
Variable-sized detector
Abbreviation BNSA CRNSA
VRNSA(V-detectors) Radius Constant Constant Variable
Matching rules
r-contiguous rule, r-chunks,
landscape-affinity matching, Hamming distance
Euclidian distance and its derivation Self
samples
1-Generation Stage
Match ? Detector
set
2-Detection Stage Match ?
Add to detector set Random
candidate
No
Discar d Ye
s
Data item to be checked
Normal (self)
Abnormal (Nonself) No
[image:2.595.310.548.580.764.2]Advantages
- Suitable for discrete space (representation
and search) - Implementation
and simplicity
High level representation , expressiveness and
scalability
-
- Small number of
detector -Best coverage of
non-self
Drawbacks
The binary representation
has some limitations for the real world
problems
- The lack of continuous adaptability -Low detection rate and
high false positive rate - Large time cost and space
complexity - Great
number of detectors to
cover the non-self space - Great Overlapping
between detectors
- Presence of the holes
- some overlapping
between detectors
4.2.2
V-detector algorithm
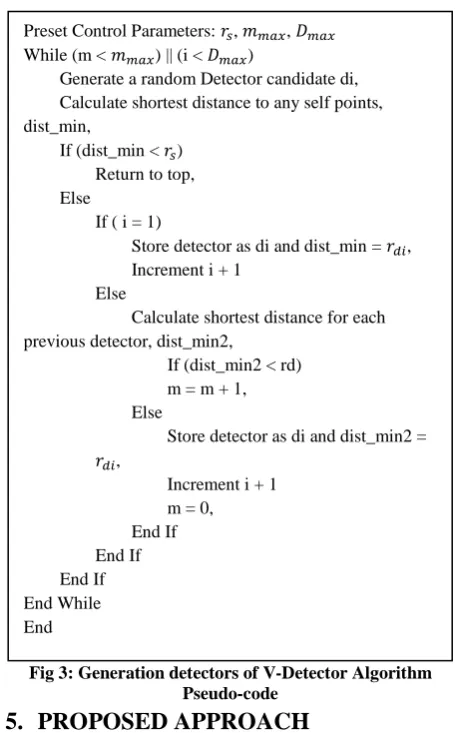
[image:3.595.313.541.67.434.2]The algorithm of V-detector is the latest and the most mature version, it took the most advantages from the other versions. It was proposed by Zhou Ji, the aim of it is to deal with the disadvantages of constant size detectors. So in this algorithm, the size radii of detectors are changed from one to others. Figure 3 represents the pseudo-code of generation detectors in V-detectors algorithm. [11]
Shape space: The properties of antigen and antibody can be described with a list of k parameters as points in k-dimensional shape space. The specified measure of the affinity between the antibody and the antigen represents the strength of the binding between them. [9]
Fig 3: Generation detectors of V-Detector Algorithm Pseudo-code
5.
PROPOSED APPROACH
To represent the artificial immune system in the research problem, Table 2 shows the developed abstract model of immune organs and cells.
Table 2. Mapping between BIS, AIS, and MANET
BIS AIS MANET
Human body Application Domain Mobile Ad-hoc networks
Thymus Negative Selection
Algorithm V-detectors
Antibody
Detector Ab= [ab1, ab2 ,..,abk]
Ab=[Life-time, Difference _DSN,
HOP COUNT REPLY ]
Antigen
Ag=[ag1, ag2,..., agk] Difference _DSN, Ag=[Life-time, HOP COUNT
REPLY ]
In the proposed approach, different size networks were simulated without executing any attack and recorded the RREPs received by the nodes, then selected the proper parameters for representing detector and self-data in the V-detectors algorithm. The following parameters were chosen: Life-time: expiration or deletion time of the route [2]. The attacker always sends new false RREP, so the Life-time value of fake RREP will always be high.
Preset Control Parameters: , , While (m < ) || (i < )
Generate a random Detector candidate di, Calculate shortest distance to any self points, dist_min,
If (dist_min < ) Return to top, Else
If ( i = 1)
Store detector as di and dist_min = , Increment i + 1
Else
Calculate shortest distance for each previous detector, dist_min2,
If (dist_min2 < rd) m = m + 1, Else
Store detector as di and dist_min2 =
,
[image:3.595.48.287.70.382.2]Difference_DSN: The difference in value between the destination sequence number mentioned in RREP, it is symbolized (DSN IN RREP) and the destination sequence number mentioned in the routing table, it is symbolized (DSN IN RT). The Difference_DSN value of fake RREP will always be high. This equation to calculate it.
Difference_DSN = DSN IN RREP - DSN IN RT HOP COUNT REPLY: In [8] researchers relied on the value of hop count mentioned in the received RREP, which means the length of the path from the source to the destination, but it does not mean the value of hop count that sent by the malicious node. The hop count in RREP that sent from a malicious node does not necessarily be smaller than the hop count that sent from a normal node, because the malicious node sets a very small number of hop count but this number is grown when RREP forwards from node to another. Therefore, the length of the route from source to destination is finally gotten. So to detect fake RREP, the value of hop count that sent from the node which sent RREP packet was needed to know. By using TTL (Time to Live) field in IP header which is set with the biggest value (TTL_MAX) by origin node, in the example, it equals 10 (see figure 4), then it decrements on each node, this equation to calculate it.
[image:4.595.315.572.235.509.2]HOP COUNT REPLY=HOP COUNT- (TTL_MAX - TTL)
Fig 4: Example of black hole attack
In Figure 4. shows an example, node A wants to send data to E, so it sends broadcast of RREQs when request packet reaches to malicious node F, it will send RREP with fake hop count equals 1. However, node D sends RREP with hop count equals 2, so node A receives RREP from F which route length equals 4 and D which route length equals 3. HOP COUNT REPLY at node A it equals 1 for RREP that sent by node F and equals 2 for RREP that sent by node D, so the value of HOP COUNT REPLY is better than the value of HOP COUNT to detect malicious nodes. So the HOP COUNT REPLY value of fake RREP will always be low. So the detector is represented as the real valued vector Ab and RREP as Ag.
Ab=[Life-time, Difference _DSN, HOP COUNT REPLY ] Ag=[Life-time, Difference _DSN, HOP COUNT REPLY ]
5.1
Generation phase
It is the offline phase implemented in MATLAB program. First, the parameters (Life-time, Difference _DSN, HOP COUNT REPLY) which are gotten from the network simulation are stored, then this data is preprocessed and normalized to form self-data set. The V-Detector algorithm use this set for training, Euclidean distance is used as the affinity measure between Ab and Ag, to finally get the detectors.
5.2
Detection phase
The detection phase will be in real-time, so the detectors, which were gotten from the generation phase are added to the
AODV protocol code and the protocol is modified to resist the attack by checking the correctness of the RREP received.
5.2.1
Proposed DAODV Defensive Protocol
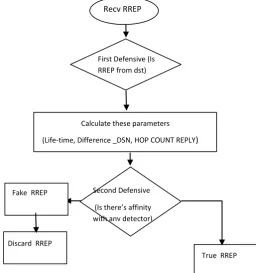
A new additional method to receive RREP is proposed, it is called Defensive recvReply, this method has two defense lines of the network. In the first line of defense, received RREP packet is examined, if it arrived from the destination then the node makes sure that is correct RREP and the route is safe then call recvReply method to update the routing table and send data. In the second line of defense, received RREP is examined if there is an affinity between it with any detectors, then it is considered fake RREP and it is ignored, otherwise it is a valid RREP then call recvReply method to update the routing table and send data. As shown in Figure 5.
Fig 5: proposed Defensive recvReply method in DAODV
6.
SIMULATION SETUP AND RESULTS
NS-2[2.35] network simulator has been used. Mobility scenarios are generated by using a random way point model by varying 50 to 300 nodes moving in the simulation area of 600m x 600m, routing protocol is AODV without attack, AODV_ATTACK is AODV protocol with black hole attack, GHAODV is AODV protocol with gray hole attack, DAODV is the proposed protocol to counter the attacks. The following parameters were used, in table 3.
Table 3. Simulation Parameters
Simulator NS-2 (version 2.35) Simulation Time 1000 (s) Number of Nodes 50 to 300
Simulation Area 600 x 600m
Routing Protocol AODV, AODV_ATTACK, GHAODV, DAODV Discard RREP
True RREP Fake RREP Second Defensive
(Is there’s affinity with any detector) First Defensive (Is RREP from dst)
Recv RREP
Calculate these parameters
(Life-time, Difference _DSN, HOP COUNT REPLY)
A B
D
F
H
E C
G TTL = 10 TTL = 9
TTL = 8
TTL = 10 Hop count =3
TTL = 9 Hop count =4 TTL = 7
[image:4.595.54.281.338.455.2]Mobility 0-5m/s
No. Of Malicious Node 10% of number of node in network
6.1
Performance Metrics [8]
Packet Delivery Ratio (PDR): The ratio of packets that are successfully delivered to a destination compared to the number of packets that have been sent out by the sender. Packet Loss Ratio: The ratio of the number of packets dropped by nodes due to various reasons to the number of data packets generated by the sources.
Packet Drop Ratio: The ratio of the number of packets dropped due to a malicious node to the number of data packets generated by the sources.
Throughput: The number of data bits delivered to the application layer of the destination node in unit time measured in kbps.
Average End-to-End Delay: The average time taken for a packet to be transmitted across the network from source to destination.
Normalized Routing Load(NRL): The number of routing packets for route discovery and route maintenance required to deliver the data packets from sources to destinations.
6.2
Simulation result of comparing
[image:5.595.49.288.72.104.2]between AODV and DAODV without
attack:
Figure 6 displays that the packet delivery ratio of AODV with 50 nodes is 97.675%, but when the number of nodes is boosted up to 300, PDR decreases to 89.631% due to rise congestion in the network. Figure 7 visualizes that the packet drop ratio of AODV is 0% because there is no attack so there won’t be dropping packets. Figure 8 shows the packet loss ratio of AODV protocol in networks with 50 nodes without an attack is 2.322% and up to 10.342% in networks with 300 nodes due to congestion and collision. Figure 9 displays that the throughput of AODV protocol without an attack is up to 289kp/s in the network with 50 nodes, but it decreases to 272kp/s when the number of nodes increasing to 300, due to decrease the PDR. Figure 10 discloses that the NRL of AODV is very low and up to 4.164% in large networks with 300 nodes without attack because of increasing the number of routing packets when losing the data. Figure 11 displays that the average end-to-end delay of AODV without an attack is little value and grows in larger networks due to increases in the packet loss ratio.
When AODV and DAODV are compared in networks without executing any attack, the results showed that the performance of the proposed protocol exactly identical to AODV, which is the most important characteristic of this method, because the best modification does not cause negative impact on the performance. This confirms that the generated detectors are very good, because they do not attack self cells (correct RREPs) in the network.
6.3
Comparing between AODV without
attack, AODV_ATTACK and DAODV
with Black Hole Attack:
Figure 6 shows the packet delivery ratio against the number of nodes. The PDR of AODV is high but when the black hole attack is started in the network, the PDR lowers in the
[image:5.595.314.545.332.749.2]network of 50 nodes to 27.511%, but in large networks with 300 nodes it minimizes to 3.911%, because they were more affected due to congestion and spreading wrong information by the malicious nodes, this leads to collapse the network and stop delivery Packets approximately. PDR of DAODV is significantly more than AODV_ATTACK but did not reach the packet delivery ratio in AODV because DAODV still suffers from a very little drop and loss of packets. In the worst case of an attack with 300 nodes, the PDR of DAODV is 82.284%, and the PDR difference between DAODV with attack and AODV without attack is only 6.831%. In networks with 50 nodes, the difference is only 0.541%. So the proposed method could counter the attack in small networks better than the big network. Figure 7 illustrates the packet drop ratio against the number of nodes. The packet drop ratio of AODV is 0% but when executing a black hole attack this ratio will significantly increase to 65.864%, but in large networks the packet loss ratio is greater than packet drop ratio due to congestion caused by fake RREP thus most packets are lost and do not reach the malicious nodes to be deleted. The packet drop ratio remarkably decreases for DAODV compared with AODV_ATTACK, because DAODV protocol was able to counter the attack and prevent packets drop, but this ratio of DAODV is still slightly more than the AODV protocol.
Fig 6: Packet delivery ratio vs Number of nodes
Fig 7: Packet Drop Ratio .vs Number of nodes
Fig 8: Packet Loss Ratio .vs Number of nodes
50 100 150 200 300
AODV 97.675 94.546 94.574 93.801 89.631 AODV_ATTACK 27.511 23.550 9.567 7.036 3.911 DAODV 97.134 92.035 91.156 87.986 82.284
0 20 40 60 80 100
P
A
C
K
ET
D
EL
IV
ER
Y
R
A
TI
O
%
AODV AODV_ATTACK DAODV
50 100 150 200 300
AODV 0.000 0.000 0.000 0.000 0.000
AODV_ATTACK 65.864 56.583 52.982 27.569 12.931
DAODV 0.243 1.303 1.521 1.760 2.683
0 10 20 30 40 50 60 70
P
A
C
K
ET
D
R
O
P
R
A
TI
O
%
AODV AODV_ATTACK DAODV
50 100 150 200 300
AODV 2.322 5.445 5.392 6.172 10.342
AODV_ATTACK 6.620 19.814 37.383 64.987 82.771
DAODV 2.612 6.631 7.298 10.204 14.939
0 20 40 60 80 100
P
A
C
K
ET
L
O
SS
R
A
TI
O
%
Figure 8 shows the packet loss ratio against the number of nodes.The packet loss ratio of AODV is low and it increases in networks with the black hole attack, due to congestion caused by RREP messages sent by malicious nodes, so the packet loss ratio is equal to 6.620% in the network of 50 nodes and 82.771% in large networks with 300 nodes. The value of packet loss ratio significantly reduces for DAODV compared with AODV_ATTACK but DAODV packet loss is still little more than AODV. When the cause of packets loss was analyzed, it turns out that no enough buffer space in the queue, that is because the node keeps its data until a secure route is found. This problem can be solved by increasing the buffer space without effect on the network performance. Figure 9 shows the throughput against the number of nodes. The throughput of AODV is high but when the attack is carried out, it reduces to 81kp/s in the network with 50 nodes and reaches to 13.309kp/s in networks with 300 nodes because of the impact of attack on them is significant. The value of throughput significantly improves for DAODV compared with AODV_ATTACK, but it did not reach to AODV protocol because there was still little drop and lost.
Fig 9: throughput .vs Number of nodes
Fig 10: Normalized Routing Load .vs Number of nodes
Fig 11: Average end-to-end delay .vs Number of nodes
Figure 10 shows the Normalized Routing Load against the number of nodes. The NRL of AODV is low but when the attack is executed, NRL increases very much because malicious nodes always send fake RREP and the attack causes a maximize in packets loss, thus the sending of RRER and RREQ rises to find a new route for the data.
The value of NRL minimizes for DAODV compared with AODV_ATTACK because it was able to counter the attack, so reducing number of routing packets that may be sent when data packets deleted by the attacker, but the NRL of DAODV protocol is still little more than normal AODV because attackers send RREP messages every time it receives RREQ thus increasing the routing load. Figure 11 shows the Average end-to-end delay against the number of nodes. The average end-to-end delay of AODV is low but when an attack is executed, the delay increases considerably. The value of the Average end-to-end delay for DAODV is little more than the AODV protocol because nodes need to wait until finding a safe route.
6.4
Comparing between AODV without
attack, GHAODV and DAODV with
Gray Hole Attack:
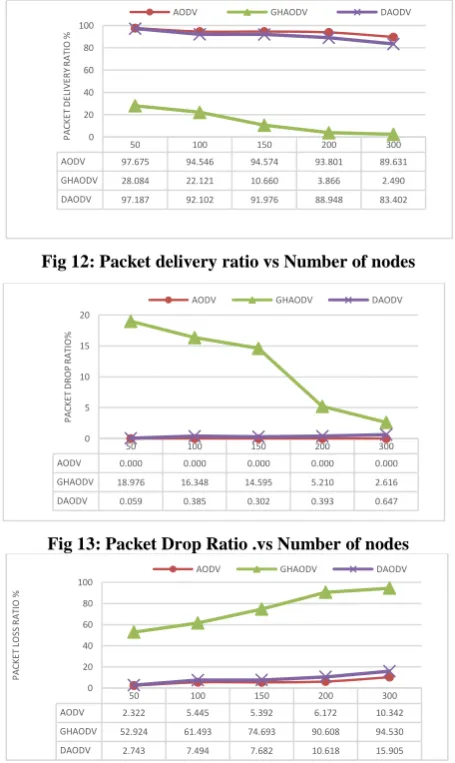
[image:6.595.314.542.359.741.2]The results show that the performance of the proposed protocol (DAODV) to defend against the gray hole attack is familiar to the one with black hole attack.
Fig 12: Packet delivery ratio vs Number of nodes
Fig 13: Packet Drop Ratio .vs Number of nodes
Fig 14: Packet Loss Ratio .vs Number of nodes
50 100 150 200 300
AODV 289.479 284.465 276.804 277.974 272.330 AODV_ATTACK 81.495 70.747 27.978 21.541 13.309 DAODV 287.738 276.701 266.950 260.433 249.885
0 50 100 150 200 250 300 350 TH R O UG H P UT K P /S
AODV AODV_ATTACK DAODV
50 100 150 200 300
AODV 0.324 1.026 1.583 2.143 4.164
AODV_ATTACK 4.065 15.189 138.923 284.220 903.162
DAODV 0.337 1.061 1.754 2.472 4.425
0 1 10 100 1000 N O R MA LI ZE D R O UT IN G L O A D
AODV AODV_ATTACK DAODV
50 100 150 200 300
AODV 0.141 0.288 0.284 0.540 0.559
AODV_ATTACK 0.518 1.608 1.925 2.249 2.312
DAODV 0.168 0.363 0.448 0.591 0.889
0.000 0.500 1.000 1.500 2.000 2.500 A V ER A G E EN D -TO -E N D D EL A Y (S )
AODV AODV_ATTACK DAODV
50 100 150 200 300
AODV 97.675 94.546 94.574 93.801 89.631 GHAODV 28.084 22.121 10.660 3.866 2.490 DAODV 97.187 92.102 91.976 88.948 83.402
0 20 40 60 80 100 P A C K ET D EL IV ER Y R A TI O %
AODV GHAODV DAODV
50 100 150 200 300
AODV 0.000 0.000 0.000 0.000 0.000
GHAODV 18.976 16.348 14.595 5.210 2.616
DAODV 0.059 0.385 0.302 0.393 0.647
0 5 10 15 20 P A C K ET D R O P R A TI O %
AODV GHAODV DAODV
50 100 150 200 300
AODV 2.322 5.445 5.392 6.172 10.342
GHAODV 52.924 61.493 74.693 90.608 94.530 DAODV 2.743 7.494 7.682 10.618 15.905
0 20 40 60 80 100 P A C K ET L O SS R A TI O %
Figure 12 shows the packet delivery ratio against the number of nodes. The graph displays that The PDR of DAODV is remarkably higher than GHAODV so that the packet delivery ratio of GHAODV with 50 nodes is 28.084%, but when the number of nodes equals 300, PDR decreases to 2.490% due to rising the effect of the gray hole attack in big networks. When DAODV used, the PDR of DAODV 50 nodes is 97.187%, when the number of nodes equals 300, PDR is 83.402%, so the proposed protocol could repel this attack. DAODV is nearby AODV so that the PDR difference between DAODV with attack and AODV without attack in networks with 300 nodes is only 6.229%. In networks with 50 nodes, the difference is only 0.488% so DAODV could protect the small networks more effectively than the big networks. Figure 13 displays that the packet drop ratio of GHAODV is low because the gray hole attack is intended to partially drop data packets. It is reduced to 2.616% in large networks because the packet loss ratio is increased. The packet drop ratio of DAODV is obviously decreased compared with GHAODV, and it is nearly zero because the proposed method could detect the fake RREP. The packet loss ratio of GHAODV in figure 14 is much bigger than the packet drop ratio in figure 13 because the gray hole attack does not always drop packets so this causes too much loss of the data packet. So figure 14 shows the packet loss ratio of GHAODV equals 52.924%, and up to 94.530% in networks with 300 nodes. The value of packet loss ratio of DAODV is obviously decreased compared with GHAODV but DAODV packet loss is still little more than AODV because the node keeps its data until a secure route is found so the buffer is often full and there will not be enough buffer space in the queue.
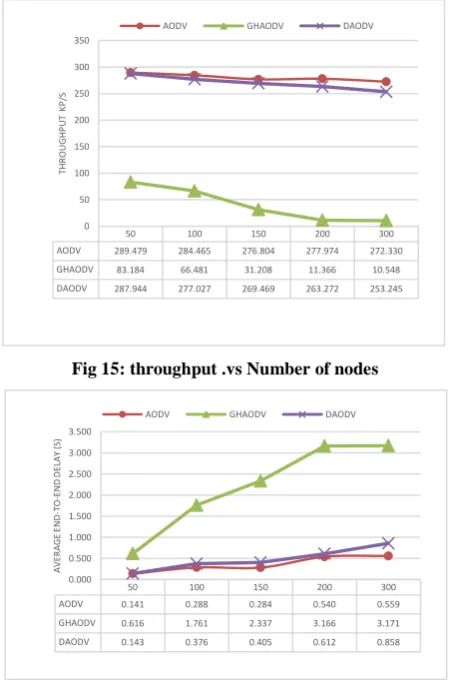
Fig 15: throughput .vs Number of nodes
Fig 16: Normalized Routing Load .vs Number of nodes
Fig 17: Average end-to-end delay .vs Number of nodes
From figure 15, the throughput of GHAODV is much lower than AODV because the gray hole attack causes losing and dropping packet so it equals 10.548 kp/s in networks with 300 nodes. It is clear that the throughput is significantly enhanced for DAODV compared with GHAODV but it did not reach to AODV protocol because there was still little drop and loss of data packets. Figure 16 illustrates the Normalized Routing Load of GHAODV is very high because malicious nodes always send fake RREP and the gray hole attack causes a maximize in packets loss, thus the sending of RRER and RREQ rises to find a new route for the data. DAODV is very low compared with GHAODV and is nearby AODV because DAODV can counter the attack, so less routing packets are sent. Figure 17 shows the Average end-to-end delay against the number of nodes. The diagram displays that the average end-to-end delay of GHAODV grows when the number of nodes increases due to the drop and loss of the packets when the gray hole attack is executed. The delay of DAODV is lower than the GHAODV and is nearby AODV because it decreases the effect of this attack.
7.
CONCLUSIONS
The proposed method used the artificial immune system to repel the black hole attack and the gray hole attack. RREP is represented in the V-detector algorithm using three parameters that have crucial effect to know the fake RREP. These parameters are the number of hops sent by the malicious node, the life-time parameter and the difference between the sequence number of the RREP and the sequence number in the routing table. The proposed protocol minimizes the effect of the attack remarkably. The results of the black hole attack showed the packet drop ratio is 0.243% in small networks and 2.683% in large networks, while the results of the gray hole attack showed the packet drop ratio is 0.059% in small networks and 0.647% in large networks. This research is concluded that the proposed protocol DAODV was able to resist the attack, protect the routing table from updating it with wrong information, and protect the data from deletion by the attacking nodes because the performance of DAODV with attacks is nearby AODV without any attack. However, the performance of DAODV without an attack is identical to that of AODV without an attack, which means that the proposed method does not cause a negative impact on performance.
8.
REFERENCES
[1] BANG A., 2015. Wireless Ad-Hoc Networks: Types, Applications, Security Goals. International Journal of Advent Research in Computer and Electronics ,128-132. [2] PERKINS C.E., BELDING-ROYER E.M., and DAS
S.R., 2003. Ad Hoc On-Demand Distance Vector Routing. Network Working Group, IETF RFC 3561. [3] Panday M., Shriwastava A., 2013. A Review on security
50 100 150 200 300
AODV 289.479 284.465 276.804 277.974 272.330 GHAODV 83.184 66.481 31.208 11.366 10.548 DAODV 287.944 277.027 269.469 263.272 253.245
0 50 100 150 200 250 300 350
TH
R
O
UG
H
P
UT
K
P
/S
AODV GHAODV DAODV
50 100 150 200 300
AODV 0.141 0.288 0.284 0.540 0.559
GHAODV 0.616 1.761 2.337 3.166 3.171
DAODV 0.143 0.376 0.405 0.612 0.858
0.000 0.500 1.000 1.500 2.000 2.500 3.000 3.500
A
V
ER
A
G
E
EN
D
-TO
-E
N
D
D
EL
A
Y
(S
)
AODV GHAODV DAODV
50 100 150 200 300
AODV 0.324 1.026 1.583 2.143 4.164
GHAODV 5.734 17.230 130.916 608.334 1121.259 DAODV 0.340 1.084 1.682 2.480 4.347
0 1 10 100 1000 10000
N
O
R
MA
LI
ZE
D
R
O
UT
IN
G
L
O
A
D
Issues of AODV routing protocol for MANETs. IOSR Journal of Computer Engineering,14(5), 127-134. [4] LISS M., 2011. Network Layer Misbehavior in Mobile
Ad Hoc Networks. EE4723: Computer and Network Security.
[5] Abdelshafy, M. A., & King, P. J. 2016. Resisting blackhole attacks on MANETs. IEEE Annual Consumer Communications & Networking Conference (CCNC) (pp. 1048-1053).
[6] Dhende, S., Musale, S., Shirbahadurkar, S., & Najan, A. 2017. SAODV: Black hole and gray hole attack detection protocol in MANETs. In 2017 International Conference on Wireless Communications, Signal Processing and Networking. 2391-2394.
[7] Baghel, L., Mishra, P., Samvatsar, M., & Singh, U. 2017. Detection of black hole attack in mobile ad hoc network using adaptive approach. International conference of
Electronics, Communication and Aerospace Technology. 626-630.
[8] Behzad, S., Fotohi, R., Balov, J. H., & Rabipour, M. J. 2018. An Artificial Immune Based Approach for Detection and Isolation Misbehavior Attacks in Wireless Networks. Journal of Computers, 13(6), 705-720. [9] Floreano, D. and Mattiussi, C., 2008. Bio-inspired
artificial intelligence: theories, methods, and technologies. MIT press.
[10] Tan, Y., 2016. Anti-Spam Techniques Based on Artificial Immune System. CRC Press.
[11] Ramdane, C. and Chikhi, S., 2017. Negative selection algorithm: recent improvements and its application in intrusion detection system. Int. J. Comput. Acad. Res.(IJCAR), 6(2), pp.20-30.