ISSN (Print) : 2320 – 3765 ISSN (Online): 2278 – 8875
I
nternational
J
ournal of
A
dvanced
R
esearch in
E
lectrical,
E
lectronics and
I
nstrumentation
E
ngineering
(An ISO 3297: 2007 Certified Organization) Website: www.ijareeie.com
Vol. 6, Issue 2, February 2017
Detection of Image Forgery Using Illuminant
Light Source
M.John Milton1, S.Monisha2, R.Kayalvizhi3, S.Kavyaa4
Assistant Professor, Dept. of ECE, V.S.B Engineering College, Karur, Tamilnadu, India1 UG Student, Dept. of ECE, V.S.B Engineering College, Karur, Tamilnadu, India2,3,4
ABSTRACT: The digital image plays an important role in information forensics and security, due to the popularity of image editing tools. In this paper, we explore image illuminant maps, to propose a methodology for selecting and characterizing visual properties for an automated detection of image forgeries. We estimate the statistical features of color, shape,texture features and location of image by DCT and SIFT algorithm. In existing method they have analyzed the photographic manipulation of image composition or splicing. This approach achieved only the accuracy up to 84-94%. In the proposed method, we focus on detecting image forgeries containing people and present a method for locating the pinpointing image forgeries. By using SIFT algorithm, we compare the value of original and forgery image in order to detect questioned images downloaded from the internet. The photo details can be easily identified and provide 100% detection of fake images. This is expected to avoid the crime and forgeries that has been done in digital image.
KEYWORDS: Illuminant light, digital forensics, color illumination, pixel comparison.
I.INTRODUCTION
As the use of digital images has become more common throughout society, to create digitally forged images has increased. Nowadays, image editing tools are very popular and easily available, that’s why making forgeries in digital images is an easy task without leaving obvious evidence that can be recognized by human eyes. So the image authentication and reliability of images emerged as an important problem. So, the Digital Image Forensics emerged as research field that aims to detect the forgery in digital images .The tampering without any pre embedding of information. Passive approach does not require any prior explicit information about the images. The main drawback of active image forensics is that it requires pre embedded information in digital Image. The main goal of Digital Image Forensics is to check the authenticity and integrity of digital images. Digital Image Forensics is of two types: Active and Passive. Active image forensics requires the pre embedded information such as watermark or digital signature in digital images for tampering detection. While the passive image forensics detects mages, which is not always available, because most of the cameras available in the market are not equipped with the facility to embed the watermark or digital signature in images that can be used later in forensic analysis. Passive image forensics overcome this drawback and is widely used for forgery detection in digital images as most of the images available today are without any watermark or digital signature .In this paper the passive image forensic method is presented to detect one of the important tampering techniques known as Copy-Move forgery in which a part of an image is copied and pasted on another part of the same image. Copy-Move forgery is performed in order to hide certain details or to duplicate objects within an image .With the emergence of digital forensics over the past few years, trust in the field of digital imagery has been restored. Forgery detection aims to tell whether the digital image content is authentic without image forgery operations. Till now, several methods have been proposed to detect forgeries. Basically, the digital image forgery detection methods are classified into Active Digital Image Forensics and Passive Digital Image Forensics or Blind Digital Image Forensics . Unlike the active method such as digital watermarking and digital signature the passive approach does not rely on pre-embedded information.
ISSN (Print) : 2320 – 3765 ISSN (Online): 2278 – 8875
I
nternational
J
ournal of
A
dvanced
R
esearch in
E
lectrical,
E
lectronics and
I
nstrumentation
E
ngineering
(An ISO 3297: 2007 Certified Organization) Website: www.ijareeie.com
Vol. 6, Issue 2, February 2017
Low Level: Statistical characteristics of digital image pixels or DCT coefficients are used to detect the tampering.
Middle Level: Methods at this level use simple semantic information to detect the trace of tampering
High Level i.e., semantic level: Sometimes tampering is done with an intention to change the meaning of image content it originally conveyed, which becomes very difficult for computer to use semantic information to detect forgery. For example, it does not make sense to have an image in which Barrack Obama shaking hands with Osama Bin Laden.
II. RELATED WORK
The digital age, with all its facilities, also has its nuisances. One of them, empowered by cheap computing devices and powerful image editing software, is photo tampering. With little effort and a proper image manipulation tool (e.g., Adobe Photoshop or Gimp), ordinary people can create masterpieces depicting unbelievably credible photomontages with ease. In addition, the ever-growing quality and power of image editing software have taken image splicing to a whole new level of credibility and difficulty of detection. Such difficulties lead to the need of development of equally sophisticated methods for detecting image telltales left by forgers. Methods that explore some degree of illumination inconsistencies for detecting image splicing have been the focus of many researchers for over a decade. Basically, they can be divided into two types of approaches: (a) those that look for inconsistencies in light source environment; and (b) the ones that look for inconsistencies in the estimated light source color from the image.
The approaches grounded on inconsistencies of light source environment estimate the environment illumination from an image in the acquisition moment, which involves estimating the light source position or reconstructing a full illumination model from the scene.On the other hand, approaches grounded on inconsistencies of light source color focus on exploring different kinds and levels of information provided by estimated scene illuminants. Furthermore, this kind of approaches can be subdivided into three groups: the first one explores the specular part in the dichromatic reflectance model; the second one proposes to subdivide the image into small regions, on top of which they compute the illuminant descriptors; and the last one, which can either be seen as an extension of the second group, as it does not contribute to illuminant estimation directly, or as a subgroup by itself, as it focuses on substantial processing on top of IMs. Dichromatic planes are estimated through Principal Component Analysis (PCA) from each specular highlight region of an image. Applying a Singular Value Decomposition (SVD) on an RGB matrix extracted from highlighted regions, the authors extract the eigenvectors associated with two significant eigenvalues to construct the dichromatic plane. This plane is then mapped onto a straight line, named dichromatic line, in normalized rg-chromaticity space. For distinct objects illuminated by the same light source, the intersection point produced by their dichromatic line intersection represents the illuminant color. If the image has more than one illuminant, it will present more than one intersection point (not expected to happen in pristine images). One problem with this method is the need of well-defined specular highlight regions for estimating the illuminants.
A.BINARY SIMILARITY MEASURE: These measures capture the correlation and texture properties between and within thesignificance bit planes, which are more likely to be affected by manipulations.
B.IMAGE QUALITY MEASURE: These focus on the difference between a doctored image and its original version. Theoriginal not being available, it is emulated via the blurred version of the test image.
C. HIGHER ORDER WAVELET STATISTICS: These are extracted from the multiscale decomposition of the image.
ISSN (Print) : 2320 – 3765 ISSN (Online): 2278 – 8875
I
nternational
J
ournal of
A
dvanced
R
esearch in
E
lectrical,
E
lectronics and
I
nstrumentation
E
ngineering
(An ISO 3297: 2007 Certified Organization) Website: www.ijareeie.com
Vol. 6, Issue 2, February 2017
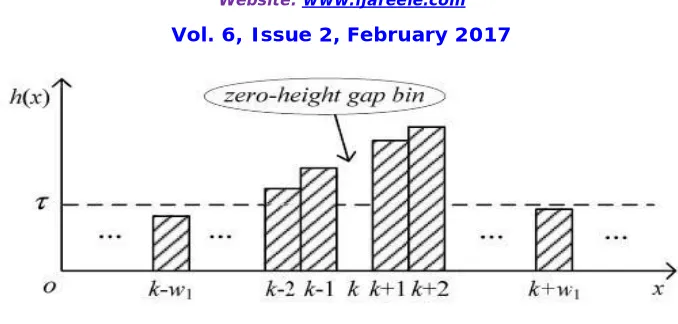
Fig. 1: the Definition of zero height gap bin
1. Detecting globally applied contrast enhancement in image
Contrast enhancement operations are viewed as non linear pixel mapping which introduce artifacts into an image histogram. Non linear mappings are separated into regions where the mapping is locally contractive. The contract mapping maps multiple unique input pixel values to the same output pixel value. Result in the addition of sudden peak to an image histogram.
2. Detecting locally applied contrast enhancement in image
Contrast enhancement operation may be locally applied to disguise visual clues of image tampering. Localized detection of these operations can be used as evidence of cut-and-paste type forgery. The forensic technique is extended into a method to detect such type of cut-and- paste forgery.
3. Detecting Histogram equalization in image
Just like any other contrast enhancement operation, histogram equalization operation introduces sudden peaks and gaps into an image histogram. The techniques are extended into method for detecting histogram equalization in image.
4. Detecting Noise in image
Additive noise may be globally applied to an image not only to cover visual evidence of forgery, but also in an attempt to destroy forensically significant indicators of other tampering operations. Though the detection of these types of operations may not necessarily pertain to malicious tampering, they certainly throw in doubt the authenticity of the image and its content. The technique for detecting noise is able to detect whether the image is in noise or not, such as speckle noise, Gaussian noise etc.
The methodology used is known as global contrast enhancement detection technique. This algorithms works by seeking out the unique artifacts left behind by histogram equalization. However, the paper specifies only about the detection of global enhancement and not about the local enhancement.
III. PROPOSED FORGERY DETECTION METHODOLOGY
This section describes each step of the proposed image forgery detection methodology.
ISSN (Print) : 2320 – 3765 ISSN (Online): 2278 – 8875
I
nternational
J
ournal of
A
dvanced
R
esearch in
E
lectrical,
E
lectronics and
I
nstrumentation
E
ngineering
(An ISO 3297: 2007 Certified Organization) Website: www.ijareeie.com
Vol. 6, Issue 2, February 2017
image splicing, which is specific for pinpointing composites of people, is developed aiming at minimizing the user interaction. The splicing detection task consists in labelling a new image among two pre-defined classes (real and fake) and later pointing out the face with higher probability to be the fake face. In this process, a classification model is created to indicate the class to which a new image belongs. The image forgery detection methodology comprises four main steps:
1) Description: relies on algorithms for estimating IMs, a transformed representation space of the input image, and extracting image visual cues (e.g., color, texture, and shape), encoding the extracted information into feature vectors.
2) Face Pair Classification: relies on algorithms that use image feature vectors to learn intra- and inter-class patterns of the images to classify each new image feature vector.
3) Forgery Classification: consists in labelling a new image into one of existing known classes (real and fake) based on the previously learned classification model and description techniques.
4) Forgery Detection: once knowing that an image is fake, this stage aims at identifying which face is more likely to be fake in the image.
Fig.2 Pixel value comparison
IV.MODULE DESCRIPTION
PHOTO DETAIL ANALYSIS: It can often be difficult to tell whether an image has been modified in one way or another, but tools like JPEG Snoop are able to give you a clue as to whether a file has been touched up.
PRE PROCESSING: Pre processing step is used for remove the noise in the image. Filters are used for remove the noise in the images. Its resize the images between the pixel size of [0 255].
SEGMENTATION: Graph cut algorithm is used for segment the image part.Its locate the particular that area of images
V. IMAGE FORENSIC TOOLS
Pixel-based techniques-These techniques includes that tools which helps in detecting statistical anomalies introduced at the pixel level.
ISSN (Print) : 2320 – 3765 ISSN (Online): 2278 – 8875
I
nternational
J
ournal of
A
dvanced
R
esearch in
E
lectrical,
E
lectronics and
I
nstrumentation
E
ngineering
(An ISO 3297: 2007 Certified Organization) Website: www.ijareeie.com
Vol. 6, Issue 2, February 2017
Camera-based techniques- These techniques includes that tools which exploit artifacts introduced by the camera lens, sensor, or on-chip post-processing.
Physically based techniques - These techniques includes that tools which explicitly model and detect anomalies in the three dimensional interaction between physical objects, light, and the camera.
VI. ALGORITHM BASED METHODS Representation of Images in IM Transformed Space:
In general, the literature describes two main classes of algorithms for estimating IMs and thus representing an input image as an illuminant map: statistics-based and physics-based. On one hand, statistics-based IM estimation algorithms rely on hypotheses related to statistics of image pixels (e.g.,grayworld illuminant method assumes that, under a white light source, the average pixel colors in a scene is achromatic). On the other hand, physics-based IM estimation methods rely on theoretical formulations of how light interacts with objects (e.g., considering the dichromatic reflection model).
Bearing in mind that both classes of IM estimation methods capture different image illumination information, and taking advantage of the strategy proposed by Riess and Angelopoulou, which divides the image into small clusters with similar color (named superpixels) to estimate illuminants locally at each superpixel, the proposed method herein takes advantage of these different types of information to muster complementary features in the forgery detection process.
Choice of Color Space Model and Face Extraction:
Some color space models are more appropriate for extracting meaningful features than others depending on the target application. Additionally, as far as we know, there is no research in digital forensics showing whether or not a specific color space is more suitable for representing image cues when analyzing forgeries, specially when illuminant maps. Therefore, given that some description techniques are more suitable for specific color spaces, this step converts illuminant maps into different color space representations for further exploration and study.
1).Feature Extraction from IMs: From each extracted face in the previous step, we need to find telltales that allow identification of spliced images. Such information is present in different visual properties (e.g., texture, shape, color, among others) and becomes detectable when we transform suspicious images into an IM representation. Differently from texture properties, shape properties present in IMs of fake faces, sometimes, have distinct pixel intensities when compared to shapes present in IMs of faces that originally belong to the analyzed image. While comparing the image between the pixel , the value of original and the forgery image is identified by using the scale invariant Fourier transform .It exactly assures the forgery image with 100% efficiency. This technique is widely used to avoid the illegal fraud work.
2). Face Pair Classification:In this section, we show details about the classification step. When using different IMs, color spaces, and description techniques, the obvious question is how to automatically select the most important ones to keep and combine for an improved classification performance. Let C be a set of classifiers in which each classifier cj
ISSN (Print) : 2320 – 3765 ISSN (Online): 2278 – 8875
I
nternational
J
ournal of
A
dvanced
R
esearch in
E
lectrical,
E
lectronics and
I
nstrumentation
E
ngineering
(An ISO 3297: 2007 Certified Organization) Website: www.ijareeie.com
Vol. 6, Issue 2, February 2017
Finally, C∗, containing the most promising classifiers and satisfy a defined threshold T, are selected. T is a threshold defined in terms of the average accuracy among all classifiers using validation set V.
3). Forgery Classification : Given an image I that contains q people, it is characterized by a set S = {P1,P2,···,Pm} being m = q×(q−1) 2 and q ≥ 2. We adopt a strategy that prioritizes forgery detection. Hence, if any paired feature
vectorP ∈S is classified as fake, we classify the image I as fake. Otherwise, we classify it as pristine or non-fake.
4). Forgery Detection:Moving one step forward, we design a specific method for detecting, among all the faces in an image, the one with the highest probability to be the fake face. Given an image I classified as fake, we now refine the analysis pointing out which part of the image is the result of a composition. For this task, we take advantage of IMs estimated from different principles (statistical-based and physics-based). The reason is that the aforementioned techniques can produce IMs with different aspects for the same image. In a through analyses of the IMs produced by these two different models, we realized that the appearance in terms of colors in IMs generated for pristine faces are very similar in GGE and IIC.
VII. EXPERIMENTS AND RESULTS
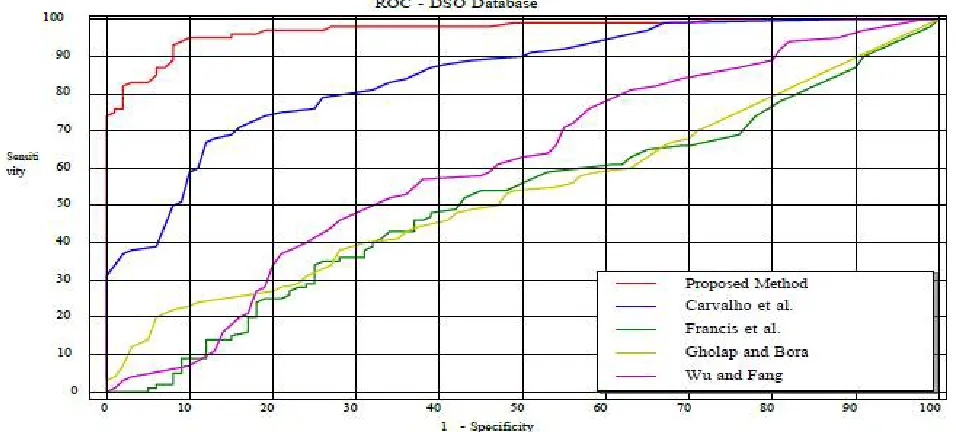
This section describes the experiments performed in this work to show the effectiveness of the proposed method as well as to compare it with state-of-the-art counterparts. Round #1 intends to show the best k-nearest neighbor (kNN) classifier to be used in the additional rounds of tests. Instead of focusing on a more complex and complicated classifier, we select the simplest one possible for the individual learners in order to show the power of the features we employ as well as the utility of our proposed method for selecting the most appropriate combinations of features, color spaces, and IM transformed space. Round #2 aims at comparing the proposed method to four methods of the literature using DSO-1, a realistic dataset comprising high-resolution pristine and fake images. Round #3 compares the performance of the KNN classifier to more complex learning methods, enforcing our choice for usingthesimplestmethod.Round#4 explores the ability of the proposed method to find the actual forged face in an image, while Round #5 shows specific tests with DSI-1. For a direct comparison with the results reported in , we also present ROC curves and their AUCs for the most representative methods. Sensitivity (number of true positives or the number of fake images correctly classified) and specificity (number of true negatives or the number of pristine images correctly classified) are also provided for operational point.
ISSN (Print) : 2320 – 3765 ISSN (Online): 2278 – 8875
I
nternational
J
ournal of
A
dvanced
R
esearch in
E
lectrical,
E
lectronics and
I
nstrumentation
E
ngineering
(An ISO 3297: 2007 Certified Organization) Website: www.ijareeie.com
Vol. 6, Issue 2, February 2017
The proposed method has been implemented using Matlab R2016b and computer of CPU 2.20 GHz with memory of 1 GB. Hard disk of 120 GB Pentium core is being used. The monitor of 15 inch is used to get the appropriate ouput. The images have been selected from dataset. Large images which have a relatively high resolution of more than 3000 x 2400 pixels are considered for our test since an overall higher number of feature vectors exits, and thus there is a considerably higher probability of matching wrong block. The duplicated regions in the tampered image also significantly vary in size and texture. The image processing tool box is taken to do the detection of image forgery by double pixel comparison.
For a better visualization, Figure depicts a direct comparison between the superiority of our results. Table shows the results of all tested combinations of |C∗| on each testing fold and their average and standard deviation. Given that the
forensic scenario is more interested in a high classification accuracy than a real-time application (our method takes around three minutes to extract all features from an investigated image), the use of all 54 classifiers is not a major problem. However, the result using only the best subset of them (|C∗| = 20 classifiers) achieves an average accuracy of
99.9% (with a Sensitivity of 84.0% and a Specificity of 97.0%) with a standard deviation of 2.1%.
Another important point of this work is the form we present the obtained results. We use the average accuracy across the 5-fold cross-validation protocol and its standard deviation. The accuracy rate is calculated as
where TP, FN, TN, FP are, respectively, results for true positives, false negatives, true negatives and false positives. For a direct comparison with the results reported in, we also present ROC curves and their AUCs for the most representative methods. Sensitivity (number of true positives or the number of fake images correctly classified) and specificity (number of true negatives or the number of pristine images correctly classified) are also provided for operational points.
VI.CONCLUSION
The proposed method is custom-tailored to detect splicing on images containing faces, there is no principal hindrance in applying it to other, problem-specific materials in the scene. The proposed method requires only a minimum amount of human interaction and provides a crisp statement on the authenticity of the image. This work also introduced two important contributions for the forensic community. First, a confidence metric associated with each classified image. Second, we proposed a method for effectively pointing out the region of an image that was forged. Finally, note that although our method employs illuminant maps with light source, it is used to detect the appropriate image forgery. Our proposed method would raise the identification of criminal act from 84% to 99.9%. So it will be easy to find the images stolen from the internet or either captured by the digital camera.
REFERENCES
1. Tiago and Christian et al Exposing Digital Image Forgeries by Illumination Color Classification. IEEE Transactions on Information Forensics and Security (Page: 1182 – 1194)Year of Publication: 2013.
2. P.D and Arunvinodh C, “IMAGE FORGERY DETECTION USING SVM CLASSIFIER”, IEEE International Conference on Innovations in Information, Embedded and Communication Systems (ICIIECS), 2015.
3. A. Rocha, W. Scheirer, T. E. Boult, and S. Goldenstein, “Vision of the unseen: Current trends and challenges in digital image and video forensics,” ACM Comput. Surveys, 2011.
4. Tiago José de Carvalho, Christian Riess, Elli Angelopoulou, Hélio Pedrini and Anderson de Rezende Rocha,“Exposing Digital Image Forgeries by Illumination Color Classification”, IEEE Transactions On Information Forensics And Security, Vol. 8, No. 7, July 2013.
5. A. Rocha, W. Scheirer, T. E. Boult, and S. Goldenstein, “Vision of the unseen: Current trends and challenges in digital image and video forensics,” ACM Comput. Surveys, 2011.
6. S.Shaid."TypesofImageForgery."Internet:http://csc.fsksm.utm.my/syed/research/image-forensics/11-types-of-imageforgery.html, Feb.08, 2010 12:17 [Dec. 4, 2012].
ISSN (Print) : 2320 – 3765 ISSN (Online): 2278 – 8875
I
nternational
J
ournal of
A
dvanced
R
esearch in
E
lectrical,
E
lectronics and
I
nstrumentation
E
ngineering
(An ISO 3297: 2007 Certified Organization) Website: www.ijareeie.com
Vol. 6, Issue 2, February 2017
8. R. T. Tan, K. Nishino, and K. Ikeuchi, “Color constancy through inverseintensity chromaticity space,” Journal of the Optical Society of America A, vol. 21, p. 2013
9. J. van de Weijer, T. Gevers, and A. Gijsenij, “Edge-Based Color Constancy,” IEEE Transactions on Image Processing, vol. 16, no. 9, pp. 2207– 2214, 2014.
10. A. Gijsenij and T. Gevers, “Color constancy using natural image statistics and scene semantics,” IEEE Transactions on Pattern Analysis and Machine Intelligence, vol. 33, no. 4, pp. 687–698, 2011.
11. P. A. S. Kimura, J. M. B. Cavalcanti, P. C. Saraiva, R. da Silva Torres, and M. A. Gonc¸alves, “Evaluating retrieval effectiveness of descriptors for searching in large image databases,” Journal of Information and Data Management, vol. 2, no. 3, pp. 305–320, 2011.