International Journal of Nanomedicine
Use of immunomagnetic reduction for C-reactive
protein assay in clinical samples
Chien-Hsi Chang1 Zhi-Xian Lai1 Hsiu-Li Lin2 Che-Chuan Yang3 Hsin-Hsien Chen3,4 Shieh-Yueh Yang5 Herng-Er Horng3 Chin-Yih Hong6 Hong-Chang Yang4 Hsiu-Chen Lin1,7
1Department of Laboratory Medicine,
Taipei Medical University Hospital,
2Department of Neurology, General
Cathay Hospital, Sijhih Branch,
3Institute of Electro-optical Science
and Technology, National Taiwan Normal University, 4Department of
Physics, National Taiwan University,
5MagQu Co, Ltd, Sindian District, New
Taipei City, 6Department of Mechanical
Engineering, Nan-Kai University of Technology, Nan-tau County,
7Department of Pediatrics, School of
Medicine, College of Medicine, Taipei Medical University, Taipei, Taiwan
Correspondence: Hsiu-Chen Lin Department of Laboratory Medicine, Taipei Medical University Hospital, 252 Wu Hsing Street, Taipei 110, Taiwan Tel +88 62 2737 2181 ext 8465 Fax +88 62 2736 2649 Email [email protected]
Background: Magnetic nanoparticles biofunctionalized with antibodies are able to recognize and bind to the corresponding antigens. In this work, anti-C-reactive protein (CRP) antibody was covalently conjugated onto the surface of magnetic nanoparticles to label CRP specifically in serum.
Methods: The level of serum CRP was detected by immunomagnetic reduction (IMR) assay, which identifies the changes in the magnetic signal representing the level of interaction between antibody-conjugated magnetic nanoparticles and CRP proteins. To investigate the feasibility of IMR for clinical application, pure CRP solutions and 40 human serum samples were tested for IMR detection of CRP to characterize sensitivity, specificity, and interference.
Results: In comparison with the immunoturbidimetry assay, the results of the IMR assay indicated higher sensitivity and had a high correlation with those of the current immunotur-bidimetry assay.
Conclusion: We have developed a novel and promising way to assay CRP in human serum using immunomagnetic reduction in clinical diagnosis.
Keywords: magnetic nanoparticles, immunomagnetic reduction, C-reactive protein
Introduction
Biomarkers play a role in the functioning of pathogens, and are used as indicators of disease in the clinical setting. For example, when tissues are damaged during the course of infectious and noninfectious disease processes, cytokines are produced which induce overexpression of C-reactive protein (CRP) in the liver. Because CRP levels increase dramatically in the event of injury or infection, CRP levels have become key indicators of infectious/noninfectious disease and of acute conditions. Hence, quantitative immunoassay tests for CRP are important tools in clinical diagnosis.
At present, there are several quantitative methods used for CRP assay, including
biochemistry analysis, enzyme-linked immunosorbent assay,1–3 radioimmunoassay,4
immunoturbidimetry, and immunonephelometry.5 Although these assay methods are
widely used and popular in the clinical setting, they have several disadvantages. For instance, the radioimmunoassay raises the problem of radiological waste, the enzyme-linked immunosorbent assay involves complicated processes, such as unstable wash procedures, use of two different antibodies, absorption of fluorescent light by the samples, and immunoturbidimetry and immunonephelometry have serious interfer-ence from intrafat. These disadvantages motivated us to explore alternative assay methods for CRP.
Dove
press
O r I G I N A L r E S E A r C H
open access to scientific and medical research
Open Access Full Text Article
International Journal of Nanomedicine downloaded from https://www.dovepress.com/ by 118.70.13.36 on 23-Aug-2020
For personal use only.
Number of times this article has been viewed
This article was published in the following Dove Press journal: International Journal of Nanomedicine
One promising assay method using magnetic nanopar-ticles is the so-called magnetically labeled immunoassay. It has been shown technically that the magnetically labeled
immunoassay has the merits of high sensitivity,6 versatile
diagnostic methods,6–9 convenient processes,7,8 and high
accuracy for detecting biomarkers, and could potentially be used in the clinical setting. In fact, magnetic particles have been used in cell sorting for the detection of human
leukocyte antigen B27,10 and it has been shown that the
per-formance of magnetic cell sorting is much better than that of flow cytometry. In order to take advantage of magnetic
nanoparticles in clinical molecular assays, Fe3O4 magnetic
nanoparticles conjugated with anti-CRP antibody can be used as labeling markers for detecting CRP. Meanwhile, the
method referred to as immunomagnetic reduction (IMR),11,12
a type of magnetically labeled immunoassay, is utilized to detect and quantify CRP levels through reduction of magnetic signals due to the association between magnetic nanoparticles and CRP.
To characterize the IMR assay for CRP, the relationship between reduction in magnetic signals from a magnetic reagent and a known concentration of CRP was established. The results were compared with that of an immunoturbidi-metry assay. Further, to confirm the validity of IMR assay for clinical detection of serum CRP, multiple serum samples were used for the CRP assay via both IMR and immunotur-bidimetry assays. Thus, the correlation between assaying CRP using IMR (XacPro-E101, MagQu Co, Ltd, Sindian District, New Taipei City) and immunoturbidimetry (Cobas Integra 800, Roche) was clarified. In addition, interference by bilirubin, hemoglobin, and intrafat on CRP assay for serum samples using IMR was examined.
Materials and methods
Immunomagnetic reduction assay
The IMR assay is a method used to detect the concentration of biomolecules in a liquid sample by measuring reduction in the mixed-frequency alternative current (AC) magnetic susceptibility of magnetic reagent due to the association
between magnetic nanoparticles and biomarkers.11,12 To
achieve specific binding of magnetic nanoparticles onto CRP, anti-CRP is covalently coated onto magnetic nanoparticles, which are stably dispersed in phosphate-buffered solution (pH 7.2). Under the action of multiple AC magnetic fields, individual magnetic nanoparticles dispersed in a reagent rotate in response to applied AC magnetic fields. Because each magnetic nanoparticle possesses a magnetic moment,
the reagent exhibits AC magnetic susceptibility (χac) under
an external AC magnetic field. When a sample containing a biomarker, eg, CRP, as used in this study, is mixed with a magnetic reagent, magnetic nanoparticles in the reagent asso-ciate with CRP via the formation of immune complexes of CRP-anti-CRP magnetic nanoparticles, as schematically shown in Figure 1. The formation of immune complexes results in growth or clustering of the magnetic nanoparticles. Because larger or clustered magnetic nanoparticles are heavier or are confined physically, they cannot rotate in response to the applied AC magnetic fields, reducing the AC magnetic susceptibility of the magnetic reagent. Therefore, the concentration of CRP in the samples can be assayed by measuring the reduction in AC magnetic susceptibility of the magnetic reagent following addition of samples into the magnetic reagents.
Preparation of magnetic reagent
The magnetic reagent in this study was magnetic fluid
composed of biocompatible magnetic Fe3O4 nanoparticles
(MagQu Co, Ltd). The Fe3O4 nanoparticles were coated
with dextran, which served as a surfactant for Fe3O4 particles
dispersed in water. To achieve the association between CRP and magnetic nanoparticles, polyclonal goat anti-CRP (Sigma-Aldrich, St Louis, MO) was covalently bound onto
the dextran on the Fe3O4 particles.13 Through magnetic
sepa-ration, unbound anti-CRP was separated from the solution. The concentration of magnetic reagent was 0.1 emu/g in
terms of magnetism according to our preliminary work.14
Using dynamic light scattering, the average hydrodynamic diameter of our biofunctionalized anti-CRP magnetic par-ticles was 58 nm.
Anti-CRP
CRP
Magnetic nanoparticle
Figure 1 Scheme for the association between biomarkers (CrP) and magnetic nanoparticles coated with antibodies (anti-CrP). The magnetic nanoparticles become larger or clustered due to binding with biomarkers (CrP), as circled with the dashed line.
Abbreviation: CrP, C-reactive protein.
Dovepress Chang et al
International Journal of Nanomedicine downloaded from https://www.dovepress.com/ by 118.70.13.36 on 23-Aug-2020
Preparation of samples
Two types of samples were used for IMR measurement. The first type was a pure CRP solution (Sigma-Aldrich), prepared by spiking pure CRP into phosphate-buffered solution (pH 7.2). The second type was human serum.
IMr measurement
In this work, a magnetic immunoassay analyzer (XacPro-E101, MagQu Co, Ltd) was used to measure the reduction in AC magnetic susceptibility of the reagent after mixing
with the samples for detection. In the experiment, 40 µL of
magnetic reagent was mixed with 60 µL of serum or pure
CRP solution for IMR measurement. The AC magnetic susceptibility of the reagent before and after incubation of
the immune complexes is denoted by χac,o (or χac,φ), where
φ refers to the concentration of CRP in a sample. The IMR
signal was obtained via IMR = (χac,o – χac,φ)/χac,o× 100%.
Interference analysis
The interference materials used were bilirubin, hemoglobin, and intrafat (Denka Seiken Co, Ltd, Tokyo, Japan). The bilirubin was of two types, ie, one not conjugated with albumin (denoted as bilirubin-F), the other conjugated with albumin (denoted as bilirubin-C). All these interference materials were added sepa-rately to individual serum samples containing CRP. The origi-nal serum samples and those added with interference materials were used for IMR measurement of CRP concentration.
Results
CrP and anti-CrP magnetic nanoparticle
interaction reduces real-time
χ
acsignal
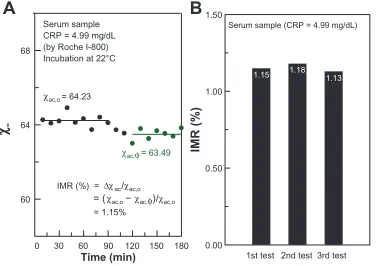
The interaction between antibody-conjugated magnetic par-ticles and CRP proteins can be clarified using the IMR assay, an example of which is seen in Figure 2A which shows the
A B
0 30 60 90 120 150 180
Time (min)
60 64 68
χac
Serum sample CRP = 4.99 mg/dL (by Roche I-800) Incubation at 22°C
χac,o = 64.23
χac,φ = 63.49
IMR (%) = ∆χac/χac,o
= (χac,o − χac,φ)/χac,o
= 1.15%
0.00 0.50 1.00 1.50
IMR (%
)
1st test 2nd test 3rd test Serum sample (CRP = 4.99 mg/dL)
1.15 1.18 1.13
Figure 2 Immunomagnetic reduction assay of CrP. (A) real-time χac signal of magnetic reagent after being mixed with 4.99 mg/dL CrP serum. (B) IMr signals for independent triple tests of 4.99 mg/dL CrP serum.
Abbreviations: CrP, C-reactive protein; IMr, immunomagnetic reduction.
time-dependent χac of IMR on CRP. In this case, the solution
to be detected is pure CRP, with a CRP concentration of 4.99 mg/dL, detected using immunoturbidimetry. Real-time
χac measurement was started just after mixing the pure CRP
solution and the magnetic reagent. At the start of χac
measure-ment, the χac signal of the mixture remained almost constant
(about 64.23). The χac signal dropped to another constant
(approximately 63.49) at around 120 minutes. The results shown in Figure 2A imply that the magnetic nanoparticles did not associate with CRP during the period from 0 to 90 minutes. From 90 to 110 minutes, the magnetic nanoparticles
were associating with CRP and the χac signal was
decreas-ing. At 120 minutes, the magnetic nanoparticles finished
associating with CRP and the χac signal remained stable. It
is noteworthy that measurements were made at room tem-perature and under an AC magnetic field. This indicates that incubation of immune complexes of CRP-anti-CRP magnetic particles was achieved at room temperature. The results also show that it takes at least 120 minutes for complete incuba-tion. Our recent results (not shown here) show that the assay time can be decreased to less than one hour by adjusting the concentration of the reagent and adding adequate detergent into the reagent. We believe the testing time could be reduced, hopefully to within 30 minutes, by adjusting such parameters as incubation temperature, concentration of the reagent, and the volume of the reagent and CRP solution. Furthermore, the IMR signal (χac- χac,φ)/χac,o, was found to be 1.15%. Three individual pure CRP solutions of the same concentration
(4.99 mg/dL) were used for the time-dependent χac
measure-ment. The IMR signals for these three tests are shown in
Figure 2B. We obtained an IMR signal of 1.15% ± 0.025%.
This results in the coefficient of variation being 2.16%.
IMr signal is correlated with CrP
concentration
Various concentrations of pure CRP protein were measured by IMR to establish the relationship between CRP concen-tration and IMR signals. The results are plotted with cross symbols in Figure 3. The IMR-CRP curve (solid line) in Figure 3 shows clearly that the IMR signal increases with increasing CRP concentration. Furthermore, the sensitivity of
IMR for CRP using pure CRP solution is 10-2–10-3 mg/dL.
The IMR signal for a given human serum sample was then detected. According to the IMR-CRP curve using pure CRP solutions, the concentration was determined to be 12.78 mg/dL. The human serum sample was then diluted with phosphate-buffered solution (pH 7.2) to various concentra-tions from 12.78 mg/dL to 0.0124 mg/dL. The IMR signals
Dovepress Immunomagnetic reduction assay for CrP
International Journal of Nanomedicine downloaded from https://www.dovepress.com/ by 118.70.13.36 on 23-Aug-2020
CRP (mg/dL)
Intensity (au)
0.80 1.20 1.60 2.00
IMR (%)
102
10−1
10−2
10−3
10−1 101
10−2
10−3
10
1
1 Roche cobas integra 800 Pure CRP solution Diluted serum
XacPro-E101 Pure CRP solution Diluted serum
Figure 3 Immunoturbidimetric intensity (dashed line) and IMr signal (solid line) as functions of CrP concentration in pure CrP solution (dot symbols) and diluted human serum (rhombus symbols).
Abbreviations: CrP, C-reactive protein; IMr, immunomagnetic reduction.
0.0 5.0 10.0 15.0 20.0 25.0 30.0 35.0 40.0
0.0 10.0 20.0 30.0 40.0 50.0
R2 = 0.94
(R = 0.97)
CRP* (mg/dL)
C
R
P
+
(m
g
/d
L
)
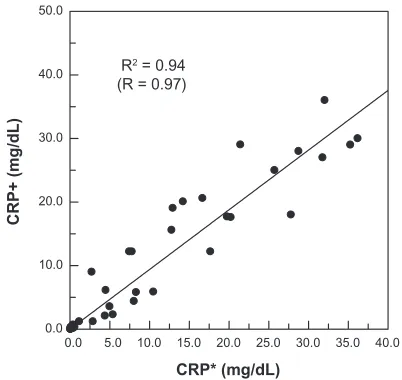
Figure 4 Correlation between CrP concentrations in human serum measured via IMr (denoted as CrP+) and immunoturbidimetry (denoted as CrP*).
Abbreviations: CrP, C-reactive protein; IMr, immunomagnetic reduction.
Table 1 Numbers in positive group and negative group detected via immunoturbidimetry and IMr
Immunoturbidimetry/ IMR
Positive Negative
Positive 26 1
Negative 1 12
Note: Criteria in CrP concentration to distinguish the positive group from the negative group is 0.5 mg/dL.
Abbreviations: CrP, C-reactive protein; IMr, immunomagnetic reduction.
from these diluted serum samples were measured and are plotted with rhombus symbols in Figure 3. It was found that the IMR signals for diluted serum lay in the IMR-CRP curve for pure CRP solutions, revealing good IMR assay consis-tency between the pure proteins and the serum samples.
In comparison with traditional CRP assays using immu-noturbidimetry, the results are plotted with the dashed line in Figure 4 for pure CRP solution (cross symbols) and diluted serum (rhombus symbols). The assay intensity shows little change for lower concentrations of CRP, followed by a monotonous increase in intensity for CRP concentrations higher than 0.01 mg/dL. This means that the sensitivity of
assaying CRP using immunoturbidimetry is 0.01–0.1 mg/dL. Notably, the signal intensity of the diluted serum sample of 0.01 mg/dL deviates from the dashed curve. This indicates that the reliability of immunoturbidimetry is suppressed for CRP serum samples of low concentration.
High correlation between
immunoturbidimetry and IMr in serum
CrP measurement
A further 40 human serum samples were used for IMR measurement. Using the standard curve (solid line) shown in Figure 3, the CRP concentration in serum samples could then be identified via IMR. The CRP concentration of each human serum sample was also detected by immunoturbidimetry. Thus, for a give serum sample, there were two CRP concen-trations, ie, one detected by immunoturbidimetry (referred to as CRP*), and another measured by IMR (referred to
as CRP+). To examine the correlation between CRP* and
CRP+, the CRP+ versus CRP* for these 40 serum samples is
shown in Figure 4. A highly positive correlation was found between CRP concentrations measured by immunoturbidi-metry and those measured by IMR. On further analysis, the correlation constant (R) was 0.97.
Because immunoturbidimetry is widely used in the clini-cal setting, the CRP concentrations of serum samples detected by immunoturbidimetry were regarded as reference values. Furthermore, in the clinic, the cutoff for CRP concentration is 0.5 mg/dL. Using this criterion, numbers in the positive
(CRP . 0.5 mg/dL) and negative (CRP , 0.5 mg/dL) ranges
via immunoturbidimetry and IMR are listed in Table 1, and show that the sensitivity and specificity values are 0.963 and 0.923, respectively, and the positive predictive and negative predictive values are 0.962 and 0.923.
Serum CrP tested by IMr not affected
by interference
Two serum samples containing a known CRP concentration were used for the interference assays. The samples were mixed with additional bilirubin-F, bilirubin-C, hemoglobin,
Dovepress Chang et al
International Journal of Nanomedicine downloaded from https://www.dovepress.com/ by 118.70.13.36 on 23-Aug-2020
and intrafat, at final concentrations of 16 mg/dL, 16 mg/dL, 0.24 mg/mL, and 50%, respectively. Triple IMR assays for CRP were performed for each sample. The CRP con-centration results detected by IMR are plotted in Figure 5. The CRP concentration in serum containing only CRP was
2.01 ± 0.06 mg/dL, and 2.12 ± 0.08 mg/dL for the sample
containing both CRP and bilirubin-F (Figure 5A). Using
an independent-sample t-test, the P value for the
differ-ence between these two sets of samples in Figure 5A is 0.13. The CRP concentrations detected via IMR for serum with CRP only and with both CRP and bilirubin-C were
1.19 ± 0.06 mg/dL and 1.24 ± 0.06 mg/dL, respectively,
as plotted in Figure 5B. This results in a P value of 0.35.
Comparison between CRP concentration in serum containing CRP only and that containing both CRP and hemoglobin/
intrafat are plotted in Figure 5C and D. The P values were
found to be 0.08 and 0.96 for the groups in Figure 5C
and D, respectively. It is worth noting that the P values for
the groups in Figure 5A–D are .0.05. This indicates that
bilirubin-F, bilirubin-C, hemoglobin, and intrafat do not affect the IMR assay for CRP in serum. The reason for this is that no more nonspecific interaction was observed after coating dextran onto the surface of the nanoparticles. The anti-CRP antibody was then conjugated onto dextran as the reagent for IMR. The IMR signal comes specifically from the interaction between CRP and its antibody, which also explains the consistent results using pure CRP or a serum sample for the samples tested in Figure 3. Further, the IMR signals are all around noise level (0.6%–0.7%) in the tests of solution only containing interference molecules (but no CRP) and the blank solution containing no CRP and no other interference as references (data not shown).
Discussion
There were some remarkable features on IMR assay for CRP in human serum. Firstly, the high sensitivity of the assay for CRP
(10-2–10-3 mg/dL) could be achieved using IMR because the
effective area for conjugation between CRP and anti-CRP was significantly enhanced using magnetic nanoparticles. In addi-tion, the biomarkers directly associated with the magnetic nano-particles, serving as marking labels. This resulted in not only a higher sensitivity but also a higher reliability for the assay.
Secondly, the results of the interference tests revealed that the contributions of bilirubin, hemoglobin, and intrafat in serum to the CRP assay via IMR were almost negligible. The advantage of high specificity using the IMR assay to detect CRP in serum is attributable to the sample color inde-pendence of IMR because magnetic signals were detected in IMR, instead of optical-related signals. In addition, in IMR, magnetic nanoparticles are driven to rotate with high-frequency AC magnetic fields. Biomarkers associated onto magnetic nanoparticles are subject to centrifugal force while the nanoparticles are rotating. The centrifugal force becomes stronger as the rotating frequency of the nanopar-ticles increases. In general, the binding force of nonspecific molecular association is weaker than that of specific molecu-lar association. Thus, at suitably higher rotating frequencies, the nonspecific binding between anti-CRP and bilirubin, hemoglobin, or intrafat is disrupted, whereas specific binding between anti-CRP and CRP is still effective. Therefore, high specificity is achieved for the IMR assay.
Thirdly, the correlation coefficient for CRP assay by IMR and immunoturbidimetry was found to be 0.97 using 40 human serum samples. Although the CRP assay results obtained with immunoturbidimetry were not 100% correct,
A B C D
φCR
P
(
µ
g/mL)
φCR
P
(
µ
g/mL)
φCR
P
(
µ
g/mL)
φCR
P
(
µ
g/mL)
UC Bilirubin + C Bilirubin
0.0 5.0 10.0 15.0 20.0 25.0
Hemoglobin Intrafat
CRP CRP CRP CRP CRP CRP CRP CRP
+ + +
P = 0.13
P = 0.35
P = 0.08 P = 0.99
0.0 5.0 10.0 15.0 20.0 25.0
0.0 5.0 10.0 15.0 20.0 25.0
0.0 5.0 10.0 15.0 20.0 25.0
Figure 5 Detected concentrations of CrP in serum with CrP only and other biomarkers (A) unconjugated bilirubin (UC bilirubin), (B) conjugated bilirubin (C bilirubin), (C) hemoglobin, and (D) intrafat via IMr.
Abbreviations: CrP, C-reactive protein; IMr, immunomagnetic reduction.
Dovepress Immunomagnetic reduction assay for CrP
International Journal of Nanomedicine downloaded from https://www.dovepress.com/ by 118.70.13.36 on 23-Aug-2020
International Journal of Nanomedicine
Publish your work in this journal
Submit your manuscript here: http://www.dovepress.com/international-journal-of-nanomedicine-journal
The International Journal of Nanomedicine is an international, peer-reviewed journal focusing on the application of nanotechnology in diagnostics, therapeutics, and drug delivery systems throughout the biomedical field. This journal is indexed on PubMed Central, MedLine, CAS, SciSearch®, Current Contents®/Clinical Medicine,
Journal Citation Reports/Science Edition, EMBase, Scopus and the Elsevier Bibliographic databases. The manuscript management system is completely online and includes a very quick and fair peer-review system, which is all easy to use. Visit http://www.dovepress.com/ testimonials.php to read real quotes from published authors.
these results are clinically significant. Using the assay results for CRP via immunoturbidimetry as references, both the clinical sensitivity and specificity of the IMR assay for CRP in 40 human serum samples were found to be higher than 0.9. These observations indicate that IMR has the same clinical significance as immunoturbidimetry.
Fourthly, from the operational point of view, IMR shows some important advantages, including being wash-free and dilution-free. For example, the unbound biomarkers and mag-netic nanoparticles do not necessarily have to be removed. The assay process for IMR is indeed wash-free and simple. Hence, IMR is more convenient to use than the conventional assay methods.
However, it seems to take a long time to complete each IMR assay for CRP. More effort needs to be made to speed up the incubation between biomarkers and magnetic nanoparticles biofunctionalized with antibodies, eg, by adding adequate deter-gents to the reagent, increasing the concentration of antibodies in the reagent, and raising the incubation temperature.
Conclusion
According to the curve for the IMR signal versus CRP concentration, the sensitivity in terms of concentration
is down to 10-2–10-3 mg/dL for the IMR assay. This
sensitivity is higher than that required by the clinical criteria (0.5 mg/dL) by almost one order of magnitude. Using detection of CRP concentration in 40 human serum samples, the assay results for IMR are highly comparable with those of immunoturbidimetry. It was also demonstrated that the interference caused by bilirubin, hemoglobin, and intrafat on the CRP assays is negligible via IMR. These results show the promising feasibility of assaying CRP in human serum using immunomagnetic reduction in the clinic.
Acknowledgment
This work was supported by the National Science Council of Taiwan (98-2323-B-003-001-CC2), the Department of Health (DOH98-TD-N-111-008), and the Ministry of Economic Affairs of Taiwan (1Z970688 and 1Z0990415 [SBIR] and S09800226-203 [JAID]).
Disclosure
The authors report no conflicts of interest in this work.
References
1. MacBeath G, Schreiber SL. Printing proteins as microarrays for
high-throughput function determination. Science. 2000;289:
1760–1763.
2. Templin MF, Stoll D, Schrenk M, et al. Protein microarray technology.
Drug Discov Today. 2002;7:815–822.
3. Zhou H, Bouwman K, Schotanus M, et al. Two-color, rolling-circle amplification on antibody microarrays for sensitive, multiplexed
serum-protein measurements. Genome Biol. 2004;5:R28.
4. Yalow RS, Berson SA. Assay of plasma insulin in human subjects by
immunological methods. Nature. 1959;184 Suppl 21:1648–1649.
5. Yang SY, Wu RM, Jian ZF, et al. One-sample measurement in laser
nephelometric immunoassay using magnetic nanoparticles. Appl
Phys Lett. 2006:89. http://apl.aip.org/resource/1/applab/v89/i24/ p244102_s1?isAuthorized=no
6. Enpuku K, Kuroda D, Ohba A, et al. Biological immunoassay utilizing magnetic marker and high Tc superconducting quantum interference
device magnetometer. Jpn J Appl Phys. Part 2:Letters. 2003:42. http://
jjap.jsap.jp/link?JJAP/42/L1436
7. Kotitz R, Weitschies W, Trahms L, et al. Determination of the binding reaction between avidin and biotin by relaxation measurements
of magnetic nanoparticles. J Magn Magn Mater. 1999;194:
62–68. http://www.sciencedirect.com/science/ar ticle/pii/ S0304885398005800
8. Lee S, Myers WR, Grossman HL, et al. Magnetic gradiometer based on a high-transition temperature superconducting quantum
inter-ference device for improved sensitivity of a biosensor. Appl Phys
Lett. 2002; 81:3094. http://apl.aip.org/resource/1/applab/v81/i16/
p3094_s1?isAuthorized=no
9. Horng HE, Yang SY, Huang YW, et al. Nanomagnetic particles for
SQUID-based magnetically labeled immunoassay. IEEE Trans Appl
Supercond. 2005;15:668–671.
10. Chou CT, Tsai YF, Liu J, et al. The detection of the HLA-B27 antigen by immunomagnetic separation and enzyme-linked immunosorbent
assay-comparison with a flow cytometric procedure. J Immunol Methods.
2001;255:15–22.
11. Hong CY, Wu CC, Chiu YC, et al. Magnetic susceptibility
reduc-tion method for magnetically labeled immunoassay. Appl Phys Lett.
2006;88: 212512–212513. http://apl.aip.org/resource/1/applab/v88/ i21/p212512_s1?isAuthorized=no
12. Yang SY, Chieh JJ, Wang WC, et al. Ultra-highly sensitive and wash-free bio-detection of H5N1 virus by immunomagnetic reduction assays.
J Virol Methods. 2008;153:250–252.
13. Yang SY, Jian ZF, Horng HE, et al. Dual immobilization and magnetic
manipulation of magnetic nanoparticles. J Magn Magn Mater. 2008;
320:2688–2691.
14. Yang SY, Yang CC, Horng HE, et al. Experimental study on low-detection limit for immunomagnetic reduction assays by manipulating
reagent entities. IEEE Trans Nanobioscience. 2012. Accepted. http://
ieeexplore.ieee.org/xpl/RecentIssue.jsp?punumber=7728
Dovepress
Dove
press
Chang et al
International Journal of Nanomedicine downloaded from https://www.dovepress.com/ by 118.70.13.36 on 23-Aug-2020