Zero time tunneling: macroscopic experiments with virtual
par-ticles
Günter Nimtz1,aand Horst Aichmann2
1II. Physik. Institut, Universität zu Köln 50937 Köln, Zülpicherstr. 77 2KWF Schwalheim, 61231 Bad Nauheim, Zur Bitz 1
Abstract.Feynman introduced virtual particles in his diagrams as intermediate states of an interaction process. They represent necessary intermediate states between observable real states. Such virtual particles were introduced to describe the interaction process be-tween an electron and a positron and for much more complicated interaction processes. Other candidates for virtual particles are evanescent modes in optics and in elastic fields. Evanescent modes have a purely imaginary wave number, they represent the mathemati-cal analogy of the tunneling solutions of the Schrödinger equation. Evanescent modes ex-ist in the forbidden frequency bands of a photonic lattice and in undersized wave guides, for instance. The most prominent example for the occurrence of evanescent modes is the frustrated total internal reflection (FTIR) at double prisms. Evanescent modes and tun-neling lie outside the bounds of the special theory of relativity. They can cause faster than light (FTL) signal velocities. We present examples of the quantum mechanical behavior of evanescent photons and phonons at a macroscopic scale. The evanescent modes of photons are described by virtual particles as predicted by former QED calculations.
1 Introduction
The non classical process of tunneling was solved nearly a hundred years ago. There were two stim-uli at that time: The inversion motion of ammonium molecules in chemistry and the radioactivity in physics. It was explained that a particle, i.e. a wave packet can penetrate a barrier, today this process is called tunneling. Around 1960 tunneling was observed in solid state physics: The tunneling of elec-trons through thin insulating films sandwiched by metals and the electron tunneling in semiconductor pn junctions between the conduction and the valence bands, the Esaki diode. Several theoreticians began to calculate the barrier transmission time, which was not measurable for technical reasons at that time. One of the first extensive approaches to calculate a transmission time was carried out by Hartman 1962 [1]. He calculated the transmission time of Gaussian pulses through a rectangular sym-metric barrier. His calculations are based on the Schrödinger equation and the Wigner phase time. The calculations of Hartman were confirmed by Refs.[2–6, 11], for example. However, as discussed below there are many opposing studies. The tunneling process shows a short interaction time at the barrier front (the same time is measured for reflection and transmission) and a zero time inside the barrier. This result was obtained for opaque barriers (opaque means thatκx, ≥1, whereκ is the imaginary
ae-mail: [email protected] C
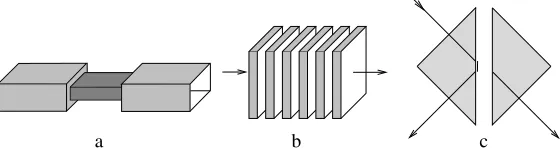
wave number of the solution inside the barrier and x the barrier length). In this case the traversal time is constant independent of barrier length and consequently the group velocity becomes proportional to the barrier length. Thus the superluminal (FTL) transmission velocity increases with barrier length. This strange behavior is called the Hartman effect, which was confirmed in several experiments. As mentioned above, in the sixties the technical facilities for measuring a short tunneling time were not available. Experimental problems in solid state devices are parasitic time contributions, which may dominate a measured time. On the other hand the Helmholtz equation equals the Schrödinger equation and their evanescent modes correspond to the Schrödinger tunneling solutions. Therefore tunneling analog experiments were performed with various experimental set-ups as shown in Fig.1 around 1990. Sommerfeld referred the double prisms as the optical analog to the wave mechanical tunneling. The κdispersion relation of the double prisms is given by:
E(x) = E(x=0)e(iωt−κx) (1)
κ = [ω
2
c2((
n1
n2
)2sin2θ)−1)]1/2, (2)
whereθ is the angle of the incident beam (larger than the angle of total reflection),E(x = 0) the amplitude of the electric field at the barrier front,n1andn2are the refractive indexes of the prism and the gap material, and (n1/n2) sinθ >1 holds in the case of total reflection.ωis the angular frequency,
tthe time,xthe distance of the prisms , andκthe imaginary wave number of the tunneling mode.
b
a c
Figure 1.Sketch of three photonic barriers. a) illustrates an undersized wave guide (the central part of the wave guide has a cross section being smaller than half the wavelength in both directions perpendicular to propagation), b) a 1-dimensional photonic lattice (periodic dielectric hetero structure), and c) the frustrated total internal re-flection of a double prism, where total rere-flection takes place at the boundary from a denser (the first prism with refractive indexn1) to a less dense dielectric medium (with refractive indexn2). Frustrated total reflection means
that a small part of the incident beam is transmitted through the forbidden gap (the potential barrier)to the second prism.
The analog equation of wave optics to wave mechanics is the Helmholtz equation:
Δ2Φ(x)+n2ω2/(c2)Φ = 0, (3)
whereΦrepresents the field, n the refractive index of the medium,ωthe angular frequency of the wave. The Schrödinger equation is given by:
Δ2Ψ(x)+2m/(2)E−U(x)Ψ = 0, (4)
Figure 2. Measured propagation time of three digital signals [19]. (a) Pulse trace 1 was recorded in vacuum. Pulse 2 traversed superluminal a photonic lattice in the center of the frequency band gap (see part (b) of the figure), and pulse 3 was traveled subluminal through the fiber lattice outside its forbidden band gap. (b) Presents the transmission vs frequency (around the carrier frequency) of the dielectric lattice. The superluminal signal 2 has a frequency band width of about 1 GHz positioned in the transmission minimum, the infrared carrier frequency is about 2·1014Hz. The photonic lattice was a periodic dielectric hetero-structure fiber as sketched in
Fig.1 (b).
same symmetry properties. The experimental data we are talking about, were reproduced in different laboratories, and they are in agreement with the Helmholtz and the Schrödinger equations and with the Wigner phase time approach. The Wigner phase (shift) time was introduced in order to obtain the interaction time of particles. Here this time re presents the interaction time of the particles with a potential barrier. This time equals also the group delay time:
τgr = dϕ/dE = dϕ/dω (5)
whereϕrepresents the phase shift due to the barrier interaction process.
2 Results
The first superluminal analog experiments were carried out with microwaves of 3 cm wavelength in undersized waveguides in 1992 Ref.[7]. A superluminal signal velocity of 2.2 c was measured, where c is the vacuum velocity of light. Later a periodic dielectric lattice structure was superluminal tunneled with infrared single photons Ref.[8]. Further experiments resulted also in FTL velocities with similar set-ups. The results of the measured tunneling time are shown in the table. Remarkably, an empirical universal tunneling timeτ≈1/νwas found independent of field, whereνis the wave packet’s frequency. This result was later theoretically proved in Refs.[10, 11].
all experiments, only the group maximum could travel FTL, the front velocity would always luminal, see for instance Ref.[15]. The calculation of the luminal front velocity was based on infinite frequency components even in the case of single photons. The front velocity is defined by
vf r(ω) = ωlim
→∞ω/k, (6)
whereωis the angular frequency and k the wave number. The explanation for the calculated luminal front velocity is that the signal energy would be much higher than the barrier. Such front velocities are not physical. According to quantum mechanics this front velocity should have an infinite energy in order to exist, i.e. to be measurable. All physical signals don’t have a front velocity of infinite frequency. Only the group velocity and signal velocity (and thus the energy) are measurable. All textbooks and articles, which deny the possibility of superluminal signal velocities in the tunneling process are assuming an infinite frequency band width of the signal.
A novel model of tunneling was introduced in the review Ref.[31, 32]. According to this model tunneling barriers are cavities and the observed transmitted output has no causal connection with the input. This model does not explain the application of the tunneling process in fiber optics, for example as signal coupler, where the signals are causal transmitted. This model explains transmission time and reflection time as the decay time of the cavity.
Table: Tunneling time Exper. 1/ν
photonic barriers reference τ T =1/ν
frustrated 5 117 ps 120 ps
total reflection 7 ≈87 ps 100 ps
photonic lattice 3 2.13 fs 2.34 fs
8 2.7 fs 2.7 fs
18 81 ps 115 ps
undersized 2 130 ps 115 ps
waveguide
electron tunneling field 19 6 - 8 fs >2.43 fs
electron ionization tunneling 20 ≤6 as 0?
acoustic (phonon) tunneling 21 0.6 - 1μs 1μs
22 0.9 ms 1.12 ms
3 Signals
different frequency components of the signal. For instance, a weak deformation is seen between trace 1 and trace 3 in Fig.2(a).
For wave packets and signals the relation
Δν·Δt≥1, (7)
holds, whereΔνandΔtarethan∞. Actually, relation 7 is proportional to the information content of a signal as was shown by Shannon [16]. This fact represents the basis of all information transport in modern IT devices. Misleading interpretations are given for the superluminal experiments in the articles of Refs.[8, 14, 15, 17], for example. It is claimed that the front velocity of all the apparently measured superluminal signals and also of the superluminal single photons was luminal. A sketch of the latter interpretation is displayed in Fig.3.
Figure 3. Propagation of an ensemble of single tunneling photons as a tortoise. The single photons are well separated in the measured ensemble. Assuming a luminal front velocity the small tunneled and the vacuum traveled ensemble, only the center of the ensemble - it has the same FDHM signal (full duration at half maximum) as the input ensemble - and thus the group was FTL. The measured FTL velocity of the arrow was declared as the group velocity of the single photons and a fictitious luminal front velocity was shown in the sketch of Ref.[17].
4 Causality
t
x t´ x´
B
A
v=4c x=ct
v =0.75cr
L -1s v =2c´
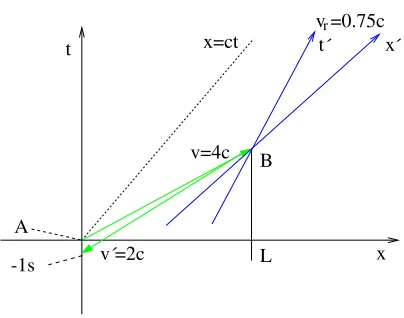
Figure 4.Coordinates of two inertial observersA(0,0) andBwithO(x,t) andO(x,t) moving with a relative velocity of 0.75·c. The distanceLbetweenAandBis 2 000 000 km.Amakes use of a signal velocityvs=4·c andBmakes use ofvs=2·c( in the sketch isv≡vs). The numbers in the example are chosen arbitrarily. The signal returns -1 s in the past inA.
The time shift of a point on the time axis of reference systemAinto the past is given by the relation [12, 13, 30]
tA =−L c·
(vr−c2/vs−c2/vs+c2vr/vsvs)
(c−cvr/vs)
, (8)
whereLis the transmission length of the signal,vr is the velocity between the two inertial systems AandB. The condition for the change of chronological order istA <0, the time shift between the
systemsAandB. This interpretation assumes, however, a signal to be a point in the time dimension neglecting its temporal width.
Several tunneling experiments have revealed superluminal signal velocity in tunneling photonic barriers [10, 19]. Nevertheless, the principle of causality has not been violated as will be explained in the following.
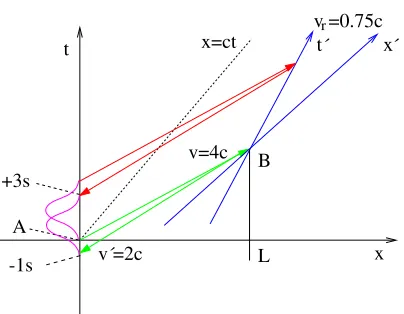
In the example with the lottery data, the signal was assumed to be a point in space-time. However, a physical signal has a finite duration like the pulses sketched along the time axis in Fig. 5. The general relationship for the bandwidth-time interval product of a signal, i.e. a packet of oscillations is given by Eq. 7. A zero time duration of a signal would require an infinite frequency bandwidth. Taking into consideration the dispersion of the transmission of tunneling barriers, the frequency band of a signal has to be narrow in order to avoid non-superluminal frequency components and thus a signal reshaping.
Assuming a signal duration of 4 s the complete information is obtained with superluminal signal velocity at 3 s in positive time as illustrated in Fig. 5. The compulsory finite duration of all signals is the reason that a superluminal velocity does not violate the principle of causality. A shorter signal with the same information content would have an equivalently broader frequency bandwidth (Eq. 7). That means an increase ofvsorvscan not violate the principle of causality. For instance, the
t
x t´ x´
L B
A
v=4c x=ct
v =0.75cr
-1s +3s
v =2c´
Figure 5. In contrast to Fig. 4 the pulse-like signal has now a finite duration of 4 s. This data is used for a clear demonstration of the effect. In all superluminal experiments, the signal length is long compared with the measured negative time shift. In this sketch the signal envelope ends in the future with 3 s (in the sketch isv≡vs).
However, with increasingvsthe bandwidthΔν(that is the tolerated imaginary wave number widthΔκ)
of the signal decreases∝1/d in order to guarantee the same amplitude distribution of all frequency components of the signal. In spite of an increasing superluminal signal velocityvs→ ∞the general
causality can not be violated because the signal time duration increases analogouslyΔt→ ∞(Eq. 7).
5 Virtual Particles
Figure 6.Minkowski diagram of the real and virtual photons in frustrated total internal reflection [10].
6 Summing-up
Superluminal signals have been measured in different tunneling experiments. However, a time ma-chine is not possible. It was shown that a signal may begin in the past, but it always ends in the future due to its finite time duration [12–14]. Physical signals are defined by the product of a finite time duration and a finite frequency bandwidth. Evanescent and tunneling modes are virtual particles. They are observed in electromagnetic, elastic fields, and they appear also at macroscopic extensions. Remarkably, wave packets display a universal tunneling time for all fields. Zero tunneling time was claimed to have been observed in the case of tunneling electron ionization in Ref.[27]. The tunneling process seems to represent an exception of special theory of relativity.
Acknowledgement
Thanks to Friedrich Wilhelm Hehl, for his continuous support, discussions and pushing me.
References
[1] T. Hartmann, Appl. Phys.33, 3427 (1962) [2] L. McColl, Phys. Rev.40, 621 (1932)
[3] S. Collins,D. Lowe, J. Barker, J. Phys. C20, 6213 (1987) [4] F. Low and P. Mende, Ann. Phys. NY210, 380 (1991) [5] J. Deutsch and F Low, Ann. Phys. NY,228, 1 (1993) [6] F. Low, Ann. Phys. (Leipzig),7-8, 660 (1998)
[7] A. Enders and G. Nimtz, J. Phys.I(France)2, 1693 (1992)
[8] A. Steinberg, P. Kwiat and R. Chiao, Phys. Rev. Lett.71, 708 (1993) [9] G. Nimtz, Found. Phys.41, 1193 (2011)
[13] G. Nimtz, Lect. Notes. Phys.702, 506 (2006)
[14] H. Aichmann and G. Nimtz, Found. Phys.44, 678 (2014)
[15] R. Chiao and A. Steinberg, Progress in Optics,XXXVII, 345 (1997) [16] C. Shannon, Bell Sys. Tech.27, 379 and 723 (1948)
[17] R. Chiao, P. Kwiat and A. Steinberg, Scientific American, August, 38, (1993)
[18] H. Aichmann, G. Nimtz and H. Spieker, Verhandlungen der Deutschen Physikalischen Gesellschaft7, 1258 (1995)
[19] S. Longhi, M. Marano, P. Laporta and M. Belmonte, Phys. Rev. E64, 055602 (2001) [20] C. Carniglia and L. Mandel, Phys. Rev. D3, 280 (1971)
[21] T. S. Ali, Phys. Rev. D7, 1668 (1973)
[22] A. Haibel and G. Nimtz, Ann. Phys. (Leipzig)10, 707 (2001)
[23] D. Mugnai, A. Ranfagni and L. Ronchi, Phys. Lett. A247, 781 (1998)
[24] C. Spielmann, R. Szipocs, A. Stingl and F. Krausz, Phys. Rev. Lett.73, 2308 (1994) [25] G. Nimtz, H. Spieker and A. Enders, J. Phys. I France,4,565 (1994)
[26] S. Sekatskiiand V. Letokhov, Phys. Rev. B64, 233311 (2000) [27] P. Eckle et al., Science322, 1525 (2008)
[28] S. Yang et al., Phys. Rev. Lett.88, 104301 (2002)
[29] W. Robertson, J. Ash and M. McGaugh, Am. J. Phys.70, 689 (2002) [30] R.Sexl and K. Urbantke, Relativity, Groups, Particles. Springer, Wien (2001) [31] H. Winful, Phys. Rev.Lett.90, 023901 (2003)
![Figure 2. Measured propagation time of three digital signals [19]. (a) Pulse trace 1 was recorded in vacuum.Pulse 2 traversed superluminal a photonic lattice in the center of the frequency band gap (see part (b) of thefigure), and pulse 3 was traveled sublu](https://thumb-us.123doks.com/thumbv2/123dok_us/8174363.1365116/3.482.100.386.68.204/measured-propagation-traversed-superluminal-photonic-frequency-thegure-traveled.webp)

![Figure 6. Minkowski diagram of the real and virtual photons in frustrated total internal reflection [10].](https://thumb-us.123doks.com/thumbv2/123dok_us/8174363.1365116/8.482.140.342.72.229/figure-minkowski-diagram-virtual-photons-frustrated-internal-reection.webp)
