To the problem of the secondary CMB anisotropy separation
Oleg Verkhodanov1,, Dmitrij Solovyov2,, Elena Majorova1,, and Margarita Khabibullina1,
1Special Astrophysical Observatory, Russian Academy of Sciences, Nizhnii Arkhyz, 369167 Russia 2St. Petersburg Branch of the Special Astrophysical Observatory of the Russian Academy of Sciences,
St.Petersburg, Russia 196140
Abstract.We study contribution to the secondary anisotropy maps of cosmic microwave
background (CMB) radiation which difficult to account for faint sources. Two effects are investigated. They are the Sunyaev–Zeldovich effect connected with the inverse Compton scattering of CMB photons on hot electrons of cluster of galaxies, and contamination of the background by weak extragalctic sources. First, we study fields of the Planck CMB maps around radio sources of the RATAN-600 catalog. We see weak microwave sources which make an additional contribution to the secondary anisotropy on angular small scales (< 7). An algorithm for selecting candidate objects with the Sunyaev– Zeldovich effect was proposed, based on the use of data on the radio spectral indices and the signal in cosmic-microwave background maps. Second, applying the stacking method, we examine the areas of the CMB maps, constructed according to the Planck Space Observatory data in the neighborhood of different populations of radio sources and giant elliptical galaxies. The samples of objects include giant radio galaxies (GRG), radio sources, selected by the radio spectral index and redshift, as well as the gamma-ray bursts, used as a secondary comparative sample. The signal from this objects exists on CMB maps and its difference in the neighborhood of GRGs from the other types of objects was discovered.
1 Introduction
Publishing of the microwave maps restored from the millimeter and submillimeter observations of the
NASA WMAP1(Wilkinson Microwave Anisotropy Probe) [1] and ESA Planck2[2] opened a new era
in the research of the extended foreground emission and the extragalactic sources. The key role in last five years was played by the Planck Space Observatory and the full sky maps which were constructed based on the results of its work at nine frequencies of the microwave range: 30, 44, 70, 100, 143, 217, 353, 545, and 847 GHz. The maps of the Planck satellite of the European Space Agency were opened to the scientific community in 2013 (and the second release in 2015) and at once became an
e-mail: [email protected] e-mail: [email protected] e-mail: [email protected] e-mail: [email protected]
1http://lambda.gsfc.nasa.gov
effective means for solving many problems of galactic and extragalactic astronomy. Moreover, the catalogs of the discovered galactic and extragalactic sources of the millimeter and submillimeter ra-diation were presented in the first data release. The measurements of rara-diation fluxes were conducted using the High Frequency Instrument (HFI) with frequency bands of 100 GHz and higher, and the Low Frequency Instrument (LFI) with frequency bands lower than 100 GHz. The resolution of the maps at frequencies higher than 100 GHz amounted to about 5. Although the Planck mission is sec-ondary (by the launch date) relative to the other space mission, WMAP, it has better observational characteristics, which allow scientists to use it for search and investigation of weak radio sources in themicrowave range. Among the most important astrophysical products of the Planck mission, we can mention (1) table of cosmological parameters; (2) cosmic microwave background (CMB) radia-tion maps; (3) channel data maps (temperature anisotropy and polarizaradia-tion); (4) foregrounds maps; (5) secondary anisotropy maps; and (6) catalogs of millimeter and submillimeter sources. Among the advantageous features of Planck in comparison with the WMAP, let us note the higher resolution (three times higher), higher response (ten times higher), and nine frequency bands, which allowed the radiation components to be separated. The Planck Legacy Archive3(PLA) contains both the maps
of radiation components and the lists of the detected objects. PLA contains the data base of sets of maps and we mention some of them below. First, four CMB maps of cosmic microwave background (CMB) radiation restored by 4 component separation methods, respectively. They are (a) internal linear combination in spherical wavelets domain — needlets (NILC), (b) template fitting using data at different frequencies to estimate by the expectation maximazation algorithm (Spectral Estimation Via Expectation Maximazation — SEVEM), (c) the method realized in the sperical harmonic domain of amplitude matching of the CMB spectral parameters and background components (Spectral Matching Independent Component Analysis — SMICA), and (d) the Bayesian separation of components in the pixel space by matching a parametric model (Commander).
The second group of PLA contains sky maps at observational bands at 30, 44, 70, 100, 143, 217, 353,545, 857 GHz, where channels from 30 to 353 GHz include the Q,U-polarization data too. The 3d group of maps are sky maps of diffent foregrounds, e.g. CO emission maps, dust, galactic low frequency emission (synchrotron plus free-free), zodiac light maps, etc. Also, there are maps of gravitational lensing, y-comptonization maps, and separately, masks used for restored different CMB temperature and polarization maps.
2 Secondary anisotropy maps
There exist several basic effects which acted on the CMB fluctuations and can be discussed in terms of the secondary anistropy. Among them are the intergated Sachs-Wolfe effect [3], the Sunyaev-Zeldovich effect [4], reionization, gravitational lensing of CMB, contamination of microwave back-ground with extragalactic radio sources. The Planck observatory produced some secondary anisotropy maps for the astronomical community use. In Figures 1 and 2 are shown the Wiener-filtered lensing potential distribution on the sky [5] and the reconstructed the Planck all-sky y-map in Compton pa-rameter units [6], respectively.
ex-Figure 1. The Wiener-filtered lensing potential estimate with minimal masking (using the NILC component separated map). From [5].
Figure 2. The orthographic projection of the reconstructed Planck all-sky y-map in Compton parameter units.
Positive sources in the map correspond to clusters and super-clusters of galaxies with strong tSZ emission. The Coma and Virgo clusters are clearly visible near the north Galactic pole. The region of strongest contamination from Galactic foreground emission in the Galactic plane has been partially masked. From [6].
Figure 4.Positions of RCR radio sources on a CMB map (the range of coordinates is 7h<RA<17h, Dec∼5◦).
3 RCR-sources on the Planck maps
One of the main problems of the sensitive radio surveys data analysis is the presence of faint sources at the noise level (S/N 3) which make additional contribution to the angular power spectrum at small angular scales (high multipoles). This situation is also observed in Planck CMB maps when we consider a signal at >2000. Another problem arose for the Planck data is the missed clusters of galaxies which are observed with the Sunayev–Zeldovich effect at multifrequency maps. Number of expected SZ-sources contributed to the secondary anistropy was larger than 20000 (expected number of clusters of galaxies), but the presented catalog contains 1653 objects [8].
We use the RCR (RATAN Cold Refined) catalog [9, 10] to look for any response from RC-source direction in millimeter and submillimeter wave length ranges. The RC catalog was obtained during the Cold experiment [9] conducted on the RATAN-600 radio telescope in the 1980s at 3.94 GHz. The horizontal and vertical resolutions 60 and, 15, respectively. To improve the coordinates and flux densities of the RC catalog sources, seven additional cycles of observations were carried out in the strip of sky corresponding to the Cold survey at several frequencies in 1987–1999, and the data obtained in 1980–1981 were reprocessed for right ascensions 7h <RA < 17h and declination Dec∼5◦(Fig. 4). This yielded a list of 551 objects identified with objects in the NVSS catalog with a positional accuracy of∼0.1. The limiting sensitivity in the RCR catalog was∼10 mJy.
Using properties of the CMB signal in the fields of RCR-sources, we prepared some diagrams to explore contamination of the background [11]. Figure 5 shows a plot of radio spectral indexαversus
CMB responseTp corresponding to the thermodynamical temperature on the Planck CMB SMICA
map. Note that theα−Tpdiagram is interesting in that we can distinguish groups of radio sources
-2 -1 0 1 2 Radio spectral index
-0,2 -0,1 0 0,1 0,2 0,3
CMB temperature fluctuation, mK
A B
C
D
Figure 5. Plot of radio spectral index vs. CMB signal for all the RCR catalog sources. The CMB signals are
given in thermodynamical units. The circles mark four groups of objects (A, B, C, D) corresponding to peaks in the histograms and discussed in the text.
Figure 6.CMB SMICA map for the 2015 Planck data release used in this study for our analysis of the distribution
of the CMB fluctuation signal. The low-order multipoles (≤20, i.e., the signal on angular scales larger than 8◦, which mainly includes the statistically anisotropic background) were first removed
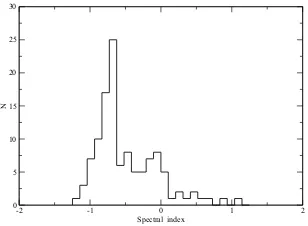
-2 -1 0 1 2 Spectral index
0 5 10 15 20 25 30
N
Figure 8. Left to right: CMB maps for the RCR sources falling in group A (Fig. 5) at 44, 70, 100, 143, 217, 353, and 545 GHz, respectively, according to the 2015 Planck data. For the S–Z effect at the Planck frequencies, a dip atν <217 GHz and a positive peak atν >217 GHz are expected. From top to bottom: the radio sources 092445+050344, 112437+045618, and 151054+045410. The size of the images is 0.5◦×0.5◦.
described. The main values of the signal in the CMB map are concentrated near zero, but from the positive side: the median CMB signal calculated using the data for all the studied sample sources is
+0.02527 mK.
Field A in Fig. 5, which corresponds to radio sources with negative responses exceeding the ex-pected 1σlevel and having extreme slopes in their radio spectra,α= 0.6−0.8. The relatively low negative level of the background on the CMB map could be due to an additional contribution to the in-homogeneity of the Sunyaev-Zeldovich effect, enhanced during the separation of the components and reconstruction of the CMB signal. This effect is also suggested by the existence of a radio source in this region, which is a sign of an accumulation of material (ultimately a cluster of galaxies). Figure 8 presents the maps of three RCR sources from field A at various frequencies as example candidates for objects displaying the Sunyaev-Zeldovich effect.
4 Response from radio galaxies on the Planck microwave maps
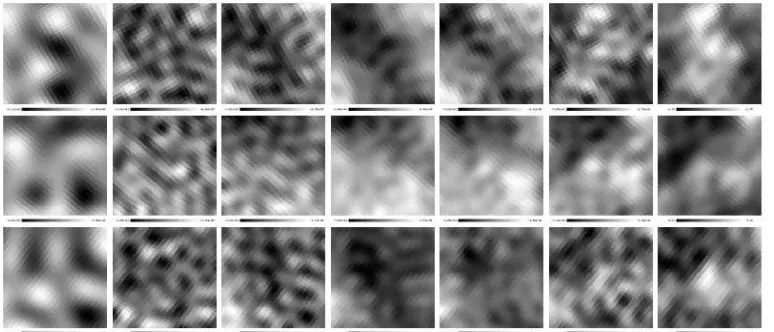
Figure 9. The stacking zones sized 1◦×1◦ built from the CMB SMICA Planck 2.02 map data. From left to right and from top to bottom are presented the images of the average maps for the object populations (the number of sample objects is marked in the brackets): (a) GRGs with the angular sizes ofθ > 4 and linear sizes of
>1 Mpc (89), (b) the gE and CD galaxy types (25), (c) the radio sources (RS) from the WENSS survey with the radio spectral indicesα <−1.1 (224), (d) WENSS RS with−1.1≤α <−0.75 (661), (e) WENSS RS with
−0.75≤α <−0.5 (497), (f) WENSS RS with−0.5≤α <0 (238), (g) WENSS RS withα≥0 (19), (h) distant
RG with the redshifts 0.3≤z <0.7 (1797), (i) HZRG with 0.7≤z<1.0 (205), (j) HZRG with 1.0≤z<1.5 (149), (k) HZRG with 1.5≤z<2.0 (103), (k) HZRG with 2.0≤z<2.5 (77), (l) HZRG withz≥2.5 (81), (n) the BATSE events with the duration oft<2s (495), (o) BATSE,t>2s (1540), (p) BeppoSAX,t<2s (87), (q) BeppoSAX,t>2 s (694). The original CMB data are given in the scale of thermodynamic temperatures.
CMB signal in the neighborhood of the average object of the population, namely, we searched for the presence of the maxima and minima in the average area (Fig. 9). The difference of the signal in the neighborhood of GRGs from the other types of objects was discovered.
5 Summary
• There is a positive signal for objects of different radio galaxy popultaion;
• It is possible to increase the number of SZ-objects for several times using searching fields around radio sources;
• There is a positive response in the zone of radio sources which number should be tens time larger than Planck source list;
• All objects are detected within 7 zones, thus they do not affect theC() power spectrum at low and intermediate ( <2000) multipoles.
For an average GRG in the microwave range, the area around which is built by stacking, it was found that 1) there is a positive signal in the millimeter range; 2) the spectrum in the millimeter range is flat; 3) the signal in the submillimeter range is absent; 4) the topological properties in the average CMB fluctuations map possess special features: a weak insignificant maximum (< 1σ) is located in the minimum zone; 5) a significant SZ–effect, related with the scattering of CMB photons by the electrons of the GRG jet plasma [18] is not observed. A comparison with other populations of objects has revealed that given the average microwave properties, the distant radio galaxies with redshift ranges 0.3≤z<0.7.
Acknowledgments. We thank the European Space Agency for their open access to the observations and data in the Planck Legacy Archive. We have used the GLESP package [19] for the analysis of extended emission on a sphere.
References
[1] C.L. Bennett, D. Larson, J.L. Weiland, et al.,Astrophys. J. Suppl.208, 20 (2013). [2] Planck Collaboration, Astrophys. Astrophys. accepted; arXiv:1502.01582. [3] R. K. Sachs and A. M. Wolfe, ApJ147, 73 (1967).
[4] Ya. B. Zeldovich and R. A. Sunyaev, Astrophys. Sp. Sci.4, 301 (1969). [5] Planck Collaboration, Astron. Astrophys. accepted; arXiv:1502.01591. [6] Planck Collaboration, Astrophys. Astrophys. accepted; arXiv:1502.01596. [7] Planck Collaboration Astron. Astrophys. accepted; arXiv:1507.02058. [8] Planck Collaboration Astron. Astrophys. accepted; arXiv:1502.01598
[9] Yu. N. Parijskij, N. N. Bursov, N. M. Lipovka, et al., Astron. Astrophys. Supp.87, 1 (1991). [10] O. P. Zhelenkova, N. S. Soboleva, E. K. Majorova, and A. V. Temirova, Astrophys. Bull. 68, 26
(2013).
[11] O.V.Verkhodanov, E.K.Maiorova, O.P.Zhelenkova, et al., Astronomy Reports60, 630 (2016). [12] P. D. Naselsky, P. R. Christensen, P. Coles, et al., Astrophys. Bull.65, 101 (2010).
[13] O.V. Verkhodanov, D.I. Solovyov, O.S. Ulakhovich, and M.L. Khabibullina. Astrophys. Bull. 71, 139 (2016).
[14] M. L. Khabibullina and O. V.Verkhodanov, Astrophys. Bull.64, 123 (2009).
[15] S. A. Stanford, P. R. Eisenhardt, M. Dickinson, et al., Astrophys. J. Suppl.142, 153 (2002). [16] W. S. Paciesas, C. A. Meegan, G. N. Pendleton, et al. Astrophys. J. Suppl.122, 465 (1999),
astro-ph/9903205.