OF A CLOSED FORK/JOIN QUEUEING SYSTEM
by Y. C. Liu
Department of Electrical & Computer Engineering Center for Communication and Signal Processing
and
H. G. Perras
Department of Computer Science
Center for Communication and Signal Processing North Carolina State University
Raleigh, NC 27695-8206
1. Introduction
There is currently considerable interest in the development of tools for analyz-ing the performance of distributed and parallel processing systems. In such
svs-terns. quite often. a job is split into two or more sub-jobs. These sub-jobs execute independently of one another, and at the end of their execution, they recompose to the original job. These type of operation IS known as fork/ join. or
disassembly/assembly in production system. They occur in multiprocessor comput-ing systems. distributed database systems, telecommunication systems and flexible
manufacturing systems.
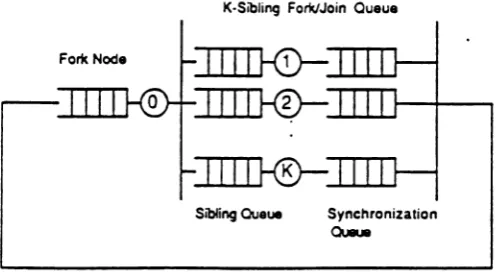
In this paper, we consider a closed queueing system comprising of a fork node
and a K-sibling fork/join queue (K2::2) with ~ jobs. When a job finishes its ser-vice at the fork node, it is split into a fixed number K of sub-jobs called siblings. Each sibling joins a different sibling queue, where it executes independently of the other siblings. Upon completion of its service, a sibling enters the synchronization
queue where it waits for the other siblings. As soon as all the siblings have been served, they merge into the original job which immediately joins the fork node.
The time elapsing between the fork and the join operation of a job is called the response time. ,,-\150, the time a sibling spends waiting for the other siblings is referred to as the synchronization delay.
Queueing networks with fork/ join operations are in general difficult to
analyze. An exact numerical analysis of a fork/ join queue results in an explosion of
fork / join models do not have analytically closed form solutions. In view of this, most of the fork/join systems reported in the literature have been analyzed using various approximation methods.
methodologies to derive a simple lower and upper bound of the response time. The first approach was based on the convex increasing ordering. '[he second approach
was based on the notion of associated random variables. a method similar to the one used by Nelson and Tantawi
[161.
In (3], Baccelli, Massey and Towsley extended these ordering and bounding techniques to analyze acyclic fork/ join queueing networks. Theyobtained bounds for the network response time.Heidelberger and Trivedi
[11)
considered a closed queueing network model of a computing system in which jobs divide into two or more asynchronous tasks, i.e., synchronization between tasks is not required. They developed an iterative tech-nique for solving a sequence of product-form type queueing networks. In(12],
they extended the model to include a join node. Two approximation methods weredeveloped. The first one was based on a decomposition approximation consisting of an inner model, a product-form queueing network, and an outer model, a finite state markov chain. The other approximation was based on the complementary
delays method, which iteratively solves a sequence of product form queueing net-works. The fork/join queue was analyzed numerically as a closed network by
queue into a :2-sibling fork/join queue, which was then used to replace the K-sibling fork/join queue m the cr ig inal queueing network. This queueing system was then analyzed numerically. They also developed a modification procedure for
the homogeneous case in order to improve the accuracy of the approximation algo-rithm.
good results for the mean response time and the system throughput. However, the procedure gives a lower bound of the system throughput and an upper bound of
the mean response time. Finally. the conclusions are given in section ,5.
K-Sibli"9 Fork/Join Queue
SiblingOueue Synchronization
0....
figure 1 : The system under study
figure 2 : The K-sibling fork/join queue as a closed queueing network
In this section. we analyze the closed I(-sibling fork/join queue with ~1 jobs.
shown in figure :2. assuming that K = .3. The state of the system is described by the vector (sl,s~.S3)' where Sz is the number of jobs at sibling queue i. \Ve have J.\1
=
max(sl,s2,S3). The total number of states of the closed 3-sibling fork/joinspace into groups, so that all the states in the same group have the same value of s ' . For example. for M
=
2 we have the following grouping of states.(Sl,S2,S3)
(S',S3)
index(0,0,2) (0,2) 0 (0,1,2)
(1,1,2) (1,2) 1 (1,0,2)
(0,2,2) (1,2,2)
(2,2,2)
(2,2)
2 (2,1,2)(2,0,2) (0,2,1) (1,2,1)
(2,2,1) (2,1) l' (2,1,1)
(2,0,1) (0,2,0) (1,2,0)
(2,2,0)
(2,0)
0'
(2,1,0)(2,0,0)
The macro states ( S'.53 l. in general. take the values: (i,NI), i
=
O. 1. 2... M, and(~{, j), j
=
~l-l. ~[-2... 0. These states are indexed as follows: O. 1....~.\1. (.\'f-l)' ,(..'vt - :2)' ....~O'. The indexing of these states for the example of ~1
=
~ is given in table 1.If the states are enumerated as shown in table 1, then the rate matrix Q(~\I) of the 3-sibling fork/join queue has a block tri-diagonal structure. For example, the rate matrix
Q(
l\tt),for M=
2 is as follows:Qoo(
~\f)QOl
(lvf)QIO(i\1) Qll(M) Q12(M)
Q(M)
=
Q21(Af) Q22(M) Q2dM)
Ql'2(M) Ql'l,(M) Ql'o,(M)
QO'l,(M) Qo'o,(M)
where,
JoLl
- al
Ql1(M)
= ~l - a2 J.L2 ,-a3
o
J.L3Q12(M)
=
~3J.L3 0
(1)
(2)
(3)
J..Ll - a"
Q22(.l\f)
=
~l-
a2 ~2- a2 J..L2 -a3
(5)
(6)
(7)
QO'l,(M)
=
(0,Q21(lW),O), Ql'l,(M)
=
Qo'o,(M)
=
Q22(1\1),
andQ21,(M)
=
Ql'O'(lW"),
QOO(i\1)
= (-
J.L3)' andQOl(M)
=
(0'''''37 0).the example of M :: 2. we have
where
- J.L2 1J.2
f-L1 - (J.L1+J.L2) 1-12
J..Ll -J.Ll
- f.L2 f.L2
JJ.l - (J.L1
+
~2) ~2fJ.l -(f.Ll+J.L2) J.L2
f.Ll -
(J.L
1+
J.L2) J.L2 J.Ll -J.Ll(8)
(9)
(10)
We note that the sub-matrix
Q2"2(.lW),
is the rate matrix of the 2-sibling fork/join queue obtained by shorting sibling queue 3, with 2 jobs in the system. The sub-matrixQl-l(M)
is the rate matrix of the same shorted 2-sibling fork/join queue, with 1 job in the system. The sub-matrix Qo~(M) is a singleton. Also, for the~ow, using these steady-state distributions we construct the aggregate matrix
P(.\f). \vhere each sub-matrix
QI
I( .\1) in the original matrixQ(
JI) isrepresented by a single transition. '[he upper diagonal elements of P(.~[) are given by
PI I+l(}lf) = v/-T(lvf) .QI/~l(,\1)
-1,
1=0,1, ... ,..\1"-1.-r
Q
PM (M-l)'(lv[) = vM
(4\1)·
M ~v-l(M) -1
PJ'J'-l(A1) = v;.r(M)· QJ'J'-1(M')'1, J'
=
(M-1)', ... ,1', The lower diagonal elements of P(M) are given by(11)
(12)
(13)
PII-1(A1)
=
v/T(l1lf ) ·QI
1-1(A1)'1,
I = 1,2, ...,Jl. (14)P(M-1)' .\((M) = v:.l(M) · Q(M-1)' M(M) ·
1
(15)
PJ'J'+1(M)
=
v;.r(M) ·
QrJ'+1(M)'1, J'=
(M-2)', ...
,0'.
(16)
The rate matrix P(M), for M
=
2, is as follows:Poo(M) POl(M)
Plo(M) Pll(M) P12(M)
P(M)
=P21(M) P22(A1) p21,(M)
Pl'2(M) Pl'l,(M) Pl'o,(M)
PO'l,(M) Po'o,(M)
and, in particular, it takes the form
- J.L3 ~3
~c(l) -(~c(l)+
""'3)
~3P(M)
=J.1.c(2)
-(J.1. c(2)+J.1.3)
J.1.3IJ.c(2)
-(J.1.c(2)+J.L3)
JL3
J.1.c
(2)
-
J.Lc(2)
(17)
(18)
We note that the aggregate rate matrix PIJl) is identical to the rate matrix of a 2-sibling fork/join queue consisting of a composite sibling queue (representing: the shorted 2-sibling fork/join queue) and sibling queue 3. The quantity J.L
c(m) is the
state-dependent service rate of the composite sibling queue, which is the system's throughput of the shorted 2-sibling fork/join queue with m jobs in it, m
=
1,2, ...,M.
As in the case of the stationary probability vector
v -
(M) forQ.
(~\1), where v·(M) = (VO·(l\1),...,
v.~(!vf), v(~1I-1),(!vl),
...,
VO~(l\1)),
the stationary probability vector x(M) for P(~\1), where x(M) = (XO(l\1), xt(M), ..., xM(M), X(M-l),(M), ...,xo,(M)),
can be easily obtained because the closed 2-sibling fork/join queue has aproduct-form solution. The approximate stationary probability vector
v(O)(M)
of. Q()
A(O)() (A (O)() A (0)( ) A (0) ( ) A (0) .matrix
M ,
where vM
= VoM ,...,
vMM ,
v(M-l)'M ,...,
Yo'(M)),
ISas follows,
A (0) •
VI
(M)=X[(l\1) ·
v/(M), [ = 0,1,2,...,.\.{. (19)v}~)(M)=xJ'(M)
· v;,(M),
l '=
(M-l)',(M-2)', . . . ,0'.
(20)
We note that the procedure described above for the 3-sibling fork/join queue,
is identical to the procedure described in Liu and Perros
[14).
In particular. theyfirst analyzed sibling queues 1 and 2 by shorting sibling queue 3, and obtained the
throughput T(i) of the shorted system, for i = 1,2, ....M, Then, they replaced this" shorted system by an equivalent composite sibling queue with a state-dependent
service rate equal to T(i), and used the composite sibling queue and sibling queue 3
composite sibling queue corresponds to the lower diagonal elements of the
aggre-gate matrix P(.~[). Therefore. we can apply- the above procedure rather than using expressions (11)-(16) to obtain the aggregate matrix P(L\.l).
A (0)
We now apply the Gauss-Seidel iterative method to modify v (.J1). Let
A(l)
I
A(l) A(O)I
v
(.v/)
be the resulting new vector. If v (~yf)-v (.~f)<
€, then we stop, and.yJl)(A4)
is the stationary probability ofQ(M).
Otherwise, set v·(A{}=
y(1)p1), and conformally dividev '
(1.\1) into subvectors, so that each subvector corresponds to a block. Normalize each subvector and re-compute the aggregate matrix P(~\1), in order to obtain a new stationary probability vector x(M). Using this vector and_ A(0) .
v (M), calculate v (1\1). Then, we apply the Gauss-Seidel method to calculate
A(l)
I
A(l) A(O)I
-
A(l)v (M). If v (M)-v (M)
<
E, then we stop. Else, set v (M)=
v (M),and repeat the above procedure, until the stationary probability vector of
Q(M)
converges.The procedure described above yields an exact solution for the closed 3-sibling fork/join queue. This procedure, though it was developed independently, turns out to be identical to the algorithm reported by Dodd, McAllister and Stewart [6], Koury, McAllister and Stewart (13), and Cao and Stewart [4], who showed that it yields the exactsolution.
In this section, we discuss an approximation procedure for analyzing the
closed queueing network with a I(-~ibiing fork/join queue shown in figure 1. The approximation procedure makes use of the iterative algorithm presented above. In
particular, using the above algorithm, we first reduce the closed Kvsibiing fork/ join queue shown in figure :2 to an approximately equivalent closed 2-sibling fork/join queue. This 2-sibling system is then used to replace the K-sibling system in the original queueing system shown in figure 1. This simplified model is then studied using the procedure described above.
We first analyze the closed K-sibling fork/join queue (see figure
2),
where K>4, with M customers in it. In particular, let us consider the 3-sibling fork/join queue consisting of sibling queues 1, 2, and 3, obtained by shorting out sibling queues 4 to K. This 3-sibling fork/join queue can be analyzed exactly using the approach described above with m customers in it, where m = 1, 2,...,M. (That is, we use the above procedure M times). The objective of this analysis is not thederivation of the steady-state probability vector of matrix
Q(
m), m=
1, 2, ... ,M. Rather. we are interested in obtaining the steady-state probabilities Pr (nilm ), nlESm, where nl is the state of the composite sibling queue eland sibling queue 3 and S is the set of all states for given rn. and the rate matrix
P(
m), m=
m
compo-site sibling queue and on the state of sibling queue 3. These state-dependentservice rates are aiven on the lower diazon al of the~ ~ matrix P(m ). m
=
l ,2.... ,.\L\'0\\·. we consider the -t-sibling fork/join queue consisting of sibling queues to 4, with m customers, m
=
1, 2, ...,Y1, obtained from the original closed K-sibling fork/join queue by shorting out sibling queues S to K. Let (81,82. S3 , 8 .. ) be the stateof the system, where s, is the number of customers in sibling queue i, i
=
1, 2, 3, 4. We analyze this system approximately as a 3-sibling fork/join queue with m custo-mers, m = 1, 2, ...,M, consisting of a composite sibling queue Cl' representingsibling queues 1 and 2, sibling queue 3 and sibling queue 4. The state-dependent service rates of the composite sibling queue clare obtained from the lower diago-nal of matrix P(m), calculated from the above analysis of the closed 3-sibling fork/join queue, m = 1, 2,... ,M. In an exact decomposition, this service rate should depend on 84 as well. However, this was not possible to obtain, and this is
why our method is approximate. We analyze this 3-sibling fork/join queue using the algorithm described in the previous section, for m = 1, 2,... ,M, and obtain the steady-state probabilities Pr (0 21m ), n2ESm' where 02 is thestate of the composite sibling queue C2 and sibling queue 4, and Sm is the set of all states for given m, and
the rate matrix P(m), m
=
1,2,....M,Now, let us consider the 5-sibling fork/ join queue consisting of sibling queues
described above. the service fates of the composite sibling queue are obtained from rhe lower diagonal of matrix
P(
!n.). calculated frorn rhe above analysis of the 1-sibling fork/join queue. \'ie analyze this 3-sibling fork/join queue for ITl=
L.~.... ,YI. and obtain the steady-state probabilities Pr (n3lm ), n3ESm , where n3 IS the state of the composite sibling queue c3 and sibling queue 5, and Sm is the set of all states for given m, and the rate matrix
P(
m), m = 1,2, ...,~1.We proceed in this fashion until we analyze a 3-sibling fork/join queue con-sisting of a composite sibling queue cK-3' representing sibling queues 1, 2, ... , and K-2, and sibling queue K-l and sibling queue K, with m customers, m = 1, 2,...,:V[. Again, of interest is the steady-state probabilities Pr (oK-2
1m ),
DK-2ESm , wherenK-2 is the state of the composite sibling queue CK-2 and sibling queue K, and 8m
is the setof all states for given m, and the rate matrix
P(
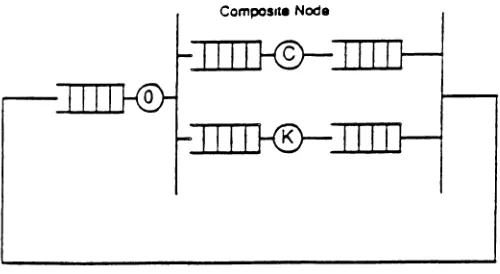
m), m = 1, 2, ... M. Using the lower diagonal elements of this matrix, we reduce the closed 3-sibling fork/join queue to a closed 2-sibling fork/join queue, consisting of a composite sibling queueCK-2 and sibling queue K. Thus, the original queueing system, shown in figure 1,
Composite Node
figure 3 : The reduced fork/join model
The above procedure yields the system throughput and the marginal queue-length probability distribution for the fork node, the
Kth
sibling queue and com-posite sibling queue CK-2. Performance measures of the other sibling queues can be obtained by working backwards. In particular, using the marginal queue-length probability of the CK-2 composite sibling queuePr
CK_2 (m), m
=
1, 2,... ,M, we have(21)
where
Pr(oK-3)
is the joint probability distribution of the composite sibling queueCK-3 and sibling queue K-1. Using
Pr(nK-3)'
the marginal queue-lengthprobabil-ity distribution of the sibling queue
K-l
and the composite sibling queueCK-3
can be easily obtained.queue length of each sibling queue can be easily obtained. Consequently, the mean queue length of each synchronization queue can also be obtained.
4. Results Analysis
The above algorithm was implemented on a VAX-ll/785 to analyze the fork/join model shown in figure 1 with 3, 4 and 8 siblings. For 3 and 4 siblings, the approximate results were compared against exact numerical values, and for 8 siblingsthey were compared against simulation results. The results for both homo-geneous cases and non-homogeneous cases are presented in tables 3 to 8 for the test case shown in table 2. Each table gives the approximate and exact (or simulation) results for the system throughput, mean queue lengths, and the mean response time of the fork/join operation for various values of J..Lo. The relative error [(exact (or simulation) - approximate)/exact (or simulation)] 100%) is also given.
It
was observed that the approximation procedure gives very good results for the system throughput (the relative error isless than 3%), the mean response time of the fork/join operation (the relative error is less than 5% on the average) and the mean queue length for the fork node and the mean queue length for each sibling queue (the relative error is less than 5% on the average). However, it gives results which are an upper bound of the mean response time of the fork/join operation and a lower bound of the system throughput, for both homogeneous andCase 1 : .i-sibling model. ~1
~ee table :3.
homogeneous rork/ join
=
~:! = f-l:l = :.2. ~[ = LOGCase :2 :
Case 3 :
Case 4 :
Case 5 :
Case 6 :
:~-~ibling nOn-hOITlogeneolls fork! join' model, J.lL = 1. J.L2
=
"2, 1J.3 = ;3. ~[=
10. See table 4.
-l-sibling homogeneous fork/join model, J..Ll = J..L2
=
J-L3 = J.L4 = 1, ~1 = 5. See table 5.4-sibling non-homogeneous fork/join model, J..Ll
=
1, f.L2=
2, J.L3 = 3, J..L4=
4, M
=
.5. See table 608-sibling homogeneous fork/join model, lit
=
J..L2= ... =
""8=
1, M=
15. See table 7.8-sibling non-homogeneous fork/join model, fJ.l
=
fJ.2=
1, ""3=
J..L4=
2, J.L5= JJ.&
=
3, J.L7=
f.Ls=
4, M = 15. See table 8.table 2 : Validation test cases
("PL~ time of the approximation procedure for the homogeneous model was l6.36
seconds. for the non-homogeneous model was L1.10 seconds. This procedure ~ives rnore accurate results than the one presented bv Liu and Perras
11-11.
This isbecause. we have obtained the state-dependent service rate of a composite sibling
queue so that not only it depends on the state of composite sibling queue, but also
it depends on the state of a third sibling queue.
5. Conclusions
We developed an approximation procedure for analyzing a closed queueing network with a K-sibling fork/join queue. The approximation procedure is based on nearly complete decomposability and Gauss-Seidel iterative method. It was shown through a number of examples that it gives results which are a lower bound of the system throughput and an upper bound of the mean response time of the fork/join operation.
Finally. we note that in the paper by Liu and Perras ~l-tl. they analyzed the same problem using decomposition and a~~regation. In parricuiar. the closed K-sibling fork/join queue was reduced iteratively to an approximately equivalent closed 2-sibling fork/join queue. The reduction was carried out by successively replacing closed 2-sibling fork/join queues by a composite sibling queue. The state-dependent service rate of the composite node was set equal to the system throughput of the 2-sibling fork/join queue. However, due to the interdependency between siblings, the state-dependent service rate of the composite node not only
REFERENCES
[ LJ
[2]
[3)
(4]
[5]
[6]
[7J
(8]
(9]
[10)
[11]
(12)
[13)
Baccelli, F. and Ma.kowski, ..~.M.. "Simple Computable Bounds for the Fork-Join Queue". Proceeding of the 19th Annual Conference on Information Science and Systems. The John Hopkins University, Baltimore..Marvland.
March 1985. pp. 436-441. .. v
Baccelli, F., Makowski, A.M. and Shwartz, A., "The Fork-Join Queue and Related Systems with Synchronization Constraints: Stochastic Ordering, Approximations and Computable Bounds If, Electrical Engineering Technical
Report, University of Maryland, College Park, January 1987.
Baccelli, F. and Massey, W.A. and Towsley, D., "Acyclic Fork-Join Queueing Networks", Internal Report, Computer Science Department, University of Massachusetts. April 1987. Systems and Their Performance, 1987
Cao
W. L.
and Stewart, W.J., "Iterative Aggregation/Disaggregation Techniques for Nearly Uncoupled Markov Chains", J. ACM, vol. 32, No.3, July 1985, 702-719.Courtois, P.J., "Decomposability: Queueing and Computer System Applica-tions", Academic Press, 1977.
Dodd, S.L., McAllister D.F. and Stewart W.J., "An Iterative Method for the Exact Solution of Coxian Queueing Networks", Proceedings
ACM/SIG~TRICSConf. on Measurement and Modeling of Computer
Sys-tems, September 1981,97-104.Duda, A. and Czachorski, T., "Performance Evaluation of Fork and Join Synchronization Primitives", to appear in ACTA Information.
Duda, A., "Approximate Performance .Analysis of parallel SystemsIf, Proc. of
2nd Inf. Workshop on Appl. Mathematics and Performance/Reliability Models of Computer/Communication Systems, Rome, Italy, May 25-27, 1987. Flatto,L. and Hahn, S., "Two Parallel Queues Created by Arrivals with Two Demands In, SlAJ.\1
J.
Appl. Math. vol. 44, Oct. 1984, 1041-1053.Flatto,L., "Two Parallel Queues Created by Arrivals with Two Demands In, SIAM
J.
Appl, Math. vol. 45, Oct. 1985, 861-878.Heidelberger, P. and Trivedi, S.K., "Queueing Network ~fodels for Parallel Processing with Asynchronous Tasks", IEEE Trans. on Comp. vol. 31, Nov. 1982, 1099-1109.
Heidelberger, P. and Trivedi, S.K., "Analytic Queueing Models for Pro-grams with Internal ConcurrencyII , IEEE Trans. on Compo vol. 32, Jan. 1983,
73-82.
[16]
(' hains", S L-L'vI .J. 0 isc . Math. ,),:2 (l98~L 10'1-1f~O.
Liu , Y.C. and Perros, H.G .. "Approxirnate An a.lvsis of a Closed Fork/Join
x
lode]~I, Technical Report - 8,~, C(~·SP. ECE. ~C',~r.
Mailles, D .. "Files dAtterite Descriptives Pour la \fodelisation de la Syn-chronisation dans des Systemes Inforrnat iques". These de Doctorate D'Etat.
Cniv. Paris 6, 1987.
System Throughput
J-LO/J-Ll Exact Approx. Error
10.0 1.853 1.853 0.00%
S.O 1.852 1.851 0.04%
1.0 1.712 1.708 0.26%
0.5 0.998 0.998 0.00%
0.1 0.200 0.200 0.00%
Mean Response Time of Fork/Join Operation
~O/~l Exact Approx. Error
10.0 5.342 5.341 0.02%
5.0 5.279 5.280 0.02%
1.0 3.751 3.763 0.32%
0.5 1.705 1.731 1.52%
0.1 1.005 1.008 0.34%
Mean Queue Length at Fork node
~O/~l Exact Approx. Error
10.0 0.1014 0.1016 0.17%
5.0 0.2238 0.2247 0.38%
1.0 3.5780 3.5745 0.10%
0.5 8.2980 8.2725 0.31%
0.1 9.7990 9.7983 0.01%
Mean Queue Length at Sibling Queue 1
~O/~l Exact Approx. Error
10.0 6.203 6.214 0.18%
5.0 6.123 6.133 0.16%
1.0 3.934 3.892 1.06%
0.5 0.991 0.991 0.00%
0.1 0.111 0.111 0.00%
Mean Queue Length at Synchronization Queue 1
~O/~l Exact Approx. Error
10.0 3.69600 3.6845 0.31%
S.O 3.65300 3.6424 0.29%
1.0 2.48800 2.5332 1.82%
0.5 0.71020 0.7369 3.76%
=3.
System Throughput
J.lo/J-L1 Exact Approx. Error
10.0 0.9998 1.0000 0.02%
S.O 0.9998 1.0000 0.02%
1.0 0.9090 0.9071 0.21%
0.5 0.4997 0.4997 0.00%
0.1 0.1000 0.1000 0.00%
Mean Response Time of Fork/Join Operation JJ.o/"""1 Exact Approx. Error
10.0 9.8910 9.8890 0.02%
5.0 9.7520 9.7501 0.02%
1.0 5.5620 5.6328 1.27%
0.5 2.1610 2.2155 2.52%
0.1 1.3240 1.3300 0.45%
Mean queue length at Fork Node
~O/~l Exact Approx. Error
10.0 0.1111 0.1111 0.00%
5.0 0.2499 0.2499 0.00%
1.0 4.9440 4.8905 1.08%
0.5 8.9200 8.8929 0.30%
0.1 9.8680 9.8670 0.01%
Mean Queue Length at Sibling Queue 1
fJ..O/~l Exact Approx. Error
10.0 9.8880 9.8880 0.00%
5.0 9.7490 9.7490 0.00%
1.0 4.9980 5.0590 1.22%
0.5 0.9945 1.0270 3.26%
0.1 0.1111 0.1120 0.80%
Mean Queue Length at Synchronization Queue 1
~O/~l Exact Approx. Error
10.0 0.001106 0.0009 18.60%
5.0 0.001311 0.0011 16.10%
1.0 0.057850 0.0505 12.70%
0.5 0.085330 0.0801 6.13%
~O/f..ll Exact Approx. Error
10.0 0.99880 0.9989 0.01%
S.O 0.99870 0.9987 0.00%
1.0 0.81910 0.8208 0.20%
0.5 0.33300 0.3375 1.35%
0.1 0.05263 0.0528 0.42%
Mean Queue Length at Synchronization Queue 2 J.l.o/JLl Exact Approx. Error
10.0 8.89000 8.8900 0.00%
S.O 8.75100 8.7514 0.00%
1.0 4.23700 4.2887 1.22%
0.5 0.74690 0.7696 3.03%
0.1 0.07962 0.0801 0.55%
Mean Queue Length at Sibling Queue 3
lJ.o/J.11 Exact Approx. Error
10.0 0.49970 0.4998 0.02%
5.0 0.49970 0.4998 0.02%
1.0 0.43180 0.4304 0.32%
0.5 0.19980 0.1998 0.00%
0.1 0.03448 0.0345 0.00%
Mean Queue Length at Synchronization Queue 3
J.LO/J.Ll Exact Approx. Error
10.0 9.38900 9.3890 0.00%
5.0 9.25000 9.2502 0.00%
1.0 4.62400 4.6791 1.19%
0.5 0.88000 0.9072 3.08%
System Throughput
~O/~l Exact Approx. Error
10.0 0.8315 0.8281 0.41%
5.0 0.8288 0.8242 0.56%
1.0 0.7244 0.7172 0.99%
0.5 0.4786 0.4765 0.44%
0.1 0.1000 0.1000 0.00%
Mean Response Time of Fork/Join Operation JJ.o/J.L1 Exact Approx. Error
10.0 5.9050 5.9302 0.43%
5.0 5.8020 5.8330 0.531:
1.0 4.6400 4.6954 1.19%
0.5 3.4300 3.5100 2.30%
0.1 2.2760 2.3170 1.80%
Mean Queue Length at Fork Node
~O/J.Ll Exact Approx. Error
10.0 0.08913 0.08924 0.12%
5.0 0.19150 0.19246 0.50%
1.0 1.63900 1.63246 0.40%
0.5 3.35900 3.32780 0.93%
0.1 4.77200 4.76830 0.08%
Mea.n Queue Length at Sibling Queue 1
JJ.o/J.L1 Exact Approx. Error
10.0 2.69100 2.6936 0.10%
5.0 2.63000 2.6285 0.06%
1.0 1.79200 1.7603 1.17%
0.5 0.84750 0.8400 0.88%
0.1 0.11100 0.1110 0.00%
Mean Queue Length at Synchronization Queue 1
v-J»,
Exact Approx. Error10.0 2.21900 2.2172 0.08%
5.0 2.17900 2.1791 0.00%
1.0 1.56900 1.6072 2.44%
0.5 0.79390 0.8322 4.82%
= :3. ~l
=
-toSystem Throughput
~O/""l
Exact Approx. Error10.0 0.9997 0.9992 0.05%
5.0 0.9992 0.9983 0.09%
1.0 0.8317 0.8252 0.78%
0.5 0.4919 0.4910 0.18%
0.1 0.1000 0.1000 0.00%
Mean Response Time of Fork/Join Operation
I
fJ-oI IJ.1 Exact Approx. Error
10.0 4.8905 4.8930 0.05%
5.0 4.7572 4.7596 0.05%
1.0 3.1121 3.1683 1.80%
0.5 2.0248 2.0839 2.92%
0.1 1.3400 1.3570 1.27%
Mean Queue Length at Fork Node
~O/lJ-l Exact Approx. Error
10.0 0.1106 0.1109 0.27%
5.0 0.2470 0.2485 0.60%
1.0 2.4120 2.3855 1.10%
0.5 4.0040 3.9768 0.68%
0.1 4.8660 4.8643 0.03%
Mean Queue Length at Sibling Queue 1
J..Lol
J.Ll Exact Approx. Error10.0 4.8560 4.8560 0.00%
5.0
4.7150 4.7140 0.02%1.0 2.4840 2.5210 1.46%
0.5 0.9037 0.9346 3.42%
0.1 0.1111 0.1124 1.17%
Mean Queue Length at Synchronization Queue 1 J.LO/J..Ll Exact Approx. Error
10.0 0.0330 0.0331 0.30%
5.0 0.0384 0.0375 2.34%
1.0 0.1043 0.0935 10.35%
0.5 0.0923 0.0886 4.00%
~O/~l Exact Approx. Error
10.0 0.9620 0.9622
o•
02~~S.O 0.9561 0.9549 0.13%
1.0 0.6714 0.6710 0.06%
Oe5 0.3229 0.3274 1.39%
0.1 0.0526 0.0529 0.63%
Mean Queue Length at Synchronization Queue 2
JJ.O/J.Ll Exact Approx. Error
10.0 3.9270 3.9269 0.00%
5.0 3.7970 3e7966 0.01%
1.0 1.9170 1.9435 1.38%
0.5 0.6731 0.6958 3.37%
0.1 0.0814 0.0828 1.68%
Mean Queue Length at Sibling Queue 3
fJ.o/JL1 Exact Approx. Error
10.0 0.4925 0.4922 0.06%
5.0 0.4913 0.4901 0.24%
1.0 0.3737 0.3686 1.36%
0.5 0.1951 0.1947 0.20%
0.1 0.0345 0.0345 0.00%
Mean Queue length at Synchronization Queue 3
JJ.o/ JJ.l Exact Approx. Error
10.0 4.3970 4.3969 0.00%
5.0 4.2620 4.2614 0.01%
1.0 2.2140 2.2459 1.44%
0.5 0.8009 0.8285 3.45%
0.1 0.0996 0.1012 1.60%
Mean Queue Length at Sibling Queue 4
JJ.O/J-Ll Exact Approx. Error
10.0 0.3298 0.3312 0.42%
5.0 0.3294 0.3305 0.33%
1.0 0.2583 0.2558 0.99%
0.5 0.1398 0.1394 0.29%
0.1 0.0256 0.0256 0.00%
1.0 2.3300 2.3587 1.23%
0.5 0.8563 0.8837 3.20%
System Throughput
JJ-o/J.L1 Simulation Approx. Error
10.0 0.9187 0.9036 1.64%
5.0 0.9132 0.9028 1.14%
1.0 0.8659 0.8546 1.30%
0.5 0.4931 0.4999 1.38%
0.1 0.0976 0.1000 2.46%
Mean Response Time of Fork/Join Operation
~O/f..Ll Simulation Approx. Error
10.0 16.3130 16.4910 1.09%
5.0 16.2493 16.3720 0.76%
1.0 12.2200 12.7270 4.15%
0.5 4.8097 5.3490 11.21%
0.1 2.9668 3.2340 9.01%
Mean Queue Length at Fork Node
JJ.O/J.Ll Simulation Approx. Error
10.0 0.10210 0.09904 3.00%
5.0 0.22056 0.21898 0.72%
1.0 4.40822 4.11827 6.58%
0.5 12.63000 12.32620 2.41%
0.1 14.70000 14.67656 0.16%
Mean Queue Length at Sibling Queue 1
.
.
JJ-O/1-11 Simulation Approx. Error
10.0 6.8389 6.7605 1.15%
5.0 6.6968 6.7015 0.07%
1.0 4.7367 4.6149 2.57%
0.5 0.9742 0.9989 2.54%
0.1 0.1129 0.1111 1.62%
Mean Queue Length at Synchronization Queue 1
..
~O/~1 Simulation Approx. Error
10.0 8.0567 8.1405 1.04%
5.0 8.0825 8.0795 0.04%
1.0 5.8550 6.2623 6.95%
0.5 1.3956 1.6749 20.01%
J.L5 --~_f")6 -
r.
~[ = l1..i , ~7 = ~~ =
System Throughput
~O/~l Simulation Approx. Error
10.0 0.9770 0.9675 0.97%
5.0 0.9668 0.9672 0.04%
1.0 0.9171 0.9086 0.93%
0.5 0.5034 0.5000 0.70%
0.1 0.0986 0.1000 1.40%
Mean Response Time of Fork/Join Operation
'tLo/J..L1 Simulation Approx. Error
10.0 15.40820 15.3932 0.10%
5.0 15.10850 15.2610 1.00%
1.0 9.95020 9.9587 0.10%
0.5 3.10450 3.2280 3.98%
0.1 1.81640 1.9400 6.80%
Mean Queue Length at Fork Node
~o/JJ.l Simulation Approx. Error
10.0 0.10544 0.1071 1.57%
5.0 0.24202 0.2396 1.00%
1.0 6.32950 5.9515 5.97%
0.5 13.43600 13.3860 0.37%
0.1 14.82000 14.8060 0.10%
Mean Queue Length at Sibling Queue 1
/
Simulation Approx. Error
IJ-oI JJ.1
10.0 11.0072 11.0500 0.39%
5.0 10.9437 10.9500 0.06%
1.0 6.3467 6.6660 4.94%
0.5 1.0543 1.1050 4.80%
0.1 0.1083 0.1177 8.68%
Mean Queue Length at Synchronization queue 1 JJ-o/~l Simulation Approx. Error
10.0 3.8873 3.8429 1.14%
5.0 3.8142 3.8104 0.10%
1.0 2.3237 2.3885 2.79%
0.5 0.5092 0.5090 0.04%
~O/~l Simulation Approx. Error
10.0 0.90400 0.9174 1.48%
S.O 0.92257 0.9167 0.64%
1.0 0.85246 0.8247 3.26%
0.5 0.33888 0.3392 0.09%
0.1 0.05314 OClS252 1.17%
Mean Queue Length at Synchronization Queue 3
~o/J.LI Simulation Approx. Error
10.0 13.9905 13.9755 0.11%
5.0 13.8354 13.8437 0.06%
1.0 7.8179 8.2238 5.19%
0.5 1.2245 1.2748 4.11%
0.1 0.1259 0.1415 12.39%
Mean Queue Length at Sibling Queue 5
JJ.o/ J.11 Simulation Approx. Error
10.0 0.47130 0.4747 0.73%
5.0 0.47450 0.4745 0.00%
1.0 0.43900 0.4333 1.30%
0.5 0.20200 0.2014 0.30%
0.1 0.03369 0.0343 1.78%
Mean Queue Length at Synchronization Queue 5
JJ.O/~l Simulation Approx. Error
10.0 14.4233 14.4182 0.03%
5.0 14.2835 14.2859 0.02%
1.0 8.2314 8.6152 4.66%
0.5 1.3614 1.4126 3.76%
0.1 0.1454 0.1597 9.84%
Mean Queue Length at Sibling Queue 7
~o/fJ.l Simulation Approx. Error
10.0 0.319318 0.3189 0.13%
5.0 0.322000 0.3188 1.00%
1.0 0.297300 0.2942 1.04%
0.5 0.143550 0.1441 0.38%
~O/f..Ll Simulation Approx. Error
10.0 14.5752 14.5746 0.01%
S.O 14.4368 14.4416 0.03%
1.0 8.3730 8.7543 4.55%
0.5 1.4199 1.4699 3.52%