Interfacial Adsorption of Silk Fibroin Peptides and Their
Interaction with Surfactants at the Solid-Water Interface
Dharana Jayawardane1, Fang Pan2, Jian R. Lu2, Xiubo Zhao1*
1Department of Chemical and Biological Engineering, University of Sheffield, Sheffield, S1 3JD, UK
2Biological Physics Group, Schuster Building, University of Manchester, Manchester, M13 9PL, UK
*Author for correspondence: Xiubo Zhao, phone +44-114-2228256, email: [email protected]
Abstract
Regenerated silk fibroin (RSF) is a FDA approved material and has been widely used in many biomedical and cosmetic applications. Due to the amphiphilic nature of the primary repeat amino acid sequence (e.g. AGAGAS), RSF peptides can significantly reduce the water surface tension therefore has the potential to be used as a surface active component for many applications particularly in biomedical, cosmetic, pharmaceutical and food industries. In this paper, the adsorption of RSF peptides separated in to molecular fractions of 5-30 kDa, 30-300 kDa, and >300 kDa has been studied at the solid water interface by neutron reflection and spectroscopic ellipsometry to assess its surface active behaviour. A stable layer of RSF was found irreversibly adsorbed at the hydrophilic SiO2/water interface. Changes in solution concentration, pH and ionic strength all impacted on the final adsorbed amount found at the interface. There was no significant differences between the final adsorbed amounts or layer structure between the three RSF molecular fractions studied, however RSF >300 kDa was more stable to changes in solution ionic strength. Adsorption of conventional anionic and cationic surfactants, sodium dodecyl sulfate (SDS), and dodecyl trimethyl ammonium bromide (C12TAB), on to the pre-adsorbed RSF 5-30 kDa revealed surfactant penetration into the RSF layer, at concentrations below the critical micellar concentration (CMC). SDS was found in the pre-adsorbed RSF layer and it gradually removed RSF from the surface with increasing SDS concentration. At concentrations above the CMC, there is near complete removal of RSF by SDS at the interface. C12TAB adsorbed into the pre-adsorbed RSF layer with considerably less removal of RSF from the interface compared to SDS. At concentrations above CMC, both C12Tab and RSF were found coexisted at the interface forming a less thick layer but with considerable amount of RSF still present.
1. Introduction
Surfactants are of interest in many fields ranging from bioremediation1, biomedical applications2-3, food industry4-5 and personal care.6-7 Current environmental requirements place emphasis on the use of biosustainable and biodegradable surfactant based products pushing industries to search for multi functioning surfactants derived from natural sources.8 To meet requirements and increase consumer appeal, alternatives to conventional petrochemical derived surfactants are highly sought after. In this landscape, the search for new bio-polymer surfactants derived from proteins has become an important area of research, as they possess desirable physicochemical properties and a biocompatible and environmentally friendly nature.9 Silk fibroin is a protein which has been extensively studied as a biomaterial10, attracting much attention for its biodegradable and biocompatible11 properties as well as other excellent material properties (e.g. strong mechanical strength) making it highly versatile for use in a diverse range of applications from tissue engineering scaffolds to drug delivery vectors.12-15 However silk fibroin’s interfacial adsorption behaviour and its surface active properties are poorly understood and have not been extensively characterized thus limiting its potential use as a surface active agent and its possible applications.
chain, which is mainly based on a Gly-X sequence as well as a repetitive hexapeptide sequence of Gly-Ala-Gly-Ala-Gly-X, where X is one of Ala>Ser>Tyr.16-17 Hydrogen bonding between these crystalline regions gives rise to insoluble silk II (beta sheet) structure found in fibres. Most dissolution methods employ chaotropic agents to disrupt the hydrogen bonds holding the silk II structure in place. Interestingly, the regenerated silk fibroin arising from the dissolution process has been observed to yield a very broad range of molecular sizes (other than 25 kDa and 391 kDa) indicating fragmentation of the native silk fibroin chains into a complex mixture of peptides.18-19 The resulting peptides can resemble common surfactant structures, embodying an amphiphilic nature with a hydrophilic head and hydrophobic tail.20 The repetitive nature of silk fibroin’s amino acid sequence indicates the presence of hydrophilic segments arising from the hydroxyl side chains present on amino acids such as Ser and Tyr and carboxyl group of the C terminal, and hydrophobic segments from methyl side chains found in Gly-Ala segments. Thus the dissolution process can liberate shorter peptide sequences which possess a stronger amphiphilic character and surfactant properties. Similarly, food proteins such as pea protein and whey have been chemically or enzymatically digested in order to produce low molecular weight peptides which have been shown to possess enhanced emulsifying and foaming abilities.21-24
A detailed understanding of RSF’s adsorption behaviour is necessary in order to exploit desirable surface active properties and compare its adsorption behaviour with other bio-polymers and biosurfactants.25-26Over the years much effort has gone into studying the adsorption of proteins 27-30 at interfaces which can have complex adsorption behaviours, especially in mixed systems.31 Regenerated silk fibroin is inherently a complex mixed system and filtration of the solution can yield fractions which exhibit distinct behaviours adding value to the product.32-35 In this article, we investigated how different bulk solution conditions and the presence of conventional surfactants affect the silk fibroin peptides at the SiO2/water interface. Neutron reflection and spectroscopic ellipsometry were used to study interactions for their combined excellent ability to study buried interfaces, adsorption behaviour and probe the structures found at the solid/liquid interface. 36-40
2. Materials and Methods
Silk preparation
Theoretical Chemistry lab, University of Oxford. All surfactants were purified and dissolved in UHQ (or D2O) stock solutions ready for dilution and use in experiments.
Spectroscopic Ellipsometry (SE)
SE measurements were determined by Jobin-Yvon UVISEL spectroscopic ellipsometer. The SE measurements were performed over a wavelength range between 300 and 600 nm. A liquid cell with fused quartz windows was used to enable the SE measurement at the solid/liquid interface with the incident light beam at 70°. The experimental data were analysed using software called DeltaPsi II developed by Jobin-Yvon. The ellipsometer measured the change in the polarization state of light reflected from the surface of the sample. By studying the changes in the state of polarization, information about layer thickness and refractive index was revealed through the simultaneous analysis of two ellipsometric angles ψ and Δ. The changes in amplitude and phase of polarization of the light after reflection were determined in two components, the plane of reflection (p-plane), and that perpendicular to it (s-plane). The sample ellipticity, F, is defined as the ratio of the Fresnel coefficients of the p and s planes (Rp and Rs) and is expressed as42
ρ=Rp
Rs=tanψ e
i ∆
(1)
The refractive index nf and the coupled thickness τf were subsequently calculated by the software using eq 1. The surface adsorbed amount Γ (mg/m2) of the sample is finally calculated from n
f and τf (in Å) through eq 2,
Γ=τf(nf−n0)
dn/dc
(2)
where n0 is the refractive index of the buffer, dn/dc stands for the change of refractive index against solution concentration and a value of 0.18 ml/g was used in this work.43
Neutron reflection (NR)
NR measurements were carried out on SURF at RAL, Oxford, UK, using a neutron beam of wavelength 0.5 to 6.5 Å. The silicon <111> blocks used were polished by Crystran Ltd., UK and treated with Piranha solution at 90 °C for 1 min. Solution samples (2 ml) were filled into the lumen cell made by clamping a Perspex trough against the polished face of a silicon block with dimensions of 6 × 5 × 1.2 cm3. The sample cell was mounted on a goniometer stage controlled by the computer terminals. The neutron beam entered the small face of the silicon block, was reflected from the solid/solution interface and exited from the opposite end of the small face. The neutron beam was collimated by two sets of horizontal and vertical slits placed before the sample cell, creating a typical beam illuminated area around 4 × 3 cm2. Each reflectivity experiment was carried out at three incidence angles of 0.35, 0.8 and 1.8° and the resulting reflectivity profiles combined to cover a wave vector (κ) between 0.012 and 0.5 Å-1. Reflectivity profiles below the critical angle were theoretically equal to unity and all the data measured were scaled accordingly. Constant background was subtracted using the average reflectivity between 0.3 and 0.5 Å-1. The background was found to be typically around 3 × 10⁻⁶ in D
Model fitting of neutron reflection data has been extensively used to quantitatively analyse information regarding thickness and composition of adsorbed layers and has been found to be ideally suited to investigate multi component mixed layers adsorbed at an interface.36-39 Motofit package was used for the data fitting.44 When fitting the data a structural model was assumed and the interface was divided into a suitable number of uniform sublayers. A model with minimum number of sublayers is preferred as it reduces the complexity of the system and overfitting of the data. Reflectivity from the model layers is calculated using the optical matrix formulism this is then compared with the measured reflectivity and the structural parameters (mainly thickness (τ) and scattering length density (ρ)) are modified in a least-square iteration until a good fit is obtained. For a two component adsorption, such as surfactant and peptide in water, the volume fraction and scattering length density of a layer can be expressed using equations (3) and (4)
ρ¿ρpφp+ρsφs+ρwφw
(3)
φp+φs+φw=1
(4)
where ρ is the total scattering length density (SLD) of a layer and ρp,ρs, and ρw are the known individual scattering length densities of peptide, surfactant and water, and φp, φs and φw, are the respective unknown volume fractions of the components found in the layer which must add up to one. However, since there are three unknowns, the volume fraction of each component cannot be solved. In order to solve the equation, the adsorption experiment is repeated using a deuterated version of the surfactant as an isotopic contrast to yield two independent equations for eq 3 allowing the volume fraction for both components to be calculated. Fitting two different isotopic compositions to one structural model also significantly reduces possible ambiguity in the interpretation of the data. Once the volume fractions have been calculated the surface area per molecule (A) can be calculated using equation (5)
A=Vp
τφp
(5)
where Vp is the volume of the peptide. The surface excess (Γ) can then be calculated by
Γ= MW
6.02A
(6)
where MW is the molecular weight of the component.
(A)
0 10 20 30 40 50 60 70
0 1 2 3 4 Time (min) Su rf ac e E xc e ss ( m g/ m 2 ) (B)
0 0.02 0.04 0.06 0.08 0.1 0.12 0.14 0.16 0.18 0.2 1E-10. 1E-09. 1E-08. 1E-07. 1E-06. 1E-05. 1E-04. 1E-03. 1E-02. 1E-01. 1E+00. Q/ Å-1 R ef le ct iv it y
Figure 1. (A) Adsorption kinetics for RSF 5-30 kDa at concentrations of 0.3 (□), 1 (◊), 3 (∆) and 10 (o) mg/ml, pH 7, at the silica/water interface, studied by SE. (B) Reflectivity profiles for RSF 5-30 kDa at concentration of 0.3 (□), 1 (◊), 3 (∆) and 10 (o) mg/ml, pH 7, at the silica/water interface studied by NR. Solid lines through the data points correspond to the best fits for the corresponding reflectivity curves which are detailed in Table 1.
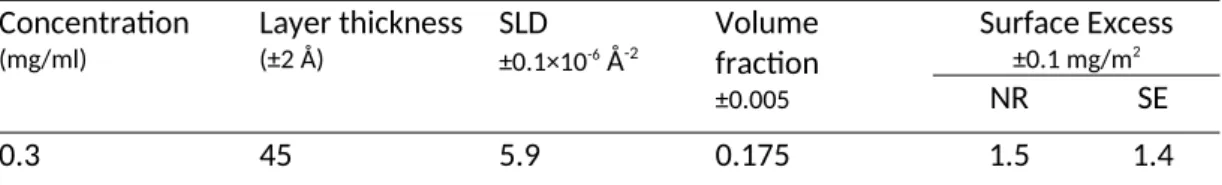
Table 1. Structural parameters of neutron reflection best fits for 5-30 kDa silk fibroin peptides adsorbed for 1hr at the SiO2 /water interface at pH 7.
Concentration
(mg/ml)
Layer thickness
(±2 Å)
SLD
±0.1×10⁻⁶ Å-2
Volume fraction
±0.005
Surface Excess
±0.1 mg/m2
NR SE
43 6.2 0.060
1 37 5.5 0.335 2.4 2.3
45 6.1 0.100
3 37 5.2 0.450 3.2 3.1
40 6.0 0.140
10 40 5.2 0.450 3.5 3.4
43 6.0 0.140
A. The Adsorption of RSF onto SiO2/Water Interface increases with concentration.
Ellipsometry experiments were carried out for the adsorption of several concentrations of RSF 5-30 kDa as shown in Figure 1 A. Neutron reflectivity curves for the same conditions (Figure 1B) revealed how the structural arrangement of the peptide changed with concentration at the interface. RSF was adsorbed onto the SiO2 surface and gradually plateaued over the period of 1 hour. Rinsing of the adsorbed layer with UHQ resulted in a minor removal of loosely adsorbed RSF (less than 0.2 mg/m2, data not shown), leaving a stable, strongly adsorbed RSF layer behind. The absorbed amount, following 1 hour adsorption, was seen to increase considerably with bulk solution concentration, from 1.4 mg/m2 at 0.3 mg/ml up to 3.1 mg/m2 at 3 mg/ml, further increase in concentration to 10 mg/ml led only to an additional 0.3 mg/m2 increase in the adsorbed amount, indicating the saturated adsorption. Neutron data fittings shown in Table 1 show that RSF 5-30 kDa was fitted using a two layer structure with an overall mean thickness of around 83 Å over the concentration range studied. A single layer fitting could not provide a good fit across the entire Q range. The inner layer was seen to have a lower SLD than the outer layer indicating that most of the peptide was found packed closest to the SiO2 interface and the outer layer was diffuse with a maximum volume fraction of 14%. Increasing the bulk solution concentration from 0.3 mg/ml to 10 mg/ml caused a gradual lowering of the inner layer SLD from 5.9 to 5.2 (× 10-6 Å-2) and a lowering of the outer layer SLD from 6.2 to 6.0 (× 10-6 Å-2). The SLD of RSF peptide was calculated to be 3.8 × 10⁻⁶ Å-2, based on its amino acid composition. Hence the lowering of the SLDs was due to RSF peptide adsorbing and packing itself more tightly, as seen by the peptide volume fraction increasing from 17.5% to 45%, at the interface. The surface adsorbed amount obtained from NR was found increased from 1.5 mg/m2 at 0.3 mg/ml to 3.5 mg/m2 at 10 mg/ml. This finding is highly consistent with the SE results (Table 1).
(A)
0 10 20 30 40 50 60 70
0 1 2 3 4
SF 5-30k SF 5-30k
SF 30-300k SF 30-300k
SF >300k SF >300k
Time (mins)
Su
rf
ac
e
E
xc
e
ss
(
m
g/
m
2
)
(B)
0 2 4 6 8 10 12
0 1 2 3 4
5-30 kDa 5-30 kDa NR
30-300 kDa 30-300 kDa NR
>300 kDa >300 kDa NR
Concentration (mg/ml)
Su
rf
ac
e
E
xc
e
ss
(
m
g/
m
2
)
Figure 2. (A) Adsorption kinetics (measured by SE) for 0.3 mg/ml (open symbols) and 3 mg/ml
(shaded symbols) RSF at the silica/water interface, pH 7. (B) Adsorption isotherms for silk fibroin
B. Increasing pH reduces the Adsorption of RSF at the SiO2/Water Interface.
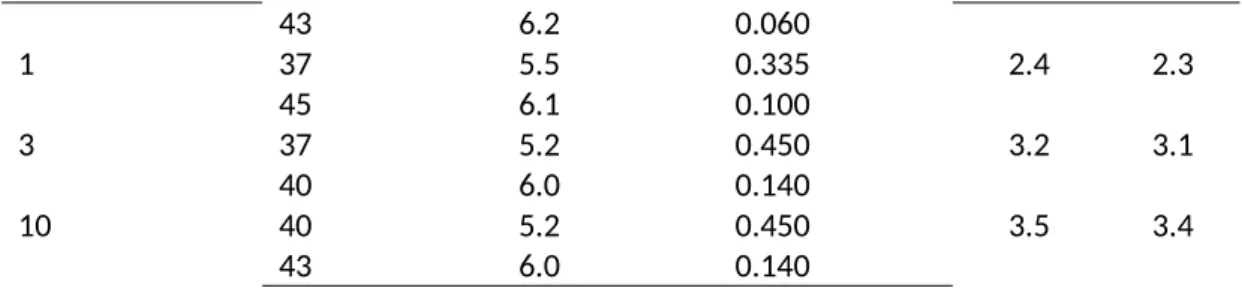
Ellipsometry and neutron reflection were used to study how changes in the pH solution affected the adsorption behaviour of RSF at the SiO2/water interface. The solution pH has an effect on both SiO2 and peptide surface charge density. In the case of SiO2, the surface charge becomes weakly negative above pH 2, and between pH 5-9 there is a small increase in surface charge density. Silk Fibroin has an isoelectric point of around 4.53,45 changes in the solution pH above this cause the charge densities on the peptide to increase and consequently affect the adsorption process and adsorbed layer structure at the interface. The results in Figure 3A clearly show a pH dependant reduction in the absorbed amount with increasing pH for a fixed 3 mg/ml solution of RSF 5-30 kDa solution. The surface adsorbed amount reduced from 3.6 mg/m2 at pH 5, to 3.1 mg/m2 at pH 7, and dropped to 2.1 mg/m2 when pH increased to 9 (Table 2). The results highlight the importance of electrostatic forces on the adsorbed RSF layer. As pH increases the RSF peptide gains a more negatively charged character and thus experiences more inter and intra-molecular like-charge repulsive forces which combined with the negatively charged SiO2 surface results in lower adsorbed amounts and a more diffuse adsorbed layer. NR data shown in Figure 3B and Table 2 reveals the structural changes that occur to the adsorbed layer as pH is increased. The layer SLDs increase in both the inner and outer layers with pH, with a decreasing peptide volume fraction from 49% to 35.5% for the inner layer and from 14% to 6% for the outer layer, indicating a more diffuse layer and a lower surface absorbed amount. However, the layer thicknesses for both inner and outer layers did not change much with pH (both layers are around 40 Å). The same trend was seen with the other MW fractions (30-300 kDa and >300 kDa) of RSF (Figure S3&S4, Table S3&S4).
(A)
0 10 20 30 40 50 60 70
0 1 2 3 4 5
Time (min)
Su
rf
ac
e
E
xc
e
ss
(
m
g/
m
2
(B)
0 0.02 0.04 0.06 0.08 0.1 0.12 0.14 0.16 0.18 0.2 1E-09.
1E-08. 1E-07. 1E-06. 1E-05. 1E-04. 1E-03. 1E-02. 1E-01. 1E+00.
Q/ Å-1
R
ef
le
ct
iv
it
y
Figure 3. (A) Adsorption kinetics for RSF 5-30 kDa at the concentration of 3 mg/ml at pH 5 (□), pH 7(◊) and pH 9(∆) at the silica/water interface, studied by SE.(B) Reflectivity profiles for 3 mg/ml RSF 5-30 kDa at pH 5 (□), pH 7(◊) and pH 9(∆) studied by NR. Solid lines through the data points correspond to the best fits for the corresponding reflectivity curves.
Table 2. Structural parameters of neutron reflection best fits for pH effect on RSF 5-30 kDa adsorbed for 1hr at the SiO2 /water interface at a concentration of 3 mg/ml.
pH Layer thickness
(±2 Å)
SLD
±0.1×10⁻⁶ Å-2
Volume fraction
±0.005
Surface Excess
±0.1 mg/m2
NR SE
5 42 5.1 0.490 3.8 3.6
40 6.0 0.140
7 37 5.2 0.450 3.2 3.1
40 6.0 0.140
9 39 5.5 0.335 2.3 2.1
42 6.2 0.060
C. Increasing the Ionic Strength reduces the Adsorption of RSF at the SiO2/Water
Interface.
increased electrostatic charges from both peptide and SiO2 surface were increasingly screened. This impacted on the adsorbed amount by reducing any possible attractive charge interaction between RSF and SiO2 surface and most importantly it increased peptide-peptide interactions in bulk solution by screening repulsive electrostatic like charges found along RSF chains. Thus preferential peptide-peptide interactions in the bulk solution resulted in lower surface adsorbed amounts at the interface. Increased peptide-peptide interactions at high ionic strengths can result in phase separation or ‘salting out’ of RSF and the consequent formation of insoluble particles which have potential as drug delivery particles.14 Similarly, studies with BSA proteins revealed a strong ionic-dependant screening of peptide-peptide repulsive interactions allowing for an enhanced attractive potential between BSA molecules in solution.46 Adsorptions of other proteins such as β-casein and lysozyme have also been shown to have similar trends when exposed to increasing ionic concentrations.47-48 Figure 5, interestingly shows a more stable response by RSF >300 kDa which is able to withstand slightly higher Ionic concentration than the other two RSF fractions. The RSF >300 kDa fraction is likely to have a more stable tertiary structure with less conformational liberty in virtue of its larger size and increased ability to form inter and intramolecular interactions granting it greater stability to changes in ionic strength.
(A)
0 10 20 30 40 50 60 70
0 1 2 3
Time (min)
Su
rf
ac
e
E
xc
e
ss
(
m
g/
m
2
(B)
0 0.02 0.04 0.06 0.08 0.1 0.12 0.14 0.16 0.18 0.2 1E-10.
1E-09. 1E-08. 1E-07. 1E-06. 1E-05. 1E-04. 1E-03. 1E-02. 1E-01. 1E+00.
Q/ Å-1
R
ef
le
ct
iv
it
y
Figure 4. (A) Adsorption kinetics for RSF 5-30 kDa 3 mg/ml with NaCl concentrations of 5 (□), 20 (◊), 50 (∆), 150 (o) and 500 (*) mM, at the silica/water interface, pH 7 studied by SE.
(B) Reflectivity profiles for RSF 5-30 kDa pH 7 with NaCl concentrations of 5 (□), 20 (◊), 50 (∆), 150 (o) and 500 (*) mM studied by NR. Solid lines through the data points correspond to the best fits for the corresponding reflectivity curves.
Table 3. Structural parameters of neutron reflection best fits for NaCl effect on 5-30 kDa silk fibroin peptides adsorbed for 1 hr at the SiO2 /water interface at a concentration of 3 mg/ml, pH 7.
NaCl (mM) Layer thickness
±2 Å
SLD
±0.1×10⁻⁶ Å-2
Volume fraction
±0.005
Surface Excess
±0.1 mg/m2
NR SE
5 37 5.2 0.450 2.8 3.1
44 6.2 0.060
20 38 5.2 0.410 2.7 2.9
45 6.2 0.060
50 40 5.5 0.330 2.5 2.4
40 6.1 0.100
150 44 5.7 0.255 1.9 1.8
36 6.2 0.060
0 100 200 300 400 500 600 0
1 2 3 4
SF 5-30 kDa SF 30-300k SF >300k
NaCl Concentration (mM)
Su
rf
ac
e
E
xc
e
ss
(
m
g/
m
2
)
Figure 5. Effect of NaCl concentration on the adsorption of 3 mg/ml silk fibroin measured by SE at
the silica/water interface, pH 7.
D. RSF/SDS Interaction at the SiO2/Water Interface.
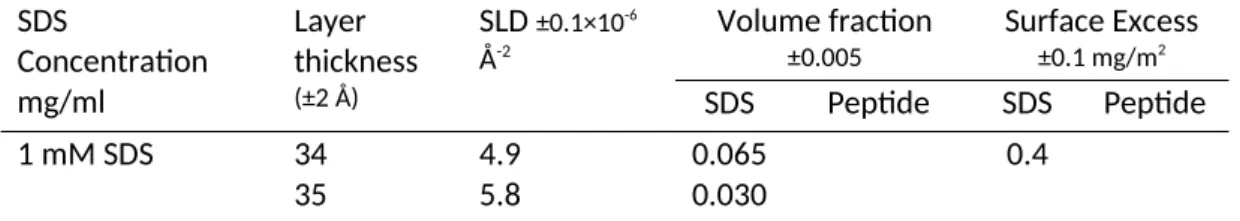
hydrophobic interactions most likely with its acyl tail buried into the RSF layer and its hydrophilic head pointing towards the bulk solution. The inner layer SLD in Table 4 falls to 4.9 × 10⁻⁶ Å-2 from 5.3 × 10⁻⁶ Å-2 found when SDS is present and the overall layer thickness falls indicating a slightly more compact layer. It was found, at 1 mM SDS, that the inner layer (thickness 34 Å) contains 42% of RSF and 6.5% of SDS while the outer layer (thickness 35 Å) contains 14% of RSF and 3% of SDS. Most of the RSF had desorbed at 10 mM SDS. The thickness of both layers had decreased and most of the remaining RSF and SDS was found in the outer layer. The inner layer (thickness 20 Å) was found to only contain 2.5% of RSF and 3% of SDS while the outer layer (thickness 16 Å) has similar RSF (11.5%) and SDS (11%). The shift in adsorbed amount and volume fraction to the outer layer highlights the desorption process of RSF from the interface and back into the bulk solution complexed with SDS (Figure 6C). The overall adsorption behaviour with an initial increase in adsorbed amount followed by gradual removal of the peptide and complete removal above CMC is consistent with systems involving SDS adsorption onto preadsorbed BSA, lysozyme and hydrophobin.36, 38, 40 For example, similarly to RSF, a two layer adsorption was reported for lysozyme adsorption with a thickness of 30 ± 3 Å for each layer and occupying 46% and 32%, respectively.38 However unlike for RSF, SDS was mainly found to occupy the outer layer with significantly less amount found in the inner most layer, indicating difficulty for the SDS to penetrate all the way and likely due to the more rigid globular structures compared to RSF. Nonetheless complete removal of lysozyme was achieved upon increasing SDS concentration.
(A)
0.1 1 10 100
0 1 2 3 4 5
SDS Concentration (mM)
Su
rf
ac
e
E
xc
e
ss
(
m
g/
m
2
(B)
0 0.02 0.04 0.06 0.08 0.1 0.12 0.14 0.16 0.18 0.2 1E-10.
1E-09. 1E-08. 1E-07. 1E-06. 1E-05. 1E-04. 1E-03. 1E-02. 1E-01. 1E+00.
Q/ Å-1
R
ef
le
ct
iv
it
y
(C)
Figure 6. (A) Final adsorption values following sequential adsorption of 3 mg/ml silk fibroin (1 hr)
and different concentrations of SDS measured by SE at the silica/water interface pH 7. (B)
Reflectivity profiles for RSF 5-30 kDa pH 7 with 1 mM SDS (□), 1 mM d-SDS (◊), 10 mM SDS (∆) and
10 mM d-SDS (o). Solid lines through the data points correspond to the best fits for the
corresponding reflectivity curves. (C) Schematic model showing the arrangement of RSF molecules
(black), SDS (red) at 1 mM and 10 mM SDS.
Table 4. Structural parameters of neutron reflection best fits for 5-30 kDa silk fibroin 3 mg/ml adsorbed for 1 hr at the SiO2 /water interface followed by SDS adsorption.
SDS
Concentration mg/ml
Layer thickness
(±2 Å)
SLD ±0.1×10⁻⁶
Å-2
Volume fraction
±0.005
Surface Excess
±0.1 mg/m2
SDS Peptide SDS Peptide
1 mM SDS 34 4.9 0.065
0.030
0.4
1 mM d-SDS 34 5.3 0.420 0.140
2.7
30 6.0
10 mM SDS 20 6.1 0.030
0.110
0.3
16 5.4
10 mM d-SDS 20 6.3 0.025
0.115
0.3
16 6.1
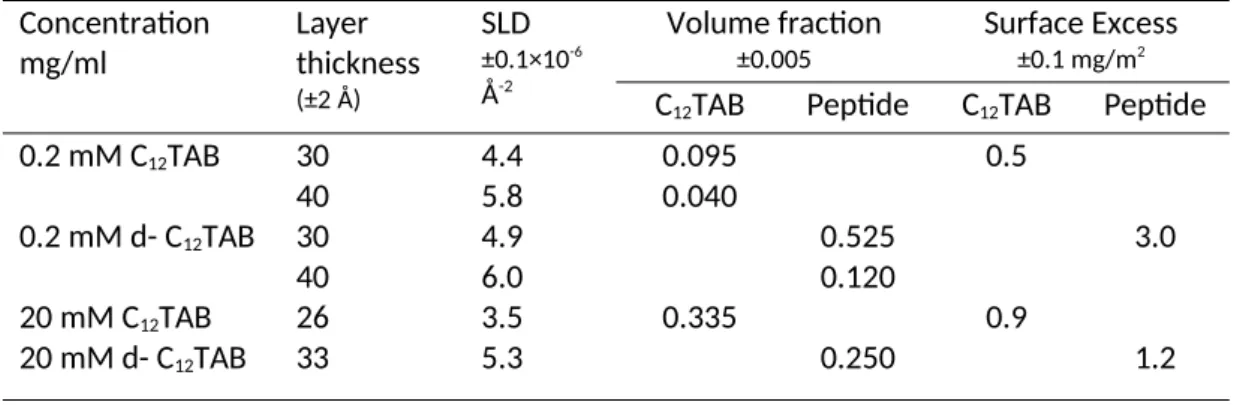
E. RSF/C12TAB Interaction at the SiO2/Water Interface.
Experiments were carried out as detailed for C12TAB. Similarly to SDS, there was an initial increase in surface absorbed amount at low surfactant concentrations, in this case up to 2 mM, following which increasing concentrations gradually reduced the absorbed amount as shown in Figure 7A. Unlike SDS however, C12TAB is known to absorb directly to the silica/water interface due to charge attraction and is therefore likely to be found in higher amounts at the interface. The SLD of C12TAB used was calculated to be -0.37 × 10⁻⁶ Å-2, whilst its deuterated version had an SLD of 5.13 × 10⁻⁶ Å -2. Fitted neutron reflectivity data shown in table 5 confirmed the presence of C
(A)
0 5 10 15 20 25
0 1 2 3 4 5
Concentration (mM)
Su
rf
ac
e
E
xc
e
ss
(
m
g/
m
2
)
(B)
0 0.02 0.04 0.06 0.08 0.1 0.12 0.14 0.16 0.18 0.2 1E-09.
1E-08. 1E-07. 1E-06. 1E-05. 1E-04. 1E-03. 1E-02. 1E-01. 1E+00.
Q/ Å-1
R
ef
le
ct
iv
it
y
Figure 7. (A) Final adsorption values following sequential adsorption of 3 mg/ml RSF (1 hr) and
C12TAB measured by ellipsometry at the silica/water interface, pH 7. (B) Reflectivity profiles for RSF
5-30 kDa pH 7 with 0.2 mM C12TAB (□), 0.2 mM d-C12TAB (◊), 20 mM C12TAB (∆) and 20 mM
d-C12TAB (o). Solid lines through the data points correspond to the best fits for the corresponding
reflectivity curves. (C) Schematic model showing the arrangement of RSF molecules (black), C12TAB
(blue) at 0.2 mM and 20 mM SDS.
Table 5. Structural parameters of neutron reflection best fits for 5-30 kDa silk fibroin 3 mg/ml adsorbed for 1 hr followed by C12TAB adsorption at the SiO2 /water interface.
Concentration mg/ml
Layer thickness
(±2 Å)
SLD
±0.1×10⁻⁶
Å-2
Volume fraction
±0.005
Surface Excess
±0.1 mg/m2
C12TAB Peptide C12TAB Peptide
0.2 mM C12TAB 30 4.4 0.095
0.040
0.5
40 5.8
0.2 mM d- C12TAB 30 4.9 0.525
0.120
3.0
40 6.0
20 mM C12TAB 26 3.5 0.335 0.9
20 mM d- C12TAB 33 5.3 0.250 1.2
4. Conclusions
causing a drastic reduction in the adsorbed amount at the interface. In addition the separation of RSF into different MW fractions by membrane ultrafiltration demonstrated that RSF >300 kDa fraction was more stable to ionic strength changes. Hence fractioning of the RSF peptides into more homogenous solutions affects the adsorption behaviour of RSF. Larger RSF molecules appear to be more stable to ionic concentration and display slower adsorption. Changes in pH, concentration and ionic strength have a similar effect on the adsorption of short amphiphilic designer peptides which were designed to have systematic tweaks in their amino acid sequence to investigate structure function relationships.21, 51-52 Overall the dominating mode of interaction at the interface appeared to be through hydrophobic interactions of the RSF molecules. The presence of these hydrophobic interactions allowed anionic SDS to adsorb at the interface alongside RSF. However, increasing the SDS content above its CMC caused the near complete removal of RSF from the interface. On the other hand, cationic surfactant C12TAB, removed a small amount of RSF and was found to coexist at the interface with a significant amount of RSF, even above its CMC. Both electrostatic and hydrophobic interactions contributed to the permanence of C12TAB with RSF at the interface allowing for greater stability. The interaction with both surfactants followed the behaviour also observed with short cationic amphiphilic peptides, biosurfactants and proteins which interact with surfactants and are seen to be gradually displaced by surfactants above the surfactant’s CMC.38-40, 53 Overall RSF shows a good adsorption affinity with the hydrophilic SiO2/water interface even in the presence of a cationic surfactant. Ultimately, these results give an important insight into how RSF adsorption can be controlled at the interface and this will have important implications for the development of applications based on interfacial adsorption of biomolecules at solid/water interfaces.
Acknowledgements
The authors would like to thank The Royal Society (RG120061 and IE150457) and EPSRC (EP/N007174/1 and EP/N023579/1) for support and ISIS Neutron Facility for beam time. Dharana Jayawardane also thanks EPSRC for a research studentship.
5. References
1. Mulligan, C. N., Environmental applications for biosurfactants. Environ Pollut 2005, 133 (2), 183-198.
2. Rodrigues, L.; Banat, I. M.; Teixeira, J.; Oliveira, R., Biosurfactants: potential applications in medicine. J Antimicrob Chemoth 2006, 57 (4), 609-618.
3. Bouyer, E.; Mekhloufi, G.; Rosilio, V.; Grossiord, J. L.; Agnely, F., Proteins, polysaccharides, and their complexes used as stabilizers for emulsions: Alternatives to synthetic surfactants in the pharmaceutical field? Int J Pharmaceut 2012, 436 (1-2), 359-378.
4. Kralova, I.; Sjoblom, J., Surfactants Used in Food Industry: A Review. J Disper Sci Technol 2009, 30 (9), 1363-1383.
5. Campos, J. M.; Stamford, T. L. M.; Sarubbo, L. A.; de Luna, J. M.; Rufino, R. D.; Banat, I. M., Microbial Biosurfactants as Additives for Food Industries. Biotechnol Progr 2013, 29 (5), 1097-1108.
7. Varvaresou, A.; Iakovou, K., Biosurfactants in cosmetics and biopharmaceuticals. Lett Appl Microbiol
2015, 61 (3), 214-223.
8. Foley, P.; Pour, A. K.; Beach, E. S.; Zimmerman, J. B., Derivation and synthesis of renewable surfactants. Chemical Society Reviews 2012, 41 (4), 1499-1518.
9. Nnanna, I. A.; Xia, J., Protein-based surfactants : synthesis, physicochemical properties, and applications. Marcel Dekker: New York, 2001.
10. Rockwood, D. N.; Preda, R. C.; Yucel, T.; Wang, X.; Lovett, M. L.; Kaplan, D. L., Materials fabrication from Bombyx mori silk fibroin. Nature protocols 2011, 6 (10), 1612-31.
11. Thurber, A. E.; Omenetto, F. G.; Kaplan, D. L., In vivo bioresponses to silk proteins. Biomaterials
2015, 71, 145-157.
12. Tao, H.; Marelli, B.; Yang, M. M.; An, B.; Onses, M. S.; Rogers, J. A.; Kaplan, D. L.; Omenetto, F. G., Inkjet Printing of Regenerated Silk Fibroin: From Printable Forms to Printable Functions. Advanced Materials 2015, 27 (29), 4273-4279.
13. Kim, D. H.; Viventi, J.; Amsden, J. J.; Xiao, J. L.; Vigeland, L.; Kim, Y. S.; Blanco, J. A.; Panilaitis, B.; Frechette, E. S.; Contreras, D.; Kaplan, D. L.; Omenetto, F. G.; Huang, Y. G.; Hwang, K. C.; Zakin, M. R.; Litt, B.; Rogers, J. A., Dissolvable films of silk fibroin for ultrathin conformal bio-integrated electronics. Nat Mater 2010, 9 (6), 511-517.
14. Lammel, A. S.; Hu, X.; Park, S. H.; Kaplan, D. L.; Scheibel, T. R., Controlling silk fibroin particle features for drug delivery. Biomaterials 2010, 31 (16), 4583-4591.
15. Perrone, G. S.; Leisk, G. G.; Lo, T. J.; Moreau, J. E.; Haas, D. S.; Papenburg, B. J.; Golden, E. B.; Partlow, B. P.; Fox, S. E.; Ibrahim, A. M. S.; Lin, S. J.; Kaplan, D. L., The use of silk-based devices for fracture fixation. Nat Commun 2014, 5.
16. Zhou, C. Z.; Confalonieri, F.; Jacquet, M.; Perasso, R.; Li, Z. G.; Janin, J., Silk fibroin: Structural implications of a remarkable amino acid sequence. Proteins 2001, 44 (2), 119-122.
17. Ha, S. W.; Gracz, H. S.; Tonelli, A. E.; Hudson, S. M., Structural study of irregular amino acid sequences in the heavy chain of Bombyx mori silk fibroin. Biomacromolecules 2005, 6 (5), 2563-2569. 18. Wray, L. S.; Hu, X.; Gallego, J.; Georgakoudi, I.; Omenetto, F. G.; Schmidt, D.; Kaplan, D. L., Effect of processing on silk-based biomaterials: Reproducibility and biocompatibility. J Biomed Mater Res B 2011,
99B (1), 89-101.
19. Pritchard, E. M.; Hu, X.; Finley, V.; Kuo, C. K.; Kaplan, D. L., Effect of Silk Protein Processing on Drug Delivery from Silk Films. Macromolecular Bioscience 2013, 13 (3), 311-320.
20. Dexter, A. F.; Middelberg, A. P. J., Peptides as functional surfactants. Ind Eng Chem Res 2008, 47 (17), 6391-6398.
21. Dimitrijev-Dwyer, M.; He, L. Z.; James, M.; Nelson, A.; Wang, L. G.; Middelberg, A. P. J., The effects of acid hydrolysis on protein biosurfactant molecular, interfacial, and foam properties: pH responsive protein hydrolysates. Soft Matter 2012, 8 (19), 5131-5139.
22. Rondel, C.; Portet, B.; Alric, I.; Mouloungui, Z.; Blanco, J. F.; Silvestre, F., Green Production of Anionic Surfactant Obtained from Pea Protein. J Surfactants Deterg 2011, 14 (4), 535-544.
23. Lam, R. S. H.; Nickerson, M. T., Food proteins: A review on their emulsifying properties using a structure-function approach. Food Chem 2013, 141 (2), 975-984.
24. Xia, J. D.; Qian, J. H.; Nnanna, I. A., Synthesis and surface properties of amino acid surfactants from industrial waste proteins. J Agr Food Chem 1996, 44 (4), 975-979.
25. Penfold, J.; Thomas, R. K.; Shen, H. H., Adsorption and self-assembly of biosurfactants studied by neutron reflectivity and small angle neutron scattering: glycolipids, lipopeptides and proteins. Soft Matter
2012, 8 (3), 578-591.
26. Esumi, K.; Ueno, M., Structure-performance relationships in surfactants. 2nd ed rev. and expanded. ed.; Marcel Dekker: New York, 2003.
27. Rabe, M.; Verdes, D.; Seeger, S., Understanding protein adsorption phenomena at solid surfaces. Adv Colloid Interfac 2011, 162 (1-2), 87-106.
28. Nakanishi, K.; Sakiyama, T.; Imamura, K., On the adsorption of proteins on solid surfaces, a common but very complicated phenomenon. J Biosci Bioeng 2001, 91 (3), 233-244.
29. Norde, W.; Horbett, T. A.; Brash, J. L., Proteins at Interfaces III: Introductory Overview. Acs Sym Ser
2012, 1120, 1-34.
31. Dickinson, E., Mixed biopolymers at interfaces: Competitive adsorption and multilayer structures. Food Hydrocolloid 2011, 25 (8), 1966-1983.
32. Adjonu, R.; Doran, G.; Torley, P.; Agboola, S., Whey protein peptides as components of nanoemulsions: A review of emulsifying and biological functionalities. J Food Eng 2014, 122, 15-27. 33. Mutilangi, W. A. M.; Panyam, D.; Kilara, A., Functional properties of hydrolysates from proteolysis of heat-denatured whey protein isolate. J Food Sci 1996, 61 (2), 270-&.
34. Zhang, S. B.; Lu, Q. Y., Characterizing the structural and surface properties of proteins isolated before and after enzymatic demulsification of the aqueous extract emulsion of peanut seeds. Food Hydrocolloid 2015, 47, 51-60.
35. Korhonen, H.; Pihlanto, A., Bioactive peptides: Production and functionality. Int Dairy J 2006, 16 (9), 945-960.
36. Lu, J. R.; Su, T. J.; Thomas, R. K., Binding of surfactants onto preadsorbed layers of bovine serum albumin at the silica-water interface. J Phys Chem B 1998, 102 (50), 10307-10315.
37. Lu, J. R.; Su, T. J.; Thomas, R. K.; Penfold, J., Binding of sodium dodecyl sulfate to bovine serum albumin layers adsorbed at the silica-water interface. Langmuir 1998, 14 (21), 6261-6268.
38. Green, R. J.; Su, T. J.; Lu, J. R.; Penfold, J., The interaction between SDS and lysozyme at the hydrophilic solid-water interface. J Phys Chem B 2001, 105 (8), 1594-1602.
39. Green, R. J.; Su, T. J.; Lu, J. R.; Webster, J. R. P., The displacement of preadsorbed protein with a cationic surfactant at the hydrophilic SiO2-water interface. J Phys Chem B 2001, 105 (38), 9331-9338. 40. Zhang, X. L.; Penfold, J.; Thomas, R. K.; Tucker, I. M.; Petkov, J. T.; Bent, J.; Cox, A., Adsorption Behavior of Hydrophobin and Hydrophobin/Surfactant Mixtures at the Solid-Solution Interface. Langmuir
2011, 27 (17), 10464-10474.
41. Ajisawa, A., Dissolution of silk fibroin with calciumchloride/ethanol aqueous solution
Studies on the dissolution of silk fibroin. (IX). The Journal of Sericultural Science of Japan 1998, 67 (2), 91-94.
42. Tang, Y.; Lu, J. R.; Lewis, A. L.; Vick, T. A.; Stratford, P. W., Structural effects on swelling of thin phosphorylcholine polymer films. Macromolecules 2002, 35 (10), 3955-3964.
43. Zhao, X.; Pan, F.; Coffey, P.; Lu, J. R., Cationic copolymer-mediated DNA immobilization: interfacial structure and composition as determined by ellipsometry, dual polarization interferometry, and neutron reflection. Langmuir 2008, 24 (23), 13556-64.
44. Nelson, A., Co-refinement of multiple-contrast neutron/X-ray reflectivity data using MOTOFIT. J Appl Crystallogr 2006, 39, 273-276.
45. Foo, C. W. P.; Bini, E.; Hensman, J.; Knight, D. P.; Lewis, R. V.; Kaplan, D. L., Role of pH and charge on silk protein assembly in insects and spiders. Appl Phys a-Mater 2006, 82 (2), 223-233.
46. Zhang, F. J.; Skoda, M. W. A.; Jacobs, R. M. J.; Martin, R. A.; Martin, C. M.; Schreiber, F., Protein interactions studied by SAXS: Effect of ionic strength and protein concentration for BSA in aqueous solutions. J Phys Chem B 2007, 111 (1), 251-259.
47. Lundin, M.; Elofsson, U. M.; Blomberg, E.; Rutland, M. W., Adsorption of lysozyme, beta-casein and their layer-by-layer formation on hydrophilic surfaces: Effect of ionic strength. Colloid Surface B 2010, 77 (1), 1-11.
48. Su, T. J.; Lu, J. R.; Thomas, R. K.; Cui, Z. F.; Penfold, J., The adsorption of lysozyme at the silica-water interface: A neutron reflection study. J Colloid Interf Sci 1998, 203 (2), 419-429.
49. Penfold, J.; Tucker, I.; Petkov, J.; Thomas, R. K., Surfactant adsorption onto cellulose surfaces. Langmuir 2007, 23 (16), 8357-8364.
50. Fragneto, G.; Thomas, R. K.; Rennie, A. R.; Penfold, J., Neutron reflection from
hexadecyltrimethylammonium bromide adsorbed on smooth and rough silicon surfaces. Langmuir 1996, 12 (25), 6036-6043.
51. Han, S. Y.; Xu, W. W.; Cao, M. W.; Wang, J. Q.; Xia, D. H.; Xu, H.; Zhao, X. B.; Lu, J. R., Interfacial adsorption of cationic peptide amphiphiles: a combined study of in situ spectroscopic ellipsometry and liquid AFM. Soft Matter 2012, 8 (3), 645-652.