Volume 2007, Article ID 89150,15pages doi:10.1155/2007/89150
Research Article
Comparison of Feature-List Cross-Correlation Algorithms with
Common Cross-Correlation Algorithms
Ralph Maschotta,1Simon Boymann,1and Ulrich Hoppe2
1Institute of Biomedical Engineering and Informatics, Ilmenau Technical University, P.O. Box 100565, 98693 Ilmenau, Germany
2Department of Audiology, University Hospital of Erlangen-Nuremberg, Waldstr. 1, 91054 Erlangen, Germany
Received 1 August 2005; Revised 20 December 2006; Accepted 21 December 2006
Recommended by Rafael Molina
This paper presents a feature-list cross-correlation algorithm based on: a common feature extraction algorithm, a transformation of the results into a feature-list representation form, and a list-based cross-correlation algorithm. The feature-list cross-correlation algorithms are compared with known results of the common cross-correlation algorithms. Therefore, simple test images
con-taining different objects under changing image conditions and with several image distortions are used. In addition, a medical
application is used to verify the results. The results are analyzed by means of curve progression of coefficients and curve
pro-gression of peak signal-to-noise ratio (PSNR). As a result, the presented feature list cross-correlation algorithms are sensitive to all changes of image conditions. Therefore, it is possible to separate objects that are similar but not equal. Because of the high quantity of feature points and the strong PSNR, the loss of a few feature points does not have a significant influence on the detection results. These results are confirmed by a successfully applied medical application. The calculation time of the feature list cross-correlation algorithms only depends on the length of the feature-lists. The amount of feature points is much less than the number of pixels in the image. Therefore, the feature-list cross-correlation algorithms are faster than common cross-correlation algorithms. Better image conditions tend to reduce the size of the feature-list. Hence, the processing time decreases considerably.
Copyright © 2007 Ralph Maschotta et al. This is an open access article distributed under the Creative Commons Attribution License, which permits unrestricted use, distribution, and reproduction in any medium, provided the original work is properly cited.
1. INTRODUCTION
The two-dimensional cross-correlation is a simple and ro-bust algorithm used to solve different problems in the field of image processing. However, when images are rotated, scaled, or include other image distortions the computation time increases considerably. Furthermore, extensive changes in brightness, contrast, or strong outliers cause false results [1]. Because of this, optimized algorithms have been de-veloped, namely, the cross-correlation algorithm based on least squared error [2], the block-matching algorithms [3], techniques based on the Fourier transform [4], wavelet-based techniques [5], and feature-based techniques [2,6–10]. These algorithms are used for many problems such as mo-tion estimamo-tion [11], video coding [12], target detection [13], character recognition [8], image registration [14], or image fusion [15]. In [16], a summary of visual tracking techniques and problems with focus on motion estimation in log-polar images is presented. Some references for motion estimation on Cartesian images can be found in [17].
Similar to [6,18,19], in this paper single feature points are saved in a feature list, along with their positions and the value of the feature. In contrast to the earlier described methods where single selected points with certain features were used, this paper presents a threshold-based selection of the feature points. Additionally, the proposed method allows the use of simple feature extraction algorithms such as Canny or Laplace of Gaussian edge detection [20,21]. The applicability is shown for the Sobel operator. However, other feature extraction algorithms are also possible [9,22,23].
interpreted as a special case of the Radon transform [18,19]. Hence, usually binary images are used instead. The literature also presents improvements of the Hough transform or Radon transform with respect to the cross-correlation [19, 26, 27]. In this paper, cross-correlation between two grayscale images is in the focus of the analysis. Secondly, the generalized Hough transform uses a reference table that characterizes a template shape [28,29], which is accurately selected while the presented algorithm initially uses the whole image and all gray-scale values. It is only due to the attenuation of the processing effort that simple feature-values are used. Also different forms of cross-correlation are analyzed. The binary cross-correlation is similar to cross-correlation using the Hough transform. But different possibilities for measuring the difference values for the cross-correlation are not considered. This paper considers as an example an algorithm based on the difference. Other distance measurements such as mean-squared error are possible, by using the list-based cross-correlation. Thirdly, in [19,26] the relation between the Radon transform and the cross-correlation is shown. However, in these works only the template is transformed into another representation form and the pixel representation of the image remains unaffected. The calculation is performed for all the pixels in the image. In this paper, the template and the image are transformed into a list representation form. The list-based algorithms only use these lists to calculate a two-dimensional cross-correlation.
Zero values do not contribute to the result of a cross-correlation. Therefore, only image points above a threshold are used and only these required positions are calculated. This is also a major advantage of a technique called image point mapping, which is presented in [24]. This image point mapping is used to calculate the discrete generalized Radon transform.
In this paper, the feature-list cross-correlation algo-rithms are compared with the common cross-correlation algorithms. In the following section, the principle of the list-based cross-correlation algorithm is presented and the feature-list cross-correlation algorithm is described. The methods of comparison used and the test images with partic-ular image distortions are presented afterwards. Additionally, a medical application is described, which is used to verify the results of the different algorithms. The results and the discus-sion are presented afterwards.
2. ALGORITHMS AND METHODS
2.1. List representation of images
In the field of image processing, a digital imagebcan be de-fined as a two-dimensional array of colour pointsv(pixels). The positions of the pixels are determined by the topology. Thus, it is possible to access every pixel by theirxandy co-ordinates (1),
b[x,y]=v. (1) An image can also be defined as a sorted sequence of pix-els. It can be transformed into this vector-based
representa-tion form without losing any informarepresenta-tion (2),
b[i]=b[x,y]=v,
i=y·Nb+x,
Nbnumber of columns.
(2)
In this case, it is necessary to know the sizeNb andMb
of the image. This form is usually used to implement image processing algorithms.
Another possible way of representing images can be de-scribed as a list-based representation form. It describes the image as an unsorted list of vectors, where every vector con-tains the position and value of the different parameters at this position (3),
bx[n]=x,
by[n]=y,
bv[n]=b[x,y],
Nbnumber of columns,Mbnumber of rows where x=1· · ·Nb, y=1· · ·Mb,n=1· · ·Nb·Mb.
(3)
The position of a pixel can also be negative. This is useful for some image operations. In the literature, similar forms are also used as parameter vectors or parameter tables [6,19,27,28]. In this paper, the coordinates of the pixel and its intensity value or its absolute gradient value are used. For the list-based algorithms, all source and template images are transformed into this form of representation. The sizeNand
Mof the image can be computed by the maximum and the minimum of thexandypositions (4),
Nb=maxbx[n]−minbx[n]+ 1,
Mb=maxby[n]−minby[n]+ 1.
(4)
By using this list-based form, any image operation can be performed. In this paper, the list-based representation form is used to compute the two-dimensional cross-correlation, which is described in the following section.
2.2. List-based cross-correlation algorithm
In discrete space, the two-dimensional cross-correlation al-gorithm (CCA) is defined as
g[x,y]=
j,i
h[i,j]b[x+i,y+j],
where x=1· · ·Nb; y=1· · ·Mb,
i= −
Nh−1
2 · · ·
Nh−1
2 ,
j= −
Mh−1
2 · · ·
Mh−1
2 for x=1· · ·Ng, y=1· · ·Mg,
whereMb×Nbis the size of the source image,Mh×Nhis the
size of the template image, andMg×Ngis the size of the
re-sulting image. It is necessary to calculate (5) for each pixel of the result imageg. The computation time of this algorithm depends on the size of both imagesbandh. Hence, the algo-rithm needsO(Nb·Mb·Nh·Mh) computation time.
In [26], the generalized Radon transform is used to calcu-late the cross-correlation.1In [24], the image point mapping technique (IPM) is presented, to calculate the Radon trans-form. These are the fundamentals for the feature-list cross-correlation algorithm. The IPM technique uses the discrete generalized Radon transform, which can be defined as fol-lows (6):
g(l)=
M−1
i=0
N−1
j=0
b[i,j]δj−φ(i;l),
where δ(x)= ⎧ ⎨ ⎩
1 forx=0, 0 for =0,
l=l1,l2,. . .,lη
,
(6)
wheregdenotes the discrete generalized Radon transform of
b[i,j] andldenotes aη-dimensional discrete index param-eter vector andδ(x) denotes the Kronecker delta function. Finallyφ(i;l) denotes a discrete index transformation curve, where j=φ(i;l). The IPM technique calculates the summa-tion only for image values different from zero and only for possible vectorslr,2
g[x,y]=
Sb
i=1
Sh
j=1
ci,j·Px,y,i,j,
where ci,j=bv[i]·hv[j],
Px,y,i,j=δx−bx[i]−hx[j]
·δy−by[i]−hy[j]
Sb=Nb·Mb,
Sh=Nh·Mh
for x=1· · ·Ng, y=1· · ·Mg.
(7)
In this paper, this IPM technique is used to calculate the coefficients of the cross-correlationg[x,y] directly. Further-more, only images in the list-based representation form (3) are used. Hence, the source imageband the template image
hare transformed into this representation form. To calculate the cross-correlation by using the IPM technique, a function
φis defined to calculate the position where the measurement of the distance value of the cross-correlation, denoted asci,j, has an influence on the result matrixg[x,y]. This function is denoted asPx,y,i,j. Hence, the cross-correlation algorithm
1For the definition of the Radon transform, please see [19,24–26]. 2For detailed information see [24].
can be transformed into the list-based cross-correlation al-gorithm (7). Every entry in the image list is calculated with every entry of the template list. The measurement of the dis-tance value of the cross-correlation ci,j can be replaced by other measurements such as least-square error, normed dis-tance measurements or others. In this paper, a binary and a difference-based measurements are additionally used (see
Section 2.4). Because of the length of the source image-list of
Nb·Mb and the size of the template image-list ofNh·Mh,
the list-based cross-correlation algorithm needsO((Nb·Mb·
Nh·Mh)·Ng·Mg) computation time.
By examining formula (7) it can be concluded that the summation at positiong[x,y] is only necessary forP = 0. These positions whereP=0 can be calculated as follows:
x=bx[i]−hx[j],
y=by[i]−hy[j].
(8)
At these positions the product ofbv[i] andhv[j] can be
added up to a summation matrix. Hence, this algorithm de-pends only on the size of the image lists ofbandh. It needs onlyO(Nb·Mb·Nh·Mh) computation time. However, the
algorithm requires extra time for each operation to calculate the positions. But compared to CCA (5), only two loops are necessary to process the whole image.
The presented algorithm will only be useful if the compu-tation can be further optimized. In [24], each computation for image points with a value of zero is omitted. By investi-gating formula (7), it can be concluded that the product of
bv[i] andhv[j] only has influence on the result if both values
are nonzero (9),
ci,j= ⎧ ⎪ ⎨ ⎪ ⎩
0 forbv[i]=0∨hv[j]=0,
bv[i]·hv[j] otherwise.
(9)
Hence, it is possible to drop every value equal to zero from the image lists and the template lists. This reduces the list size of the imagesSb andSh. The size of the image list
is now independent of the image size. It only depends on the length of the image list, which depends on the contents of the image. In any case, the list-based cross-correlation algorithm needs onlyO((Sb·Sh)) computation time.
Additionally, it is possible to transform the formulas above into the vector-based representation form, as pre-sented in (2). Hence, the memory required for the image-lists and the computation effort required to calculate the position decrease.
2.3. Feature list
robust with respect to the noise and changing image condi-tions which have a major influence on the correlation results. In this paper, the 3×3 Sobel operator [20,21] is used in the horizontal and vertical directions with signed result values. The Sobel operator has been chosen to demonstrate the assets and drawbacks of feature-based cross-correlation algorithms. In [23], additional feature extraction algorithms for feature list cross-correlation algorithms are analyzed for detecting blood vessels in human retinal images. In this anal-ysis, the Sobel operator obtained good results. In this paper, the signed results of the Sobel operator in both directions are only transformed into the feature list representation form (3) if the absolute feature value exceeds a constant predefined threshold value. Finally, both feature lists have to be concate-nated. The use of the gradient and magnitude values of the edge is suggested for practical applications.
2.4. Cross-correlation algorithms
In the field of image processing, cross-correlation algorithms are used in different variations. Multiplication can, for ex-ample, be replaced by calculating the difference, the mean-squared error, the absolute error, or the median mean-squared er-ror [2,16,17,20,34,35]. The CCA as defined in (5) is robust with regard to noise. However, a bright spot will have a strong influence on the result [7,35]. By using subtraction, the algo-rithm becomes robust with regard to single outliers but sen-sitive with regard to noise. Normalized cross-correlation co-efficient [35] and empirical cross-correlation algorithms ob-tain better results [36]. These algorithms use the local mean value or the local variance value. Therefore, these algorithms require more computational effort. But there exist alterna-tive implementations for a fast normalized cross-correlation [35]. This implementation reduces the computational effort.
In contrast, binary cross-correlation [1,37] is fast but the re-sults are worse.
The influence of varying image conditions, changing object forms, and image contents on the results of com-mon cross-correlation algorithms has already been analyzed (see [1]). In any case, in this paper, the common cross-correlation algorithms, more precisely the cross-cross-correlation algorithm (CCA) (5) and the normalized cross-correlation algorithm (NCCA) (10) [34], are compared to three dif-ferent feature-list cross-correlation algorithms. These algo-rithms are the feature-list cross-correlation algorithm (FLA) (7), the feature-list cross-correlation algorithm using diff er-ence values (DFLA) (13), and the binary feature-list cross-correlation algorithm (BFLA) (11), which is similar to the cross-correlation using the Hough transform,
g[x,y]
=
j,ihi+Nh−1/2,j+Mh−1/2b[x+i,y+j]
j,ih[i,j]2u,vb[x+u,y+v]2
for x=1· · ·Nb; y=1· · ·Mb,
i= −
Nh−1 2 · · ·
Nh−1
2 ,
j= −
Mh−1
2 · · ·
Mh−1
2 ,
u= −
Nb−1
2 · · ·
Nb−1
2 ,
v= −
Mb−1
2 · · ·
Mb−1
2 .
(10)
In formula (9), the condition for reducing the size of the feature list is shown. By using a reduced feature list, all feature-list cross-correlation algorithms have to take this condition into account, which is added to BFLA and DFLA. Hence, the behavior of these algorithms differs from that of common binary or difference algorithms,
ci,j=
⎧ ⎨ ⎩
0 forbv[i]=0∨hv[j]=0,
1 otherwise, (11)
ci,j=
⎧ ⎨ ⎩
0 forbv[i]=0∨hv[j]=0, bv[i]−hv[j] otherwise. (12)
In contrast to other cross-correlation algorithms, algo-rithm (12) achieves best matches at the minimum value. Therefore, its results are subtracted from the maximum value of the image (13). In this paper, a constant maximum value of 255 is used,
ci,j= ⎧ ⎪ ⎨ ⎪ ⎩
0 forbv[i]=0∨hv[j]=0,
max(bv)−bv[i]−hv[j] otherwise.
(13)
2.5. Evaluation
To evaluate and compare the results of the different feature-list cross-correlation algorithms, several tests using different artificial images, templates, image parameters, image distor-tions, and evaluation parameters are run. Two simple objects, a circle and a triangle, are used as an image and as a tem-plate. In previous analysis [38], these templates have shown the most differing results. In other common analysis of cross-correlation algorithms (e.g., see [1]), also the brightness and contrast of the images are modified, the images are scaled, blurred, and degraded by noise. In addition to these analyses in this paper, a template is searched which is not present in the image.
The coefficients of the cross-correlation algorithms and the peak signal-to-noise ratio (PSNR) are compared for all kind of distortions.
To validate the former results considering real images, a medical application is used. Therefore, different templates of different sizes are searched in human retinal blood vessel im-age series to calculate the imim-age displacement. The number of incorrect detected templates is compared.
2.5.1. Test images
1 2 3 4 5 6 7 8 9 10 11 12 13 14 15 16 17 18 19 20 21
Figure1: Example of a test image of triangles with changed brightness. The original image is the 7th image.
same size are used. The size of the equilateral triangle is de-termined by the size of the wrapped circle. The diameter of this wrapped circle is 81 pixels. The centre point of the trian-gle is in the middle of the image. Both objects have a gray-scale value of 128. This value allows the brightness to be in-creased. The size of the template is 91×91 pixels. It is de-termined by the size of the object and a border of 5 pixels. The border is used to allow different convolution matrix sizes for the feature extraction algorithm and to avoid the related marginal problem. For the feature-list cross-correlation al-gorithms, the feature-lists are created first. The lengths of the feature-lists of the templates are about 900 feature points for the triangle template and about 1100 feature points for the circle template. Hence, the length of the feature list is about 8 times smaller than the template image.
One test image for each kind of image modification has been created. That is why the effect of a single variations can be analyzed separately. Every test image consists of 21 diff er-ent object images. These object images, having been changed iteratively, are arranged horizontally. The object image size is 293×293 pixels. It is derived from the maximum object size of 101 pixels, plus a border of 5 pixels, plus two times the size of the template. The maximum object size depends on the maximum scaling value (seeSection 2.5.4). An addi-tional border of the size of the template minus one divided by two, determines the test image size to be 6243×383 pixels. Due to all the borders adding space, the results of the cross-correlation for each modification are independent of the re-sults of the neighbouring objects. InFigure 1, an example of a test image is shown.
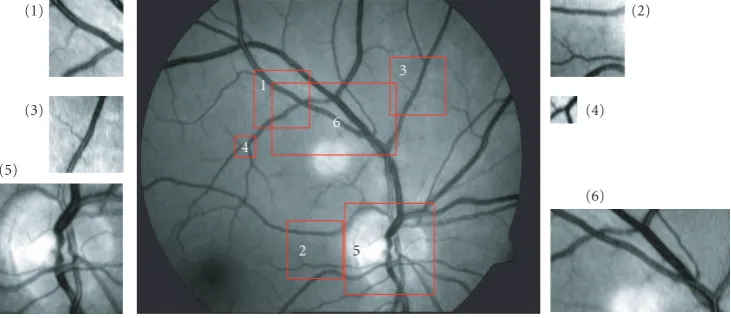
For the medical application, the human retinal blood ves-sel image series from five test persons (seeFigure 2) [23,39] are used.3The image series includes 21 to 26 single grayscale fundus images of five healthy subjects. The images have a size of 768×576 pixels. These images are of good quality as short flashes were used as the fundus illumination. In addition, an optical green filter of 560 nm is used. In total, 119 med-ical images were analyzed. The first image of each series is used to extract different templates with different sizes. Three medium templates with a size of 100×100 pixels, one small template with a size of approximately 40×40 pixels and two large templates of approximately 250×150 pixels are used
(seeFigure 2).
2.5.2. Evaluation measures
The coefficients of the cross-correlation have a different range of values. The normalized cross correlation has a range
3The image series has been recorded by the VisualIS system for digital fun-dus imaging (thanks to Imedos GmbH, Jena, Germany).
of values between zero and one. For comparing the results, the coefficients are normalized by the size of the template or by the length of the feature list. It is possible that one edge point exists in the feature list twice, because the results of the Sobel operator in that horizontal and vertical directions are stored. Therefore, the coefficients of the list-based cross-correlation algorithms are sometimes greater than one.
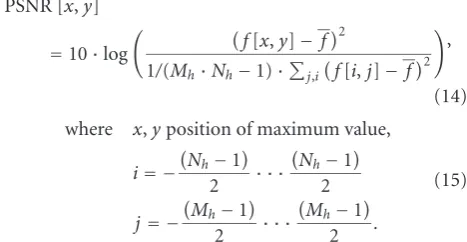
In addition to the coefficients, the peak signal-to-noise ratio (14) is also calculated,
PSNR [x,y]
=10·log
f[x,y]−f2
1/(Mh·Nh−1)·j,if[i,j]−f2
,
(14)
where x,yposition of maximum value,
i= −
Nh−1
2 · · ·
Nh−1
2
j= −
Mh−1
2 · · ·
Mh−1
2 .
(15)
The result region is determined by the corresponding modification step and has the same size as the template (Mh×Nh). For each modification step, the value in the middle of the result region is used as the peak value for the PSNR cal-culation. Sometimes, the maximum value is not in the mid-dle of the result region, where it should be, due to the sym-metry of the templates. This information is evaluated and presented as markers in the result graphs (e.g., seeSection 3,
Figure 7).
2.5.3. Variation of image conditions
To analyze the behavior of the different cross-correlation al-gorithms, the image conditions are changed in various ways. The first test image is distorted by noise. Therefore, for every modification step the object image is added up with uniformly centred distributed noise varying in intensity from 0 to 200 percent of the maximum grayscale value. Ten of these test images were created to reduce the variance of the results. The mean value and the standard deviation of the re-sults were analyzed (e.g., seeFigure 4).
Furthermore, the brightness and contrast were changed by linear scaling (16),
g[x,y]=b[x,y] +c1
∗c2. (16)
(1)
(3)
(5)
(2)
(4)
(6)
1
2
3
4
6
5
Figure2: Example of retinal fundus image with the selected templates: (1)–(3) medium template (100×100 pixels); (4) small template
(40×40 pixels); (5) large template which includes the optic nerve (180×180 pixels); (6) large template (240×140 pixels).
1 2 3 4 5 6 7 8 9 10 11 12 13 14 15 16 17 18 19 20 21
1 2 3 4 5 6 7 8 9 10 11 12 13 14 15 16 17 18 19 20 21
Figure3: Example results of different cross-correlation algorithms (top—CCA; bottom—FLA). The test image contains triangles varying in
brightness (seeFigure 1). The 7th image shows the result for the original image. High coefficients are black, low coefficients are white.
the object and the background were changed. The difference between the gray value between object and background re-mained constant. In the last part, from 125 to 250, only the colour of the background was changed. The distance between object and background influences the values of the feature extraction. We expect a significant effect of this variation on the results of the feature-list cross-correlation algorithms.
In the next test image, the contrast was changed by vary-ingc2from 9 to 189 percent. In all variations, only the object gray-scale value was changed in 21 steps from 11 to 240.
2.5.4. Change of object form
The modification of the object image was also analyzed. To do so, the object was scaled using the nearest neighbor scal-ing algorithm in 21 steps from a diameter of 61 to 101 pixels. The size of the triangle changed appropriately with the diam-eter of the wrapped circle. The centre point was kept in the middle of the object.
Another test image includes blurred objects, which are generated using a box filter with different mask sizes from 1 to 41 pixels.
In most applications, different objects can easily be sep-arated or distinguished. That is why, as a last variation, the correlation results using deviant templates are analyzed. Therefore, the scaling test images (seeFigure 1) are corre-lated with the template which is not in the actual image.
2.5.5. Medical application
For the final test, the incorrectly detected templates in the human retinal blood vessel image series are counted. Hu-man retinal images are used, because these fundus images have a high individual reproducibility and do usually not change even over longer time intervals. The maximum po-sition in the result of the cross-correlation is assumed to be the detected template position. The position of the templates and the displacement for each image of the image series are known. The template is incorrectly detected if the distance of the detected template position in thexorydirections is greater than 5 pixels from the known position.
In addition, the computational effort for all tests are mea-sured. For the medical application, in addition to the time required for all images, the time required with respect to the template size is analyzed.
3. RESULTS
Figure 3 illustrates the result coefficients of CCA and FLA
for an exemplary test image that shows triangles varying in brightness. Obviously, the feature-list cross-correlation is more sensitive with regard to changing brightness.
0 20 40 60 80 100 120 140 160 180 200 0
0.2 0.4 0.6 0.8 1 1.2
Noise in % of maximum gray value
Co
e
ffi
cien
ts
Circle with noise (average standard deviation: 0.0064)
CCA NCCA FLA
DFLA BFLA
0 20 40 60 80 100 120 140 160 180 200 0
0.2 0.4 0.6 0.8 1 1.2
Noise in % of maximum gray value
Co
e
ffi
cien
ts
Triangle with noise (average standard deviation: 0.0072)
CCA NCCA FLA
DFLA BFLA
0 20 40 60 80 100 120 140 160 180 200 0
5 10 15 20 25 30
Noise in % of maximum gray value
PS
NR
PSNR circle with noise (average standard deviation: 0.59)
CCA NCCA FLA
DFLA BFLA
0 20 40 60 80 100 120 140 160 180 200 0
5 10 15 20 25 30
Noise in % of maximum gray value
PS
NR
PSNR triangle with noise (average standard deviation: 0.65)
CCA NCCA FLA
DFLA BFLA
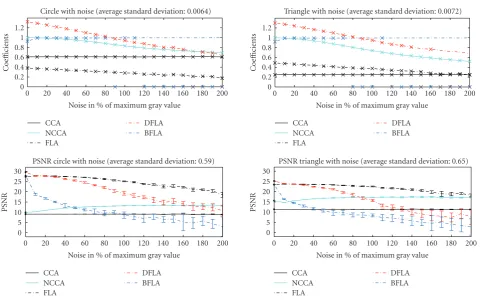
Figure4: Influence of changes in noise on the coefficients and the PSNR of the cross-correlation algorithms. Top: coefficients of the
correla-tion algorithms, (marker—the correct posicorrela-tion always detected); bottom: PSNR and standard deviacorrela-tion of the cross-correlacorrela-tion algorithms; left: results of the circles; right: results of the triangles.
Figure 4). The figures at the top illustrate the coefficients of
the cross-correlation algorithms. In addition, the validation of the maximum position is visualized. If the maximum po-sition is located in the centre of the object, a marker is dis-played on the curve. The coefficients of the cross-correlation measures are differently normalized, a comparison of the val-ues is not suggestive. However, the curve progression can be analyzed.
The graphs at the bottom show the PSNR. The results of the feature-list cross-correlation algorithms are sometimes negative. In this case, the graphs are truncated. The graphs on the left show the results of the images with circles. The graphs on the right show the results of the images with triangles.
3.1. Variation of image conditions
The influence of noise on the correlation results is shown in
Figure 4. Due to the sensitivity of the feature extraction
al-gorithm concerning noise and the lower amount of values for the calculation, we expected that the feature-list cross-correlation algorithms are more sensitive to noise than the common cross-correlation algorithms. This assumption is confirmed by the results. The coefficients of FLA, DFLA, and NCCA decrease with increasing noise. The other coefficients remain more or less constant. This curve progression is inde-pendent of the form of object used. For up to 80 percent of all algorithms and all objects, the position of the maximum
value agrees with the object position. The standard deviation of the coefficients is very low for all algorithms.
The PSNR of all feature-list cross-correlation algorithms also decreases with increasing noise (see Figure 4bottom). The PSNR of the BFLA and the DFLA decreases more strongly than the PSNR of the FLA. But the values for the PSNR of the feature-list cross-correlation algorithms is up to three times higher than those of common cross-correlation algorithms. The PSNR of the FLA and the DFLA are higher than common cross-correlation algorithms for up to 90 per-cent noise. Due to the decreasing variance of the results of the NCCA, the PSNR of the NCCA increases slightly.
The standard deviation of the PSNR rises with increasing noise for all algorithms. With the BFLA and the DFLA, it rises even faster than with other algorithms. The FLA and the CCA always detected the correct position. The BFLA lacks position accuracy.
The influence of altering brightness on the results of the analyzed cross-correlation algorithms is shown inFigure 5. The BFLA is robust concerning varying brightness, as the bi-nary images remain the same. The results of the other algo-rithms vary widely. In the first section, wherec1 is between −108 and 0 and the background is constant, the coefficients of the FLA, the DFLA, and the CCA are rising, while those of the NCCA remain constant. In the second section, where
−100 −50 0 50 100 150 200 0
0.2 0.4 0.6 0.8 1 1.2
c1
Co
e
ffi
cien
ts
Circles with different brightness
CCA NCCA FLA
DFLA BFLA
−100 −50 0 50 100 150 200
0 0.2 0.4 0.6 0.8 1 1.2
c1
Co
e
ffi
cien
ts
Triangles with different brightness
CCA NCCA FLA
DFLA BFLA
−100 −50 0 50 100 150 200
0 5 10 15 20 25 30
c1
PS
NR
PSNR circles with different brightness
CCA NCCA FLA
DFLA BFLA
−100 −50 0 50 100 150 200
0 5 10 15 20 25 30
c1
PS
NR
PSNR triangles with different brightness
CCA NCCA FLA
DFLA BFLA
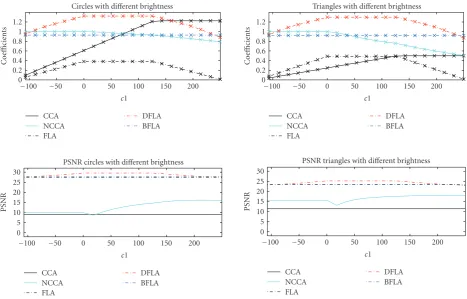
Figure5: Influence of changes in brightness on the coefficients and the PSNR of the cross-correlation algorithms (change ofc1 (16)). Top:
coefficients of the correlation algorithms, (marker—correct position found); bottom: PSNR of the correlation algorithms; left: results of the
circles; right: results of the triangles.
and the DFLA also remain constant. While only the coeffi -cients of the CCA are still rising, those of the NCCA begin to fall. In the last section, wherec1 is between 125 and 250 and only the background is changed, the coefficients of the FLA and the DFLA are falling, the coefficients of the CCA remain constant, and those of the NCCA are still falling. The curve progression of the coefficients of the FLA and the DFLA can be explained by the result values of the feature extraction. Because of the varying difference between object and back-ground, the value of the extracted feature values are chang-ing.
The PSNR of the FLA, the BFLA, and the CCA are approximately constant (see Figure 5 bottom). The DFLA shows the same curve progression for the PSNR values as for the coefficients. The PSNR of the NCCA depends on the variance of the coefficients around their maximum. With in-creasing brightness, this decreases. Therefore, the result of the PSNR of the NCCA rises if the background colour rises.
For all algorithms, the correct position has been detected for all levels of brightness. The difference between the ana-lyzed objects is marginal.
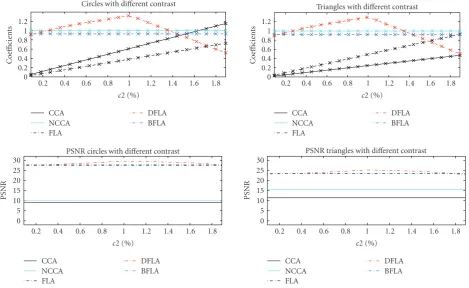
Changing the contrast also leads to correct position de-tection by all algorithms (seeFigure 6). The differences in the results between the analyzed objects are also minimal. The coefficients of the BFLA and the NCCA are approximately constant while they rise with the FLA and the CCA. Only the
coefficients of the DFLA have their maximum values at the position of the unchanged image. The same is true for the PSNR of the DFLA. The PSNR values of all other algorithms are approximately constant when varying the contrast.
3.2. Change of object form
Figure 7shows the results of changing the size of the analyzed
objects. Where object and template have the same size, the coefficient of all algorithms, except those of the CCA, have a single maximum at the correct position at the centre of the objects. With the triangular object, the peak is not as strong as for the circle object. In those cases where the triangular ob-ject is scaled larger than the template, the template is located inside, at top of the triangle. This leads to constant coeffi-cients for the CCA, but to incorrect positions.
The PSNR of all algorithms also has the maximum value when object and template are of the same size (see
Figure 7bottom). Again, feature-list cross-correlation
0.2 0.4 0.6 0.8 1 1.2 1.4 1.6 1.8 0
0.2 0.4 0.6 0.8 1 1.2
c2 (%)
Co
e
ffi
cien
ts
Circles with different contrast
CCA NCCA FLA
DFLA BFLA
0.2 0.4 0.6 0.8 1 1.2 1.4 1.6 1.8 0
0.2 0.4 0.6 0.8 1 1.2
c2 (%)
Co
e
ffi
cien
ts
Triangles with different contrast
CCA NCCA FLA
DFLA BFLA
0.2 0.4 0.6 0.8 1 1.2 1.4 1.6 1.8 0
5 10 15 20 25 30
c2 (%)
PS
NR
PSNR circles with different contrast
CCA NCCA FLA
DFLA BFLA
0.2 0.4 0.6 0.8 1 1.2 1.4 1.6 1.8 0
5 10 15 20 25 30
c2 (%)
PS
NR
PSNR triangles with different contrast
CCA NCCA FLA
DFLA BFLA
Figure6: Influence of changes in contrast on the coefficients and the PSNR of the cross-correlation algorithms (change ofc2 in percent (16)).
Top: coefficients of the cross-correlation algorithms, (marker—correct position found); bottom: PSNR of the cross-correlation algorithms;
left: results of the circles; right: results of the triangles.
The more the image is blurred, the more the coefficients of all algorithms, except those of the BFLA decrease (see
Figure 8). The coefficients of the BFLA increase a little bit
with increasing blur.
The PSNR of all feature-list cross-correlation algorithms is decrease strongly if the object is blurred (see Figure 8
bottom). The PSNR of the common cross-correlation algo-rithms is decrease slightly. The feature-list cross-correlation algorithms only find the correct position as long as the image is lightly blurred.
In addition to the distortions described before a template which is not present in the image is searched. In Figure 9
the results are visualized. In this case, the coefficients of the feature-list cross-correlation algorithms are 80 percent smaller than the results when the searched object and tem-plate are the same. The coefficients of the other algorithms are higher than the results of the feature-list algorithms as they are only decreased by 20 percent. The position of the maximum coefficient is seldom at the central position. This is obvious, because the templates are not in the image. In any case, the CCA and the NCCA sometimes have their maxi-mum values at the central position.
The PSNRs of the feature-list cross-correlation algo-rithms are decreased as well as the PSNRs of the other al-gorithms (seeFigure 9bottom), while those of the feature-list cross-correlation algorithms decrease more than those of the others. The curve progressions of the feature-list
cross-correlation algorithms are definitely different from the cor-responding curve progressions of the scaling objects (see
Figure 7).
3.3. Medical application
InFigure 11, the total amount of errors for all templates and
all images is shown. The results of the medical application partially confirmed the results of the analytic images. The CCA has the largest amount of errors. Only the large tem-plates are sometimes detected. The results of the NCCA are clearly better than those of the CCA. The FLA is derived from CCA. This could explain why that this algorithm also has a high amount of errors. This large amount of errors in relation to the other feature-list cross-correlation algorithms is unexpected because the results of the former analysis gets better results. On the other hand, the results of the BFLA are better than expected. By using medium and large templates, the DFLA and the BFLA have the lowest amount of errors. On the other hand, by using small templates, the NCCA has the minimal amount of errors (see Figure 10). But overall, the DFLA achieves the best results (seeFigure 10).
3.4. Computational effort
65 70 75 80 85 90 95 100 0
0.2 0.4 0.6 0.8 1 1.2
Diameter in pixel
Co
e
ffi
cien
ts
Circles with different size
CCA NCCA FLA
DFLA BFLA
65 70 75 80 85 90 95 100
0 0.2 0.4 0.6 0.8 1 1.2
Diameter in pixel of the wrapped circle
Co
e
ffi
cien
ts
Triangles with different size
CCA NCCA FLA
DFLA BFLA
65 70 75 80 85 90 95 100
0 5 10 15 20 25 30
Diameter in pixel
PS
NR
PSNR circles with different size
CCA NCCA FLA
DFLA BFLA
65 70 75 80 85 90 95 100
0 5 10 15 20 25 30
Diameter in pixel of the wrapped circle
PS
NR
PSNR triangles with different size
CCA NCCA FLA
DFLA BFLA
Figure7: Influence of changing object size on the coefficients and the PSNR of the cross-correlation algorithms. The size is specified as
the diameter of the object wrapped circle in pixels. Top: coefficients of the cross-correlation algorithms, (marker—correct position found);
bottom: PSNR of the cross-correlation algorithms; left: results of the circles; right: results of the triangles.
are implemented in C++ by using a signal processing frame-work [40] and the intel performance library [34]. Using a currently standard PC, this implementation of the CCA and the NCCA requires about 37 seconds without optimization. The time needed for the feature list algorithms depends on the length of the feature list. Omitting the noisy and blurred images, this size is constant. Therefore, the processing time for the feature list algorithms is constant, at about one to two seconds. Hence, the algorithms are 12 to 50 times faster than the common cross-correlation algorithms. But this is valid only for these analytic examples. Noise and blur lead to a considerably increasing feature-list size. Therefore, the feature-list cross-correlation algorithms require about 2 to 10 seconds for the blurred images and 26 to 190 seconds for the noisy images. The FLA requires the highest processing time, which is about 170 to 210 seconds for the same images.
The processing time for the medical images also de-pends on the size of the template. All the algorithms require more processing time for large templates than for small tem-plates. For the CCA and NCCA, the processing time is ap-proximately the same. The results of the feature-list cross-correlation algorithms are strongly varying. The FLA re-quires the most processing time, but only for the large tem-plates. The feature-list cross-correlation algorithms are up to 12 times faster than the common cross-correlation algo-rithms. By using other feature extraction algorithms such as the Canny operator [30], the feature list cross-correlation
al-gorithms are even up to 14 times faster than common cross-correlation algorithms [23].
4. DISCUSSION
As is well known, the CCA is robust with respect to noise. The increase of brightness or contrast caused the coefficients to increase, but the PSNR to remain constant. Smaller objects have smaller coefficients. Larger objects result in the same co-efficients as for the unchanged object. By changing the size and by increasing the blur, the PSNR hardly decreases. The difference between the two analyzed objects is minimal. This algorithm only detects large templates in the medical images. The computation time required depends on the image and the template size and is constant, if the image sizes are con-stant.
As is also known from literature, the NCCA is robust con-cerning changes of brightness and contrast. Increasing noise causes falling coefficients but constant PSNR. The change of the object form also has an influence on the coefficients and the PSNR. The unchanged object mostly corresponds to the maximum value. By using the medical images, this algorithm obtains the best results for small templates. The computation time required is also constant.
5 10 15 20 25 30 35 40 0
0.2 0.4 0.6 0.8 1 1.2
Size of convolution mask in pixel
Co
e
ffi
cien
ts
Circles with different blur
CCA NCCA FLA
DFLA BFLA
5 10 15 20 25 30 35 40
0 0.2 0.4 0.6 0.8 1 1.2
Size of convolution mask in pixel
Co
e
ffi
cien
ts
Triangles with different blur
CCA NCCA FLA
DFLA BFLA
5 10 15 20 25 30 35 40
0 5 10 15 20 25 30
Size of convolution mask in pixel
PS
NR
PSNR circles with different blur
CCA NCCA FLA
DFLA BFLA
5 10 15 20 25 30 35 40
0 5 10 15 20 25 30
Size of convolution mask in pixel
PS
NR
PSNR triangles with different blur
CCA NCCA FLA
DFLA BFLA
Figure8: Influence of changing blur at the coefficients and the PSNR of the cross-correlation algorithms. The blur is specified as the size
of the convolution mask of the average filter in pixels. Top: coefficients of the correlation algorithms, (marker—correct position found);
bottom: PSNR of the correlation algorithms; left: results of the circles; right: results of the triangles.
to noise. Only the unchanged or minimally changed objects are detected at the correct position. The processing time is independent of the image size. These algorithms are very fast when there is not too much noise.
The BFLA is robust with respect to change of brightness and contrast. Blur also has only a marginal influence on the result. This algorithm is much more susceptible to noise than others. But for the medical application, this algorithm ob-tains unexpectedly good results.
The FLA is more robust with respect to noise. But it is an algorithm that is sensitive to changes of brightness, con-trast, object size, blurring, and any change of the object form. Rising contrast causes rising PSNR. But the FLA requires six times more processing time than the other feature-list cross-correlation algorithms. Surprisingly, this algorithm gives a large amount of errors when detecting the templates in the analyzed medical images.
The results of images analyzed by the DFLA and the FLA are similar. The DFLA reaches the maximum PSNR. Only this algorithm determines a single maximum value. Changes in contrast are also recognized. This algorithm is faster than the FLA, but also more susceptible to noise. But this algo-rithm obtains the best overall results with regard to the med-ical application.
The results of the common cross-correlation algorithms are similar to those of other publications. In [1], the
re-sults of the cross-correlation of Laplacian filtered images are presented. These results differ from the results of the list-based cross-correlation algorithms. In [1], only the CCA is said to be sensitive concerning brightness and contrast. But the results of this study show that the feature-based cross-correlations FLA and DFLA are sensitive concerning bright-ness and contrast, too. The verification of the results by us-ing the Laplace operator instead of the Sobel operator leads to similar results.
The major advantage of the feature-list cross-correlation algorithms is the high values of the coefficients and the high values of the PSNR. Different objects can clearly be diff eren-tiated due to strong differences in coefficients and PSNR be-tween correct and incorrect objects. The algorithms are sen-sitive to all deviations from the template. On the other hand, the algorithms cannot generalize very well. A high quantity of feature points and the use of the local area around a fea-ture point can solve this problem. This can be achieved by smoothing the template.
65 70 75 80 85 90 95 100 0
0.2 0.4 0.6 0.8 1 1.2
Diameter in pixel
Co
e
ffi
cien
ts
Search triangle in an image of circles with different size
CCA NCCA FLA
DFLA BFLA
65 70 75 80 85 90 95 100
0 0.2 0.4 0.6 0.8 1 1.2
Diameter in pixel of the wrapped circle
Co
e
ffi
cien
ts
Search circle in an image of triangles with different size
CCA NCCA FLA
DFLA BFLA
65 70 75 80 85 90 95 100
0 5 10 15 20 25 30
Diameter in pixel
PS
NR
PSNR search triangle in an image of circles with different size
CCA NCCA FLA
DFLA BFLA
65 70 75 80 85 90 95 100
0 5 10 15 20 25 30
Diameter in pixel of the wrapped circle
PS
NR
PSNR search circle in an image of triangles with different size
CCA NCCA FLA
DFLA BFLA
Figure9: Influence of absent object on the coefficients and the PSNR of the cross-correlation algorithms. The size is specified as the diameter
of the object wrapped circle in pixels. Top: coefficients of the cross-correlation algorithms, (marker—correct position found); bottom: PSNR
of the cross-correlation algorithms; left: results of the circles; right: results of the triangles.
0 10 20 30 40 50 60 70 80 90 100
A
m
ou
nt
of
er
ro
rs
(%
)
Amount of errors for medium templates
CCA NCCA FLA BFLA DFLA 0
10 20 30 40 50 60 70 80 90 100
A
m
ou
nt
of
er
ro
rs
(%
)
Amount of errors for small templates
CCA NCCA FLA BFLA DFLA 0
10 20 30 40 50 60 70 80 90 100
A
m
ou
nt
of
er
ro
rs
(%
)
Amount of errors for large templates
CCA NCCA FLA BFLA DFLA
Figure10: Amount of incorrect detected templates in percent for all images with regard to the size of the templates.
The feature-list cross-correlation algorithms are mostly faster than common cross-correlation algorithms. However, the processing time depends on the quantity of feature points in the image, but is independent of the image size. Therefore, a minimal number of features is one requirement for the
Table1: Computation effort of the cross-correlation algorithms in
seconds per image for the different analytic test images and the
hu-man retinal images.
CCA NCCA FLA BFLA DFLA
Analytic images
Noisy images 37.0 37.0 190.0 32.0 26.0
Blurred images 37.0 37.0 10.0 2.0 2.0
Other distortions 37.0 37.0 2.0 1.0 1.0
Medical images
Small templates 1.20 1.21 0.76 0.24 0.21
Medium templates 5.49 5.48 2.22 0.50 0.44
Large templates 13.09 13.12 13.69 2.95 2.75
CCA NCCA FLA BFLA DFLA
0 10 20 30 40 50 60 70 80 90 100
A
m
ou
nt
of
er
ro
rs
Amount of errors for all templates
Figure11: Amount of incorrect detected templates in percent for
all images and all templates.
noise has a strong influence on the correlation result. That is why the feature extraction should be robust with regard to noise. Additional smoothing could be necessary. Other dis-tortions also have a strong influence on the result. Further-more, unintended omission of feature points reduces the co-efficients. But, if enough feature points still remain, the re-sults will be adequate. The sensitivity of the feature list cross-correlation algorithms could, for instance, be useful for in-specting objects for quality assurance, as every change of the object has an influence on the result.
The medical application clarifies the practical usability of the feature-list cross-correlation algorithms, although the medical images includes noise, changes of brightness and contrast and somewhat changing objects within the image series. Also the advantage of short processing times are con-firmed.
The choice of the feature-extraction algorithm has a strong influence on the cross-correlation results. The re-quirements of feature extraction are sophisticated. One ma-jor requirement is that the minimum of feature values is not equal to zero. Furthermore, the feature extraction has to be robust, consistent, and fast. For instance, the Harris-corner detection [32] only produces a few points with high
values. But, absent corner points have a strong influence on the result. Therefore, the corner points have to be detected with certainly. Other feature extraction algorithms such as the Canny corner detection produce more feature points, so only a few missing feature points have no strong influence on the result. The use of signed feature values such as those gained by the Laplace operator or the Sobel operator causes a stronger sensitivity with respect to different distortions.
To increase the robustness of the feature-list cross-correlation algorithms, additional features could be used. Additionally, in this paper only absolute gradient values are used. Considering also the orientation of the gradient could improve the results, too. But these additional steps result in an increasing processing time.
5. CONCLUSION
In this paper, different feature-list cross-correlation rithms are compared to common cross-correlation algo-rithms. For this purpose, the images and the templates are transformed from the two-dimensional representation form into a list representation form. Next, each zero value is re-moved from the image lists. This allows a drastic reduction of computational effort in comparison to common cross-correlation algorithms. The choice of feature extraction of-fers further possibilities for reducing the number of calcula-tion steps. The Sobel operator is used in this paper as an ex-ample. Lastly, the cross-correlation algorithm is adapted into a list-based cross-correlation algorithm.
Different kinds of feature-list cross-correlation rithms are compared. All feature-list cross-correlation algo-rithms are sensitive to any changes in the object form and are susceptible to noise. However, it is possible to differen-tiate between similar objects. When the noise level does not exceed a certain value, these algorithms are much faster than common cross-correlation algorithms. These advantages are confirmed by a medical application. For actual application, it must be taken into account that feature-list cross-correlation algorithms do not have a constant processing time. By im-proving the image conditions the processing time decreases. The DFLA achieves the best results and is very fast. The FLA is more robust with regard to noise, but slower than other feature-list cross-correlation algorithms. The BFLA is robust to changes in brightness and contrast but is more sensitive to noise. But the medical application shows that the results of the FLA are worse than the results of the other feature-list cross-correlation algorithms.
The feature-list cross-correlation algorithms are success-fully applied to a medical application. For the purpose presented, the DFLA achieves the best results. But also the BFLA and the NCCA achieve sufficiently good results.
algorithm for the actual problem. This will form part of fu-ture analytical investigation.
REFERENCES
[1] P. J. Burt, C. Yen, and X. Xu, “Local correlation measures for
motion analysis, a comparative study,” inProceedings of IEEE
Computer Society Conference on Pattern Recognition and Image Processing, pp. 269–274, Las Vegas, Nev, USA, June 1982.
[2] E. Wesley, W. E. Snyder, and H. Qi,Machine Vision, Cambridge
University Press, Cambridge, UK, 2004.
[3] S.-Y. Huang and W.-C. Tsai, “A simple and efficient block
mo-tion estimamo-tion algorithm based on full-search array
architec-ture,”Signal Processing: Image Communication, vol. 19, no. 10,
pp. 975–992, 2004.
[4] V. Lohweg, C. Diederichs, and D. M¨uller, “Algorithms for
hardware-based pattern recognition,” EURASIP Journal on
Applied Signal Processing, vol. 2004, no. 12, pp. 1912–1920, 2004.
[5] B. U. T¨oreyin, A. E. C¸etin, A. Aksay, and M. B. Akhan,
“Mov-ing object detection in wavelet compressed video,”Signal
Pro-cessing: Image Communication, vol. 20, no. 3, pp. 255–264, 2005.
[6] W. F¨orstner, “A feature based correspondence algorithm for
image matching,” in Proceedings of International Archives of
Photogrammetry and Remote Sensing Symposium (ISP Com-mission III), vol. 26(3/3), pp. 150–166, Rovaniemi, Finland, 1986.
[7] R. Maschotta, S. Boymann, and D. Steuer, “Shift reducing of retinal vessel image series by using edge based template
match-ing algorithm,” inProceedings of the 2nd European Medical and
Biological Engineering Conference (EMBEC ’02), pp. 848–849, Vienna, Austria, December 2002.
[8] S. Mori, H. Nishida, and H. Yamada,Optical Character
Recog-nition, John Wiley & Sons, New York, NY, USA, 1999. [9] A. Tankus and Y. Yeshurun, “Scene-consistent detection of
fea-ture points in video sequences,”Computer Vision and Image
Understanding, vol. 97, no. 1, pp. 1–29, 2005.
[10] C.-H. T. Yang, S.-H. Lai, and L.-W. Chang, “Robust face
im-age matching under illumination variations,”EURASIP
Jour-nal on Applied SigJour-nal Processing, vol. 2004, no. 16, pp. 2533– 2543, 2004.
[11] D. Gui-Guang and G. Bao-Long, “Motion vector estimation using line-square search block matching algorithm for video
sequences,” EURASIP Journal on Applied Signal Processing,
vol. 2004, no. 11, pp. 1750–1756, 2004.
[12] J. Barbarien, A. Munteanu, F. Verdicchio, Y. Andreopou-los, J. Cornelis, and P. Schelkens, “Motion and texture rate-allocation for prediction-based scalable motion-vector
cod-ing,”Signal Processing: Image Communication, vol. 20, no. 4,
pp. 315–342, 2005.
[13] S. Arivazhagan and L. Ganesan, “Automatic target detection
using wavelet transform,”EURASIP Journal on Applied Signal
Processing, vol. 2004, no. 17, pp. 2663–2674, 2004.
[14] A. V. Cideciyan, “Registration of ocular fundus images: an al-gorithm using cross-correlation of triple invariant image
de-scriptors,”IEEE Engineering in Medicine and Biology Magazine,
vol. 14, no. 1, pp. 52–58, 1995.
[15] F. Lalibert´e, L. Gagnon, and Y. Sheng, “Registration and fusion
of retinal images-an evaluation study,”IEEE Transactions on
Medical Imaging, vol. 22, no. 5, pp. 661–673, 2003.
[16] V. J. Traver and F. Pla, “Similarity motion estimation and ac-tive tracking through spatial-domain projections on log-polar
images,”Computer Vision and Image Understanding, vol. 97,
no. 2, pp. 209–241, 2005.
[17] C. Stiller and J. Konrad, “Estimating motion in image se-quences, a tutorial on modeling and computation of 2D
mo-tion,”IEEE Signal Processing Magazine, vol. 16, no. 4, pp. 70–
91, 1999.
[18] S. R. Deans, “Hough transform from the radon transform,”
IEEE Transactions on Pattern Analysis and Machine Intelligence, vol. 3, no. 2, pp. 185–188, 1981.
[19] J. Princen, J. Illingworth, and J. Kittler, “A formal definition of
the hough transform: properties and relationships,”Journal of
Mathematical Imaging and Vision, vol. 1, no. 2, pp. 153–168, 1992.
[20] B. J¨ahne,Digital Image Processing, Springer, Berlin, Germany,
6th, revised and extended edition, 2005.
[21] M. Sonka, V. Hlavac, and R. Boyle,Image Processing, Analysis,
and Machine Vision, PWS, Pacific Grove, Calif, USA, 1999. [22] R. Maschotta, S. Boymann, and U. Hoppe, “Regelbasierte
kan-tenerkennung zur schnellen kantenbasierten segmentierung
der glottis in hochgeschwindigkeitsvideos,” inBildverarbeitung
f¨ur die Medizin, pp. 188–192, Springer, Berlin, Germany, 2005. [23] R. Maschotta, J. Rehs, S. Boymann, and U. Hoppe, “Evalua-tion of feature extrac“Evalua-tion algorithms for the feature-list
cross-correlation in retinal images,” inProceedings of the 3rd
Euro-pean Medical and Biological Engineering Conference, Prague, Czech Republic, November 2005.
[24] K. V. Hansen and P. A. Toft, “Fast curve estimation using
pre-conditioned generalized radon transform,”IEEE Transactions
on Image Processing, vol. 5, no. 12, pp. 1651–1661, 1996.
[25] J. Radon, “ ¨Uber die bestimmung von funktionen durch
ihre integralwerte l¨angs gewisser mannigfaltigkeiten,”Berichte
Schsische Akademie der Wissenschaften. Leipzig, Mathematisch-Naturwissenschaftliche Klasse, vol. 69, pp. 262–277, 1917. [26] J. Beyerer and F. P. Le ´on, “Die radontransformation in der
dig-italen bildverarbeitung,”Automatisierungstechnik, vol. 50, pp.
472–480, 2002.
[27] C. F. Olson, “Constrained hough transforms for curve
de-tection,”Computer Vision and Image Understanding, vol. 73,
no. 3, pp. 329–345, 1999.
[28] N. Guil, J. M. Gonzalez-Linares, and E. L. Zapata,
“Bidimen-sional shape detection using an invariant approach,”Pattern
Recognition, vol. 32, no. 6, pp. 1025–1038, 1999.
[29] P. V. C. Hough, “A method and means for recognizing complex patterns,” US patent 3,069,654, 1962.
[30] J. Canny, “A computational approach to edge detection,”
IEEE Transactions on Pattern Analysis and Machine Intelligence, vol. 8, no. 6, pp. 679–698, 1986.
[31] W. F¨orstner and E. G¨ulch, “A fast operator for detection and precise location of distinct points, corners and centres of
cir-cular features,” inProceedings of ISPRS Intercommission
Con-ference on Fast Processing of Photogrammetric Data, pp. 281– 305, Interlaken, Switzerland, June 1987.
[32] C. Harris and M. Stephens, “A combined corner and edge
de-tector,” inProceedings of the 4th Alvey Vision Conference, pp.
147–151, Manchester, UK, August-September 1988.
[33] U. K¨othe, “Edge and junction detection with an improved
structure tensor,” inPattern Recognition, Proceedings of 25th
DAGM Symposium, vol. 2781 ofLecture Notes in Computer
Sci-ence, pp. 25–32, Magdeburg, Germany, September 2003.
[34] Intel, Open source computer vision library, reference manual,
2001,http://www.intel.com.
[35] J. P. Lewis, “Fast normalized cross-correlation,” inProceedings
[36] S. Theodoridis and K. Koutroumbas,Pattern Recognition, Aca-demic Press, New York, NY, USA, 1999.
[37] M. Ravanbakhsh, “Designing and developing a fully auto-matic interior orientation method in a digital
photogrammet-ric workstation,” inProceedings of the 20th ISPRS Congress
(Commision II), pp. 543–547, Istanbul, Turkey, July 2004. [38] R. Maschotta, M. Pietraszczyk, S. Boymann, and D. Jannek,
“Genauigkeit und generalisierbarkeit kantenlistenbasierter ko-rrelationsverfahren im vergleich zu grauwertbasierten
ver-fahren,” in Bildverarbeitung f¨ur die Medizin, pp. 110–114,
Springer, Berlin, Germany, 2004.
[39] W. Vilser, T. Riemer, E. Nagel, and A. Fink, “Functional
imag-ing of retinal vessels - principle and clinical potential,” in
Pro-ceedings of the 38th Annual Congress of the German Society for Biomedical Engineering (BMT), Ilmenau, Germany, September 2004.
[40] R. Maschotta, S. Boymann, S. Lehmann, and D. Steuer, “Soft-ware architecture for modular, extensible and reusable signal
processing components,” in Proceedings of Advances in
Au-tomation, Multimedia and Video Systems, and Modern Com-puter Science, pp. 304–308, 2001.
Ralph Maschotta was born in Ilmenau, Germany, on September 1973. He received the Dipl.-Inform (FH) degree in technical computer science from the University of Applied Sciences Schmalkalden, Germany, in 1999. In 1999–2000, he worked as a Re-search Engineer with OWIS Ltd., Ilmenau. In 2000–2001, he was a Teaching Assis-tant for object oriented programming of the University of Cooperative Education,
Eise-nach, Germany. In 2000 to 2006, he worked with Biosignal Process-ing Group of the Technical University as a Research and TeachProcess-ing Assistant for biosignal processing and biomedical image process-ing. Since 2004, he has been with the Research and Development Department of Wincor Nixdorf Technology Ltd., Ilmenau. He is currently working toward the Dr.-Ing. degree from Technical Uni-versity. His research interests are the biomedical image processing and the object oriented design and programming.
Simon Boymannwas born in Hamm, Ger-many, on August, 1975. He received his Dipl.-Ing degree in electrical engineering from Technical University Ilmenau, Ger-many, in 2000. For five years he worked at the department for Biomedical Engineering and Computer Science at Technical Univer-sity Ilmenau in the field of biosignal pro-cessing. Currently he is working for a com-pany for retail products.
Ulrich Hoppestudied physics at the Uni-versity of G¨ottingen, Germany, and received the degree of Diplom-Physiker (M.S. gree) in 1993. He received the Ph.D. de-gree in engineering from the University of Erlangen-Nuremberg, Erlangen, Germany, in 1997. Between 1997 and 2000, he was a Postdoctoral fellow at the Medical De-partment of the Saarland University, Hom-burg/Saar. From 2000 until 2004, he was a
Senior Scientist and Assistant Professor with the Department of