THE SPECTRUM OF SEVERITY OF MUTANT EFFECTS. 11. HETEROZYGOUS EFFECTS I N YEAST
ALLEN P. JAMES
Atomic Energy of Canada Limited, Chalk River, Ontcrrio
Received May 31, 1960
A L T H O U G H dominance is a much investigated phenomenon, more attentioil has been given to the qualitative aspects of particular allelic interactions than has been directed towards outlining any over-all patterns. Recently, questions concerning the genetic hazards of radiation to populations have emphasized the need for more precise quantitative information on this subject. Dominance is one of the factors that must be considered in predicting the fate of a mutant gene in a
population. Yet direct quantitative information on the partial dominance of recessive lethal mutations is confined to a very few studies of which the compre- hensive investigation of STERN, CARSON, KINST, NOVITSKI and UPHOFF (1952) is outstanding. Direct information on the dominance of nonlethal mutations is even more scant.
Of particular interest are mutant genes which have a selective advantage in the heterozygote; in this case mutation can have little effect on gene frequency. At present there is considerable uncertainty about the frequency with which mutant genes display a heterozygous advantage. Studies by WALLACE (1957) and by BURDICK and MUKAI (1958) have indicated that increased viability resulting from increased numbers of heterozygous genes may be common in Drosophila under some circumstances. On the other hand, in studies with mice (RUSSELL 1957) no evidence has been found of a n increased life span in the progeny of irradiated mice. The conflicting results of such experiments have yet to be explained.
The present investigation was designed to provide quantitative information on the dominance of mutant genes in yeast. Radiation-induced and spontaneous mutations affecting a quantitative character, rate of growth, were studied. Three aspects of the problem received particular attention: (1) the mean effect of nega- tive mutations in the heterozygous condition, (2) the frequency with which mutant genes display a heterozygous advantage, and ( 3 ) the relationship between degree of dominance and extent of mutant effect in the haploid.
TECHNIQUES A N D PROCEDURES
General procedure: Rates of growth were expressed in terms of the “one point growth values” of the different strains. These values were the logarithms of the diameters of microcolonies on solid medium, divided by the number of hours (usually about 48) elapsing since the initial inoculation of individual budding cells. Although the values obtained are not free of minor biases, the technique can be used successfully for detecting and estimating the extent of very small differences in rate of cell division.
All the mutant genes under study were detected in a single diploid strain of Saccharomyces cereuisiae (strain 4819) that had been developed in this labora- tory. This strain had been inbred for 27 generations and was considered to be essentially homozygous. The majority of the mutations were obtained in a single investigation already reported (JAMES 1959). To these were added a few sub- sidiary mutations detected by the same technique in two preliminary investi- g a t ons.
The mutants were maintained in the heterozygous condition as clones. Each clone consisted of the vegetative descendants of a single cell isolated from a colony produced by the plating of either irradiated or unirradiated cells of a population of strain 4819. The cells of this latter population were themselves the immediate descendants of a single cell.
To determine the effect of a mutant gene on the growth rate of a heterozygote, the growth rate of the heterozygote was compared with that of one or more clones that were apparently free of mutant genes and that had been derived from the same inbred, though unirradiated, population. To estimate the dominance of a
mutant gene, the effect of the gene on the haploid was compared with its effect on the heterozygote. Dominance was defined as that fraction of the haploid effect wh’ch was displayed by the heterozygote. A heterozygous advantage was con- sidered to be held by those mutants which displayed overdominance of mutant genes; the heterozygote grew more rapidly than either homozygous normal diploid or mutant haploid.
Sixteen hours prior to testing, the cells of a clone were transferred from refrig- erated broth culture to a presporulation medium and incubated at 33.5”C. The purpose of this procedure was to min;mize any physiological differences between cells of a test clone or between cells of different test clones. At the same time, the procedure tended to equalize the number of generations preceding the estimation of heterozygous effects and the number preceding the estimation of haploid effects.
In most of the experiments, two budding test cells and two budding control cells were transferred to four marked locations on fortified agar droplets. These were incubated in Van Tieghem cells at 21.5”C. Each test clone was usually represented in five Van Tieghem cells. The data from a day’s isolations formed a “lot”. In the case of subsidiary mutations mentioned earlier, each Van Tieghem cell contained only two isolations, both representative of the same clone.
HETEROZYGOUS EFFECTS O F MUTANTS 1629
genetic heterogeneity within a clone. Here the most common culprits are respira- tory-deficient mutants; the growth rate of these variants is relatively slow. But whatever the origin of the atypical values, efficient analysis of the data demands their exclusion. Although respiratory deficiency can be detected with assurance by spectroscopic methods, individual colonies were not tested for this character because of the amount of labor involved. Rather, atypical values (or many of them) were excluded through the use of a rejection criterion based upon the range (BLISS, COCHRAN and TUKEY 1956). In this system the ratio of the largest differ- ence between paired values to the sum of all differences is used to determine whether there is a statistically significant amount of heterogeneity. Values are rejected sequentially. The method did not discriminate between the two members of a pair, but it was so conservative in its rejections that there was at no time any doubt as to which of two values was discordant in this investigation. This was invariably the lower. On occasion a value was unpaired due to failure to isolate a viable cell. More rarely, inspection of the data suggested that both members of a pair of colonies were atypical of the clone. In either of these instances values were excluded if they were lower than the highest value consistently excluded by the statistical test.
The statistical significance of a difference between mean growth rates of a test and of a control clone was determined by a test of the null hypothesis as applied to the differences between paired values (first control isolate us. first test isolate, and second control us. second test isolate). The growth rate of a clone was defined in terms of its performance comparative to that of its control; here, heterozygous effect is the mean growth value of a test clone divided by the mean growth value of its control.
For subsidiary data, a t test involving group comparisons was used. The growth values of all control clones not identified as mutant served as a control.
RESULTS
Dominance was studied in 75 clones that were heterozygous for mutations affecting rate of cell division. The haploid phenotypic effects of these mutations ranged from lethal to positive and included some that differed from normal by as little as 3.5 percent (JAMES 1959).
Some of the mutations were of induced and some were of spontaneous origin. All those that had been found in nonirradiated cells were, by definition, of spon- taneous origin; those that had been found in irradiated cells must have included both induced and spontaneous mutations.
such a correction was feasible with positive mutations but not with negative mutations. The number of negative mutants among the control clones was by no means negligible, but there was little evidence of a substantial frequency of any one type. Further, it was evident that some of these mutants were not represented within the class of irradiated clones. Under these circumstances, the removal of spontaneous mutations from the class of induced mutations was not justified. Consequently, all negative mutations were considered as a single group with the realization that the distribution might well be somewhat biased.
For simplicity in presenting results, dominance within the group of recessive lethal and near-lethal mutations will be considered separately from that within the group of nonlethal mutations.
Recessive lethals and near-lethals
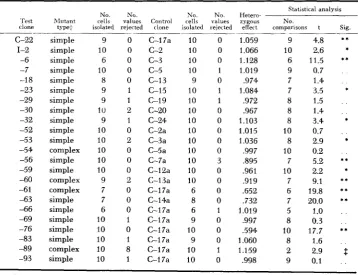
Thirty-five clones, all of them known to be heterozygous for recessive lethals or near-lethals, were assayed for rates of cell division. The summarized results of these tests are presented in Tables 1 and 2. It is evident that the effects of
TABLE 1
The relative growth rates of heterozygotes for lethals and near-lethals
Statistical analysis
No. No. No. No. Hetero- ‘Test RIutant cells values Control cells values zygous No..
clone type+ isolated rejected clone isolated rejected effect comparisons t Sia.
c-22 1-2
-6 -7 -1 8 -23 -30 -32 -52 -53 -54 -5 6 -59 -60 -61 -63 -69 -76 -83 -89 -93 -29 -66 simple simple simple simple simple simple simple simple simple simple simple complex simple simple complex complex simple simple simple simple simple complex simple 9 0
10 0
6 0
10 0
8 0
9 1
9 1
10 2
9 1
10 0 10 2 10 0 10 0 10 0
9 2
7 0
7 0
6 0
10 1 10 0 10 1 10 8 10 I
c-17a c-2 c-3 c-5 C-13 C-15 c-19 c-20 C-24 C-2a C-3a C-5a C-7a C-1 2a C-13a C-I 7a C-14a C-17a C-I 7a C-17a C-17a C-17a C-I 7a
10 0 10 0 10 0 10 1
9 0
10 1 10 1
10 0 10 0
10 0 10 0 10 0
10 3 10 0 10 0
6 0
8 0
6 1
9 0
10 0
9 0
10 1 10 0
1.059 9
1.066 10
1.128 6
1.019 9
,974 7
1.084 7
.972 8
.967 8
1.103 8
1.015 10
1.036 8
,997 10
,895 7
.961 10
,919 7
.652 6
,732 7
1.019 5
,997 8
,594 10
1.060 8
1.159 2
.998 9
4.8 2.6 11.5 0.7 1.4 3.5 1.5 1.4 3.4 0.7 2.9 0.2 5.2 2.2 9. I 19.8 20.0 1
.o
0.3 17.7 1.6 2.9 0.1 * * * * * * . . . . * . . * * * * ** * * * * . . . . ** . . 3 . .Significant at 5 percent level.
..
Significant at 1 percent level.+
“Simple’,’ mutants segregated 2 :2 for the detrimental mutation, whereas “complex” mutants produced one or moreHETEROZYGOUS E F F E C T S O F M U T A N T S 1631 TABLE 2
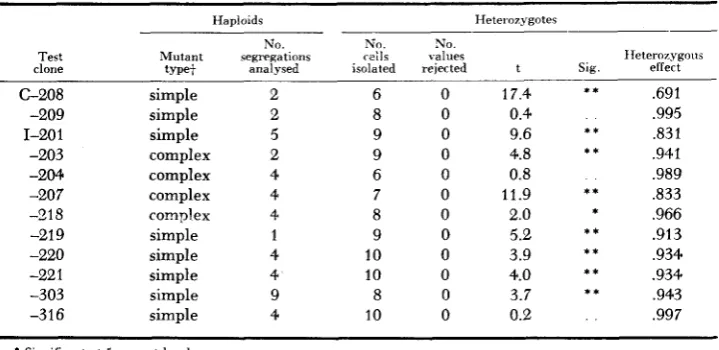
The relative growth rates of heterozygotes for subsidiary lethals and near-lethals
Haploids Heterwygotes
No. N”. No.
Test Mutant segregations reils values clone t m e t analysed isolated rejected
C-208 -209 1-20 1 -203 -204 -207 -918 -21 9 -220 -22 1 -303 -316 simple simple simple complex complex complex complex simple simple simple simple simple 2 2 5 2 4 4 4 1 4 4 9 4 6 8 9 9 6 7 8 9 10 10 8 10 0 0 0 0 0 0 0 0 0 0 0 0 IIeteroiygous t Slg effect
.691 17.4
0.4 .995
,831 9.6
,941 4.8
0.8 ,989
,833 11.9
2.0 * .966
.913 5.2 ,934 3.9 .934 4.0 ,943 3.7
0.2 ,997
* * * * * * * * * * * * * * * *
Significant at 5 percent level
* * Significant at 1 percent level.
+
“Simple” mutants segregated O:? for the detrimental mutation, whereas “complex” mutants produced one or more asci that contained more than two affected segregants.mutant genes on growth rate are extremely diverse; the estimated changes range from a 40 percent reduction to a 16 percent increase in rate of growth. Moreover, the differences between test clones and control clones are statistically significant in over 60 percent of the comparisons. In two thirds of these the test clones grew more slowly; in one third they grew more rapidly.
Differences fell short of statistical significance in only 13 of the heterozygotes. And here, the absence of a significant effect could not be construed as evidence that the mutant genes in question were completely recessive. Rather, it was an indication only that any mutant effects in these heterozygotes were probablv small. The growth rates, as measured, indicated that nine were lower and four higher than those of the respective control clones.
Despite the frequency with which dom‘nance was displayed, the modal value of these data is reduced from that of the controls by less than two percent. The mean value is reduced by about five percent.
significantly faster than its control does not by any means provide conclusive evidence that overdominance is the cause of its behavior; and where the increased rates are correctly attributable to overdominance, the frequency of the clones in question may have been so affected by selection pressures as to be unrepresenta- tive of the true frequency with which recessive lethals and near-lethals are over- dominant. The data thus indicate only that the frequency is somewhere between zero and one third. Subsequent investigations of these clones were concerned with improving this estimate. Here, no attempt was made to provide indisputable evidence that a particular gene did or did not display overdominance. Rather, clones were screened for those instances in which there was good evidence that some mechanism other than overdominance was responsible for clonal behavior. An important circumstance, other than sampling or experimental errors, that can lead to faulty estimates of dominance or overdominance is the unrecognized presence of a mutant gene within a clone. The extent and direction of the result- ing error in estimate and the ease of detecting that error are dependent on such factors as whether the extraneous mutation is positive or negative in its effect on the heterozygote, whether it is of induced or spontaneous origin, whether it occurs in a test or control population, and whether the affected population is homogeneous or heterogeneous for it.
Ignoring for the time being the possible frequency with which overdominance may be masked, conditions likely to produce spurious evidence of overdominance will be considered. Three such conditions are those in which (1) test clones are homogeneous for induced or spontaneous dominant positive extraneous muta- tions, (2) control clones are homogeneous for spontaneous dominant negative mutations, and in which (3) test clones are heterogeneous for spontaneous domi- nant pos:tive mutations. The following sections are concerned with determining whether any of the above circumstances prevailed in those instances where initial results intimated the existence of overdominance.
Homogeneity of test clones for dominant positiue extraneous mutations: When a test clone is homogeneous for a positive mutation, that mutation may have been either spontaneous or induced, but it must have been present prior to the latest single cell isolation in the history of the clone. Thus it must have been present in all cells at the time the clone underwent segregation analysis. That such mutations should sometimes go undetected in that analysis is not surprising in view of the fact that the experimental method was not designed to detect small- effect mutations in the presence of large-effect mutations (JAMES 1959). In fact, previous investigations of the test clones had made no attempt to detect either positive or negative mutations in clones known to be heterozygous for lethals or near-lethals. It had been considered that the excessively slow growth, if not the absence, of two or more segregants from each ascus rendered detection of non- lethal mutations, even of large effect, too unlikely to be worth attempting. Never- theless, it was found that, in all likelihood, increased growth rate of some of these test clones was attributable to the presence of positive mutations.
HETEROZYGOUS EFFECTS O F MUTANTS 1633
26 27 26 29 30 31 32 33 3 4
GROWTH VALUES
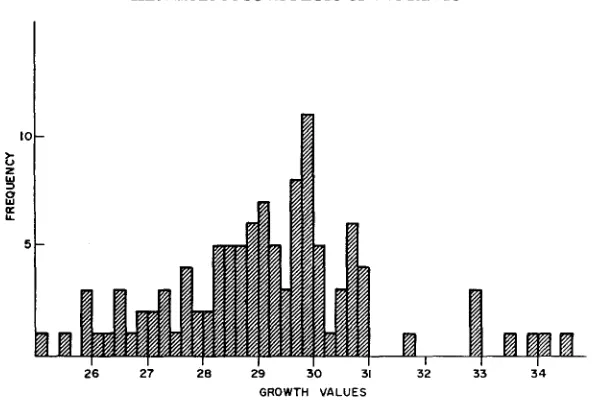
FIGURE 1 .-The frequency distribution of the growth values of “normal” segregants of diploids
heterozygous for recessive lethals or near-lethals.
eight highest values, seven refer to segregants of one or other of the four fastest growing heterozygotes. One stems from 1-6, three from 1-23, one from 1-32 and two from 1-89. There can be little doubt that this association of rapidly repro- ducing segregants with rapidly reproducing heterozygotes is more than coinci- dence, and that the increased rate of cell division in the four clones is attributable, not to overdominance of negative mutant genes but to the simultaneous presence of dominant positive mutant genes. It should be noted that one of the eight highest growth values was produced by 1-63, a clone that obviously did not have a n excessively fast growth rate. Here it must be assumed either that ( 1 ) the clone was heterozygous for a positive mutant gene that failed to raise the rate of
growth above normal, or that (2) the fast growing segregant was a rare mutant of spontaneous origin.
The above screening technique thus reduced the number of clones in which t h e presence of overdominance is intimated from 11 to seven.
Dominant negative mutants among control clones: Because they are at a selec- tive disadavantage, the influence of spontaneous dominant negative mutatons must be low. However, it is not impossible for such mutations to become fixed in a clone through the process of single cell isolation. It thus seemed quite possible that some of the clones used as controls were homogeneous for previously un- detected mutations that were negative in the heterozygote; certainly the fact that mutations were detected by segregation analyses (JAMES 1959) invited the suspicion that still others remained undetected. A comparison of the growth rates of different controls within a lot provided an opportunity to detect such mutant control clones along with those controls that had low values by virtue of sampl’ng errors. The mean growth value of a suspected mutant clone was compared, by a
test on the basis of its growth relative to that of the test clone with which it had been paired and not on the basis of its growth relative to the other control clones within a lot. The most obvious suspects were the control clones against which the remaining “significantly fast” mutants-C-22, 1-53 and I-%were tested. These were C-l7a, C-3a, and C-2. Of these, C-17a gave little evidence of being negative, and it was not a slow grower in later tests. But C-2 had a growth rate that was lower than that of the remainder of the clones in the lot in which it belonged, and C-3a ranked second lowest of the clones in its lot. A statistical analysis, however, failed to impute significance to the differences.
Heterogeneity of test clones for dominant positiue mutations: Genetic hetero- geneity within a test clone must be the result of spontaneous mutation. The fact that heterogeneity was not uncommon had already been suggested in a study of the haploid segregants of the test and control clones (JAMES 1959). Such spon- taneous mutations, when positive and dominant, make the accurate estimation of dominance particularly hazardous. Combined with the fact that they can easily escape detection is the fact that selection pressure for such mutants must be very strong. Here it should be noted that the process by which outliers were rejected from the data was far too conservative to reject other than negative, and presum- ably respiratory-deficient, variants.
An efficient method of testing for genetic heterogeneity within a clone is to determine whether or not the difference between the lowest and the highest growth values produced by a sample of cells is attributable at least in part to hereditary differences.
This may be accomplished by isolating and replanting cells from each of the two colonies that provided these high and low values. These cells themselves provide two new sets of growth values which may be compared; a statistically significant difference between the means of the two sets of values implies an hereditary difference between the two colonies that were sampled. This, in turn, indicates the presence of genetic heterogeneity within the original clone.
When heterogeneity is detected by the above method, there must be some doubt as to which of the two types is the spontaneous mutant. The faster of the two was
so designated on the grounds that it is not likely that a spontaneous mutation with a selective disadvantage would attain a frequency high enough to make detection likely unless the mutation rate was extremely high.
Although heterogeneity must sometimes remain undetected by the above procedure, failure to demonstrate significant differences within clones suggests homogeneity. As a consequence, the new information on growth rate of the clone under test may be pooled with the original information to obtain what is likely to be a more accurate estimate of growth rate.
Heterogeneity tests as described above were carried out with 11 of the clones listed in Table 1. These clones were the ones whose estimated growth rates had not differed significantly from control or in which positive effects had not been attributed to some factor other than overdominance (exceptions were C-22 and 1-7 which were not included, and 1-53 which was).
HETEROZYGOUS E FF EC T S O F M U T A N T S 1635
W
-
h-
.-e a a
>
w
.-z"
24
9
t t
-. M
v)
i
t-t
2
W
-
in three of the clones. These were 1-18, 1-52, and 1-83. For one of these, 1-18, a nonsignificant decrease in growth rate was re-estimated as significant. For one, 1-52, a nonsignificant increase was revised to a significant decrease, and for one, 1-83, a nonsignificant increase was revised to a nonsignificant decrease. It may be noted that in each of the above instances, the original estimate conforms to ex- pectation by being intermediate in value between the two values obtained subsequently.
It is of interest that the previous intimation that the “overdominance” of 1-2 and 1-53 was attributable to low mean control values was upheld by the hetero- geneity tests: reisolates of 1-2 did not differ from each other but did differ sig-
nificantly from the original. The same was true of 1-53.
I n the last column of Table 3 are the revised estimates of heterozygous effects of the mutant genes. These are the lower of the two reisolate values where heterogeneity was detected and the mean of the three values (original plus two reisolates) when heterogeneity was not indicated. That the revised values are in fact more accurate estimates depends not only on whether heterogeneity or its absence was correctly assigned, but also on whether the two control clones C-17a and C-12a were nonmutant. Evidence on this point was obtained by determining if test clones or their homogeneous reisolates gave the same mean phenotypic effect when tested against C-17a or C-lea as when tested against an assortment of control clones. Seven test clones had a mean relative growth value of 1.007 when tested against seven different controls and 1.015 when tested against C-l7a. Twelve clones produced a mean value of .994 as compared with .985 in a similar test of C-12a. It is not likely that the two clones were mutant.
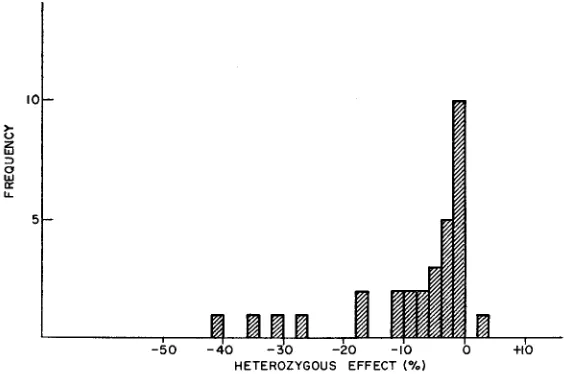
In Figure 2 the final estimates of heterozygous effects of recessive lethals an4 near-lethals are shown in histogram form. Three facts are noteworthy: (1) The
HETEROZYGOUS EFFECT (%)
HETEROZYGOUS EFFECTS O F MUTANTS 1637
modal value is lower than that of the homozygous normal by a n amount between zero and two percent. (2) There is a mean reduction of 8.1 percent in rate of growth. (Six of these clones produced segregations that indicated some complexity of mutant effect; their asci sometimes contained more than two affected spores.
If these complex mutants are eliminated from the data, the mean reduction in growth rate is 8.6 percent.) ( 3 ) There is no evidence of overdominance among X-ray-induced lethal or near-lethal mutations. Only the control clone, C-22, remains as a candidate for overdominance, and it is not a very strong one since it was not tested for genetic heterogeneity.
Positive mutations
Six clones known to be heterozygous for mutations that had a positive effect on growth rate of the haploid were available for test. As two of these were controls and all of them had similar phenotypes, it seemed quite likely that some if not all these positive mutations had a common spontaneous origin. This contention was not contradicted in a comparison of effects in the heterozygote; something ap- proaching full dominance was displayed by all but one of the mutants (Table 4).
The exception was 1-67 with which a significant degree of dominance became evident only with further testing. Since there was considerable evidence that this clone was in reality a dihybrid, the low degree of dominance may well be attributed to epistasis of the negative mutant.
It is noteworthy that the fast-growing heterozygotes tended to be unstable producers of respiratory-deficient cells (see frequency of rejected values in Tables 1 to 6 ) , a circumstance expected when cells have an excessively rapid rate of cell division (JAMES and SPENCER 1958). It is likely that rate of growth is underestimated in these unstable clones because each colony contains a high concentration of slowly dividing variants.
Nonlethal negative mutations
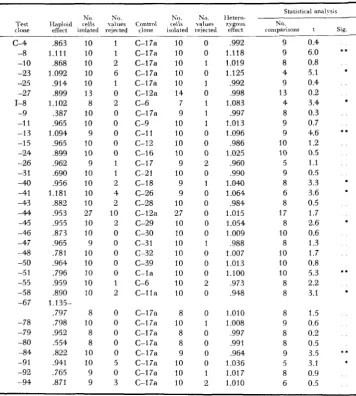
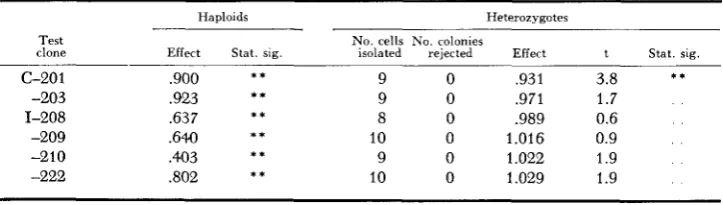
Dominance of nonlethal negative mutations was studied in 34 clones. The results of initial tests are shown in Tables 4 and 5. As measured, 17 of the clones grew faster, and 17 grew more slowly than did their respective controls. The modal value was close to normal; the mean value was 1.002. But any implication of complete recessiveness on the part of the mutant genes was discounted by the fact that the rates of six of the test clones differed significantly from those of their controls. Four were higher and two were lower.
Again, as with lethals and near-lethals, a degree of overdominance is suggested. This can hardly exceed 50 percent-the proportion of clones that grew faster than their controls-and it may be as low as zero.
TABLE 4
The relative growth rates of heterozygotes for nonlethal mutations
Test clone c-4 -8 -10 -23 -25 -27 1-8 -9 -1 1 -13 -15 -24 -26 -3 1 -40 -4 1 -43 4 4 -45 -46 -47 -48 -50
-5 1 -55 -58 -6 7
-78 -79 -80 -84 -9 1 -92 -94
NO
IIaploid tells effect isolated
-
,863 10 1.111 10 ,868 10 1.092 10 ,914 10 .899 13 1.102 8 ,387 10 ,965 10 1.094 9 ,965 10 .899 10 ,962 9 ,690 10 ,956 10 1.181 10 ,882 10 ,953 27
.955 10
,873 10 .965 9 ,781 10 ,964 10 .796 10 .959 10 ,890 10
,797 8 ,798 10 .952 8 5 5 4 8 .822 10 ,941 10 .765 9 ,871 9 1.135-
N O . yalrres rejected 1 1 2 6 1 0 2 0 0 0 0 0 1 1 2 4 2 10 2 0 0 0 0 0 1 2 Control clone ____ C-17a C-17a C-17a C-17a C-I 7a C-12a C-6 C-17a c-9 c-1 1
c-12 C-16 C-17 c-2 1 C-I 8 C-26 C-28 C-12a C-29 C-30 C-3 1 C-32 c-39 C-la C-6 C-lla
C-I 7a C-17a C-17a C-17a C-17a C-I 7a C-17a C-17a NO. cells isolated IO 10 10 10 10 14 7 9 10 10 10 10 9 10 9 9 10 27 10 10 10 10 10 10 10 10 ~- 8 10 8 8 9 10 10 10
N o .
\slues iejected 0 0 1 0 1 0 1 1 1 0 0 0 2 0 1 0 0 0 0 0 1 0 0 0 2 0 1 Ietero- 7ygons effect ,992 1.118 1.019 1.125 ,992 ,998 1.083 .997 1.013 1.096 .986 1.025 ,960 ,990 1.040 1.064 .984 1.015 1.054 1.009 ,988 1.007 1.013 1.100 .973 ,948 1.010 1.008 .997 ,991 ,964 1.036 1.017 1.010 Statistical analrsis NO.,
comparisons t Sip.
9 0.4
9 6.0 * *
8 0.8 4 5.1 9 0.4 13 0.2 4 3.4 8 0.3 9 0.7 9 4.6 * *
10 1.2 10 0 5
5 1.1 9 0.5 8 3.3
6 3.6 *
8 0.5
17 1.7
8 2.6 *
I O 0.6 8 1.3 10 1.7 10 0.8
10 5.3 * *
8 2.2
8 3.1 *
*
*
*
8 1.5 9 0.6 8 0.2 8 0.5
9 3.5 * *
5 3.1 *
8 0.9 6 0.5
* Significant at 5 petrent level * * Significant at I percent lele1
segregations, given any indication that they contained positive mutations.
Negative mutants among control clones: Statistically significant differences be- tween rates of growth of test clones and their controls had indicated over- dominance in four test clones, 1-40, 1-45, 1-51, and 1-91. The four corresponding control clones were scanned for evidence that the differences were in fact due to
reduced rates of growth of these controls. They were C-18, C-29, C-la, and C-17a.
HETEROZYGOUS EFFECTS O F MUTANTS 1639
had only the third lowest mean growth value of eight clones in one lot. But C-18 had the second lowest mean growth value of eight and C-la had the lowest of eight. A t test showed the growth values of C-la to be significantly lower than those of the remaining control ( P =
<
.01).
Thus, there is good evidence that the mutant tested against C-la was not, in fact, overdominant.Genetic heterogeneity of test clones: Heterogeneity tests (simlar to those already described) were confined to 17 test clones, but among these were the four clones in which overdominance had been indicated. Results are summarized in Table 6. Genetic heterogeneity was demonstrated in three clones, 1-24, 1-46, and 1-79. In two of these a significant negative effect was unmasked. Genet;c heterogeneity could not be attributed to any of the four ‘Loverdominant” clones. But the test did confirm the previous evidence that the growth rates of the control clones C-la and (2-18, as measured, were extraordinarily low; the combined data from paired reisolates differed significantly from the original isolates 1-40 and 1-51. Both clones could be removed as candidates for overdominance.
With the compilation of re-estimates the number of clones having rates of growth exceeding that of their controls was reduced from 1 7 to 13. The number of clones showing a significant increase attributable to overdominance stood at two. These were 1-45 and 1-91. But the data of Table 6 do not remove the suspicion that genetic heterogeneity existed in these two clones despite the absence of statistically significant evidence of this.
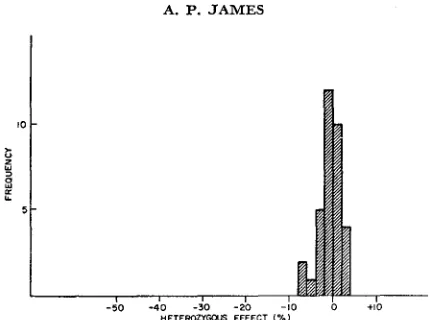
The d’stribution of heterozygous effects of nonlethal mutations, as finally esti- mated, is shown in Figure 3. The modal value is reduced somewhat, and the mean is reduced by 0.6 percent.
Considering all the detrimental mutations, whether lethal or nonlethal, the mean rate of growth is reduced by an estimated 4.2 percent. If the calculation of
the mutant effect is refined somewhat by omitting complex mutants which may not be representative of mutations in general and by omitting those mutants in which overdominance is implied by a significant alteration in rate, the reduction is 4.4. percent, a value that is not very different.
Data of this paper together with that of the preceding paper (JAMES 1959) provide the informat’on necessary to determine whether there is correlation
TABLE 5
The relative growth rates of heterozygotes for subsidiary nonlethal mutations
Test clone
~~
Haploids Heterozygotes
N o . cells No. colonies
Effect Stat. sig. isolated rejected Effect t Stat. sig. c-20 1
-203 1-208 -209 -210 -222
* *
9 0 ,931 3.8
9 0 .971 1.7
8 0 .989 0.6
10 0 1 .016 0.9
9 0 1.022 1.9
10 0 1.029 1.9
* * * * **
i t
* * * *
,900 ,923 ,637
64.0
.403
,802
TABLE 6 Genetic heterogeneity within clones heterozygous for nonlethal mutations Original Reisolate Revised estimates estimate of “fast” No. NO. KO. No. Heterozygous Entries t effect Test heterozygous or Heterozygous cells values Control cells values No. t (f clone effect “slow” effect isolated re;ected clone isolated rejected coinparisons us. s)
c-4 -1
0
-25 1-8 -15 -24 -26 -3
1
4 45 I46
.992 1.019 .992 1.083’ .986 1.025 .960 ,990 1
.ow*
1.054* 1.009f .988 s 1.001 f ,997 s 1.005
t
1.000 f 1.075 s 1.098 f 1.030 s 1.009 f .938 s 1.009 f ,972 s .997 f ,979 S ,968 f 1.008 S .986 f 1.002 s 1.046 f 1.057 S .991 10 1 10 1 10 0 10 0 17 1 10 2 10 0 10 1 8 0 9 0 0 0 10 0 10 0 9 0 10 0 9 0 8 0 8 0 10 4 10 0 10 0 c-I 2aC-12a C-
12a
C-12a C-12a C-I
7a
C-I
7a
C-12a C-12a c-1% c-1% c-I
2a
C-12a C-12a C-12a C-12a c-12a C-12a c-12a C-12a C-12a 10 10 9 9 17 10 10 9 7 9 10 10 10 10 10 10 8 8 9 10 10
0 9 0.5 0 9 1 8 0.2 3 6 1 14 0 8 1.2 0 10 0 8 0.9 0 7 0 9 2.4* 0 9 0 10 1.4 0 10 1 9 0.4 0 10 0 9 0.Q 1 7 0 8 1.7 0 6 0 10 2.3* 0 10 0rig.f 0.6 .993
f+s f+s orig.+
0.3 ,997 res amp 1 e 0rig.f 0.5 1.007 0rig.f 10.6** 1.087 ? f+s +a f+s
k
4 orig.+ 0.7 1.006 f 2.9* .938 orig.+ 2.l* .980f+s f+s f+s
0.1 .998 orig.+ 1.7 .979 orig.+ 2.7* 1.033
f+s S
0.4
HETEROZYGOUS EFFECTS OF MUTANTS 1641
3
h
-
2
0
U
4 - 0
h 9 3 . h
w
0 3 0 0 ~ 0 - 0 c . 1 o o - o -
- r 0 0 0 0 ~ - -
- -
% *.U * % * U v ) %
0 0 0 - r o
U * U 111 v)
h
w
cl
3
FIGURE 3.-The frequency distribution, by heterozygous effect, of nonlethal negative muta- tions.
between degree of dominance and mutant effect in the haploid. The individual heterozygous effects of all test mutants have been plotted against their haploid effects in Figure 4. The various degrees of a haploid effect are fairly well represented. The incidence of apparent overdomkance is quite uniform over the entire range of haploid effects. But the degree of dominance is increased at the two extremes of the range. This is more obvious in the data of Table 7.
Here mutant clones have been placed into one or other of three categories. One of
these categories includes “simple” recessive lethals and near-lethals. The re- maining 34 mutant clones have been divided equally into two categories, one including those that were more detrimental in the haploid, the other including those that were less detrimental. In the last column is the calculated mean dominance of the mutations in each category, where dominance is defined as that proportion of haploid mutant effect that is displayed in the heterozygote. There is a negative correlation between mutant effect in haploid and in heterozygote; the least detrimental mutations are the most dominant.
The reality of the correlation will be discussed later. Here it will be noted only that the correlation is not made suspect by the evidence that dominance is greater among lethals than among more detrimental nonlethal mutations. These lethals may well include a class of mutation that is unrepresented among nonlethals. For example, the presence of deletions involving several linked loci may bc expected among lethals but would be rare among nonlethal mutations.
DISCUSSION
It can be expected that various factors act to bias the estimates of heterozygous effects obtained in this study. The extent and direction of these biases should be considered before any inferences are drawn from the data. They are of two general types (1) those that tend to make the list of mutant genes an unrepre-
sentative samples of mutations, and (2) those that affect the dominance at- tributable to individual mutations.
HETEROZYGOUS EFFECTS O F M U T A N T S
HAPLOID EFFECT (%I
1643
-100 -90 - 8 0 -70 - 6 0 -50 -40 -30 -20 -10 0 + I O + 2 0
I I I I I I I I I I I I I
c
0 W
W
:
+ I O -2
0.0X X
(0
1 1 * a
-
x"p
Xx x
& E
r
-
20-X -30-x
X -40-x
/
/
FIGURE 4.-The heterozygous and haploid effects of spontaneous and X-ray-induced mutations. Crosses indicate statistically significant heterozygous effects. Location of a point on the diagonal indicates complete dominance of the mutant gene. Location on the horizontal line indicates com- plete recessiveness. Location in the upper left sector indicates overdominance.
biases affecting the main sample of mutants. There it was concluded that the frequency of small effect mutations was probably underestimated. The present list includes all but five of these mutants. One of these, 1-49, was positive, but the remaining four were small effect mutants in which growth rate was reduced by less than ten percent in the haploid. The shortage of small effect mutations is thus increased by these omissions. It is yet more aggravated through the addition of the subsidiary mutations; these were detected by a similar but less exacting procedure than were those of the main sample. Altogether, it seems certain that the frequency of minor mutations is considerably underestimated.
Several factors must tend to bias the estimate of individual heterozygous effects. One of these is the process by which outliers were rejected. It is evident that rejections were more rare in clones which were heterozygous for more negative mutations. As a result there was a tendency for negative mutant effects to be overestimated. But the error must be reduced where the effects of the mu- tations are less negative.
likely existence of overdominance in those clones in which initial results did not indicate its existence. It was considered that the introduction of this bias was justified by the necessity for maintainng the amount of retesting at a minimum. Certainly, an attempt to demonstrate overdominance in clones which had s'gnificantly reduced growth rates in initial tests was too unlikely of success to be warranted. That the bias cannot be large is suggested by two facts. First, selective treatment was confined to those clones in which growth rate was sig- nificantly different from their controls. Second, overdominance must have been hidden only as a result of sampling error or coincidental pairing of an over- dominant clone with a control containing an undetected dominant positive mutation. In this connection it may be noted that dominant positive mutations are less likely to go undetected in control clones than in test clones because in the former they are not masked by negative mutations. Altogether, the in- frequency with which positive evidence of overdominance was detected indicates that the number of instances in which overdominance of equal or greater in- tensity was overlooked must have been low.
I n considering these data it is important to remember that throughout the investigation selection pressure will have favoured spontaneous mutat'ons with positive effects on rate of growth in the heterozygote. These positive effects could be due either to dominance of positive mutations or to overdominance of negative mutations. An attempt was made to m-nimize the effect of spontaneous mutations in biasing the data or in reducing its statistical significance, but it can have been onlv partially successful. For instance, each clone was derived from a single cell which was itself isolated from a colony that had been in existence for 20 or more cell generations. This procedure was followed in order to eliminate genetic heterogeneity due to such causes as delayed mutation and the plating of budding or binucleate cells. In retrospect it seems likely that the procedure was unwise. Considering the amount of genet'c heterogeneity that was subsequently detected in test clones, the number of spontaneous mutations that were introduced and fixed in the clones must have been greatly increased by the procedure.
The estimated mean reduction in growth rate of heterozygotes for lethals and near-lethals, eight percent, is surprisingly similar to the reductions of four percent obtained by STERN et al. ( 1952), of 4.5 percent obta'ned by MULLER and CAMP-
BELL (MULLER 1950) and of seven percent obtained by CORDEIRO (1952) in
viability of heterozygotes for lethals in Drosophila.
The mean reduction in growth rate, 4.2 percent, for all the negative mutations is obviously an overestimate of the true value because the frequency of minor mutations was underestimated. Inclus'on of those mutations, presumably numerous, with haploid effects of less than 3.5 percent, would reduce the value even though there was a high degree of dominance among them.
HETEROZYGOUS EFFECTS O F MUTANTS 1645
mutation consistently confers a selective disadvantage. Otherwise, any change in gene frequency will be too small to be of consequence. It must be nearly certain that extremely negative mutant effects are consistently at a selective disad- vantage. This is less certain in the case of small negative mutations. It is not unreasonable to suppose that in this portion of the spectrum of mutations, selec- tion pressures tend to become inconsistent in an unstable environment, favouring a particular gene in some environments and in some gene complexes and favouring its allele in others. Here shifts in environment might be sufficient to
maintain genetic heterogeneity, and mutation would be a relatively weak force. The frequency with which detrimental mutant genes display a selective ad- vantage in the heterozygote is of greater importance in this study than is the intensity of that advantage. A change in mutation rate will have little effect on gene frequency where a heterozygous selective advantage prevails even if the advantage is small or not always evident. I n strain 4819 and with the conditions of growth under study here, the frequency with which detrimental mutant genes display a selective advantage in the heterozygote is obviously low. Only four test clones had growth rates that exceeded that of their controls by more than two percent, and these cases are examples of overdominance only by default. Al- though the increase in growth rate was significant in three of them, there was some reason for suspecting that overdominance was not the real cause.
The results of this investigation are in accord with those of RUSSELL (1957) and of FALK (1959) in indicating that radiation-induced mutations lower the mean value of a quantitative character. They are at variance with those obtained by WALLACE (1957) and by BURDICK and MUKAI (1958), where increases in mean viability following irradiation of homozygotes were found. This lack of accord between results is not surprising when different quantitative characters are being compared in different organisms. But it does weaken the confidence with which one can generalize from the results of any one investigation. It may be that there are basic genetic differences between the organisms; it has been suggested that in some of its features the genetic mechanism of Drosophila is atypical. and it might as well be suggested that yeast has atypical features. However, the fact that S. cerevisiae prefers to exist as a diploid although capable of existing as a haploid does imply that the organism’s genetic make-up is conducive to overdominance. However, the divergence of results may be ex- plained in any of several other ways that do not include basic genetic differences between the two species. Some of these will be considered below.
that this type of complex interaction will increase in frequency as the effects of gene action are ramified. But for characters that more closely reflect primary gene action, overdominance may be more rare. W e cannot easily locate growth rate on such a scale, but certainly it is only one of the factors that contribute to over-all fitness. On the other hand, hereditary changes in this character must be far removed from primary gene action in many instances.
Overdominance may be confined largely to mutations having little or no haploid effect on the character under consideration. Such mutations have been termed isoallelic. It would seem that genes :n this category may have little that is basically in common; mutations with small effects on one character must frequently have large effects on some other character not under observation, and environment must frequently be the factor which controls whether or not a mutation is isoallelic. The present investigation provides no d’rect evidence on overdominance of isoallelic mutations since all the mutant genes under test had mutant effects exceeding three percent in the haploid. The investigat’on does, however, provide some indirect evidence against the hypothesis: (1 ) Isoallelic mutations must frequently have been present as undetected mutations in the test clones. If these were overdominant, one might expect the combination of the recessive mutation under test and the overdominant isoallelic mutation to produce evidence of overdominance. (2) Overdominance of isoallelic mutations is not consistent with the evidence that dominance increases with decreasing mutant effect. ( 3 ) Eight “irradiated” clones in which mutations had not been detected in segregation analyses were tested f o r growth rates. None differed significantly from its control, and the mean rate of growth was reduced by 0.5 percent.
Overdominance may have been frequent but individual intensities may have been too low for detection; or the phenomenon may have heen masked by the presence of dominant negative mutations.
The gene complex of strain 4819 may have been inappropriate to the ap- pearance of overdominance. It has been suggested by WALLACE (1957) that overdominance may not be usual in well-adapted homozygous lines. How well adapted the present strain is, it can only be conjectured. But that it was not reproduc’ng at a maximum rate is clearly evident from the appearance of positive mutations. Also, an attempt to de-adapt the strain had been made by testing the clones at a temperature that was 12 degrees lower than any to which they had previously been subjected.
Altogether, it seems that although there are several possible reasons why the apparent low frequency of overdominance in this investigation may have been atypical, none of these is very persuasive.
The investigation has produced direct evidence that there is a negative correla- tion between mutant effect in the haploid, which is equivalent to the homozygote, and in the heterozygote.
HETEROZYGOUS EFFECTS O F MUTANTS 1647
than a high degree of dominance among mutants that are only slightly negative i n the haploid phase. A five percent reduction in mean growth rate of more negative clones would have been required to achieve the same degree of domi- nance as was measured in less negative clones. Such a reduction could be detected with ease. Yet a five percent reduction was not detected in any of the 17 heterozygotes. I n fact, the mean reduction in growth rate of heterozygotes for more negative mutants was less than that in less negative mutants. The reality of the correlation is also indicated by the ratio of 5 to 1 for individually significant reductions in the two categories despite the absence of statistical significance. That the dominance among small effect mutations was a result of the presence of a cluster of identical spontaneous mutations is of course possible but most un- likely; the presence of such a group is entirely unexpected in view of the selective disadvantage that they would have. I n fact, none of the detected mutant genes in control clones was other than recessive.
This negative correlation between mutant effect and dominance was predicted by MULLER (1950). It is based on the hypothesis that extremely detrimental mutations will, through time, accumulate a genetic background that will reduce their harmfulness in the heterozygote. Small-effect mutations, on the other hand, would probably not. The correlation has some bearing on the results to be ex- pected from irradiating inbred lines. Because large-eff ect mutations, though detrimental, tend to be recessive, they would be initially masked, but small-eff ect mutations would be more immediately evident. If a n inbred line was well adapted to its environment, most if not all the small-effect mutations would be detri- mental. If. on the other hand, the strain was relatively unadapted, then a fraction, however small, of these mutations would be beneficial. It seems not impossible that discrepancies between the results of different investigations may be at- tributable to differences between strains in the frequency of dominant positive mutations of small effect. An experimental test of this hypothesis would not be easy to perform, since it requires the individual measurement of small homozy- gous mutant effects. Further, strains that were equally unadapted might differ in their response to irradition since they might well differ in number of genes con- tributing to the lower degree of adaptation. It may be noted that in none of the mouse or Drosophila investigations mentioned above was it technically possible to compare heterozygous mutant effect with homozygous mutant effect. Rather, it was necessary to compare the heterozygous effect with the homyozous normal and to infer the homozygous mutant effect. The present investigation perhaps provides negative support to the hypothesis: the absence of positive haploid muta- tions was accompanied by an absence or low frequency of positive effects in heterozygotes.
SUMMARY
A. P.
the haploid varied from lethal to positive. The smallest measured effects were reduct:ons of 3.5 percent.
The mean effect of recessive lethals and near-lethals on growth rate of heterozygotes was a reduction of eight percent. The modal value of these hetero- zygotes was within two percent of normal. The mean effect of nonlethal but negative mutations on heterozygotes was a reduction of 0.6 percent. The modal value approached normal.
There was little evidence of overdominance. Significant increases in rates of growth, interpretable in terms of overdominance but not assuredly such, were found in three of 69 heterozygotes for negative mutations.
Direct evidence of a negative correlation between mutant effect in the haploid (considered to be equivalent to the homozygote) and in the heterozygote was found; mean dominance was greater for mutations of small effect than for mutations of large effect.
ACKNOWLEDGMENTS
The author wishes to acknowledge the technical assistance of MR. P. E. SPENCER and is indebted to MRS. E. W. MORSE for advice on statistical analyses.
LITERATURE CITED
BLISS, C. I., W. G. COCHRAN, and J. W. TUKEY, 1956 BURDICK, A. B., and T. MUKAI, 1958
A rejection criterion based upon the range.
Experimental consideration of the genetic effect of low doses of irradiation on viability in Drosophila melanogaster. Proc. 2nd Intern. Conf. Peaceful Uses Atomic Energy 22 : 325-329.
Experiments on the effects in heterozygous condition of second chromo- somes from natural populations of Drosophila willistoni. Proc. Natl. Acad. Sci. U.S. 38:
471-478.
Viability of Drosophila heterozygous for irradiated chromosomes. Science 130:
The spectrum of severity of mutant effect. I. Haploid effects in yeast.
The process of spontaneous extranuclear mutation in Biometrika 43 : 418-422.
CORDEIRO, A. R., 1952
FALK, R., 1959 1416.
JAMES, A. P., 1959
JAMES, A. P., and P. E. SPENCER, 1958
MULLER, H. J., 1950
RUSSELL, W. L., 1957
STERN, C., G. CARSON, M. KINST, E. NOVITSKI, and D. UPHOFF, 1952 WALLACE, B., 1957
Genetics 44: 1309-1324.
yeast. Genetics 43 : 31 7-331.
Our load of mutations. Am. J. Human Genet. 2: 111-176.
Shortening of life in the offspring of male mice exposed to neutron radia-
The viability of heterozy-
The effect of heterozygosity for new mutations on viability in Drosophila: tion from an atomic bomb. Proc. Natl. Acad. Sci. U.S. 43 : 324-329.
gotes for lethals. Genetics 37: 413-449.