Evaluation of Transmission Wheeling Cost
Using MW, MVAR and MVA Mile
Methodologies
J.Sreenivasulu
1, P. Srinivasula Reddy
2Assistant Professor, Dept. of EEE, JNTUA College of Engineering, Ananthapur, Andhra Pradesh, India1
PG Student [EPS], Dept. of EEE, JNTUA College of Engineering, Pulivendula, Andhra Pradesh, India2
ABSTRACT: In electrical power system, transmission wheeling is “the transmission system and associated facilities of the transmission utility are used by another person for conveyance” and this transmission wheeling provide transmission path for the flow of electrical energy between seller and buyer.
Transmission wheeling cost can be evaluated by using MW, MVAR and MVA-Mile methodologies. In MW, MVAR and MVA methods, three different approaches like reverse, absolute and dominant are used. In literature, evaluation of transmission wheeling cost using only MW mile methodology was implemented, where as in the proposed methods both MVAR and MVA Mile methodologies are implemented. These approaches are developed on IEEE 14-bus system in MATLAB software environment.
KEYWORDS: Deregulation, Transmission Wheeling, MW Mile, MVAR Mile, MVA Mile, Single transaction and Multi transaction.
I. INTRODUCTION
Now a days, demand for electricity increases day to day due to increases in population and their sophisticated requirements like air conditions, lightening, personal computers, home appliances, industrial applications etc. Hence, electricity plays a vital role in our daily life, because of the electricity demand, electric power industry is probably the most and largest complex industry in the world. That’s why we need to utilize the existing power system in an optimal way. Large power companies dominate electric power industry for many years and they have an overall authority in all activities like generation, transmission and distribution of power. Such companies are refereed as vertically integrated utilities.
The main motive behind the call for deregulating the power industry has been consistent in most of the power industries is to achieve greater efficiency in the system management and promotes better tariff policies. Due to electricity sector competition, electric utilities are forced to innovate and operate in the most efficient and economic manner in order to survive and recover their costs. Encouraging private sectors to investment in power industry by reducing or removing restrictions on power industry is known as deregulation in power sectors. The main benefit in deregulated power industry to be able to provide customers with low cost and reliable electrical supply [2].
. The competitive market for electricity has developed at generation end and supply end, but the transmission sector remains monopoly business. The Transco plays a vital role in restructuring of the power industry in the world. The basic parameter of the electric power transmission sector is large sunk and lumped investments need for parallel paths to meet security requirements. That’s why it is a time to introduce third parties open access to the transmission network may be seen as a logical outcome. Transmission of active and reactive power from a seller to buyer through the transmission network owned by a third party is known as power wheeling transactions [1].
In literature, only MW mile method for single transaction was implemented. But, in the proposed method MW
II. MVAR-MILE METHODOLOGY
The reactive power flow-mile on each transmission line of the system due to a particular wheeling transaction is evaluated by obtaining the product of the transmission line length and the change in the magnitude of the reactive power flow caused by the transaction. The reactive power flow-miles of each transmission line are added up to represent the amount of the transmission resources used by the corresponding transaction.
Depending on the direction of reactive power flow, MVAR-Mile method can be described as absolute, dominant
and reverse approaches [3]. Generally, for flow mile methods, the cost allocated to each individual user, Ck is
calculated by using.
N i kC
1 i k i i i Q Q F L Where iL
= length of the circuit,i
F
= pre-determined unit cost reflecting the cost/mile of circuit i, (here Rs. /km),N
= total number of lines in the circuit,k i
Q
= power flow imposed on the circuit i by user k,i
Q
= capacity rating of circuit i.A. Absolute MVAR-Mile Approach
The absolute MVAR-Mile method calculates the charges based on the magnitude of the MVAR-Miles of network used by ignoring the direction of the reactive power flow imposed on the circuit by the user. Reactive power flow imposed
on the circuit i by the user k,
Q
ikis treated based on the following condition.k i
Q
=Q
ik for direct flows and reverse power flowsB. Dominant MVAR-Mile Approach
In the dominant MVAR-Mile approach, reactive power flow imposed on the circuit i by the user k,
Q
ikis treated basedon the following condition,
k i
Q
Q
ik for direct power flows,= 0 for reverse power flows.
C. Reverse MVAR-Mile Approach
The reverse MVAR-Mile approach takes into account of the reactive power flows that are in reverse direction and the charge for each line is based on the net flows. The reason is that the reverse power flows decrease the burden on the
line. Reactive power flow imposed on the circuit i by user k,
Q
ikis treated based on the following condition,k i
Q
= + for direct power flows or= -ve for reverse power flows.
III. MVA-MILE METHODOLOGY
[4]. Generally, for flow mile methods the cost allocated to each individual user,
C
kis calculated by using:
N i i k i i i k S S F L C 1 WhereSik = Apparent power flow imposed on the circuit i by user k,
Si = capacity rating of circuit i.
A. Absolute MVA-Mile Approach
Apparent power flow imposed on the circuit i by the user k,
S
ik is treated based on the following condition,
K i
S
ki
S
for direct and reverse power flowsB. Dominant MVA-Mile Approach
In the dominant MVA-Mile approach, apparent power flow imposed on the circuit i by the user k,
S
ik is treated basedon the following condition, k
i
S
=S
ik for direct flows or = 0 for reverse power flows.C. Reverse MVA-Mile Approach
Apparent power flow imposed on the circuit i by user k,
S
ik is treated based on the following condition,k i
S
= +ve for direct power flows, or= -ve for reverse power flows.
Since these three approaches of MW, MVAR and MVA mile methods are not able to capture the total cost of transmission, hence at each bus postage stamp is applied. Using the postage stamp approach, the residual costs will be apportioned to each user based on its load level. The residue to each individual user Rk, is calculated by using the relation [5]. LT LK k
P
P
TC
R
.
The total cost allocated to each individual user, TCk is calculated by using,
k k k
C
R
TC
WhereTC= total unremunerated charges, PLK = load of user k,
PLT = Total loads of all users.
IV. CASE STUDY
The proposed method uses IEEE 5-machine 14-bus test system. The system contains of 5 generators at bus 1,2,3,6 and 8.The system has a total of 20 transmission lines. Total generation capacity is 490 MW and the initial load is 259 MW. The resistance and reactance are given in the below tables in per unit with a base of transmission line 100 MVA. The
cost of each line is Rs 4800 per kilometre
.
100
Fig 4-1: The IEEE 14-bus test system
V. RESULT
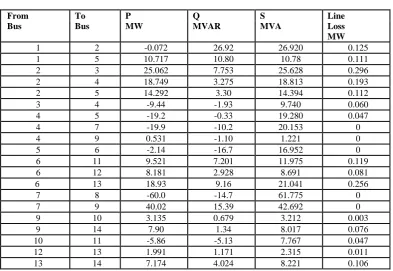
TABLE I
Newton Raphson load flow analysis for a base case
Newton raphson load flow analysis for a base case is presented in the above Table I, which presents the value of power flow which are transmitted between one bus to the another bus and shows the different line losses [7].
SINGLE TRANSACTION
The value of wheeling cost evaluated with the help of three approaches. These approaches are based on incremental power flow and distance to determine the wheeling cost. In results single and multi transactions are
evaluated [6]. Single transaction means the transaction will be done at each bus single buyer at a time
.
A. MVAR-Mile method on single transaction
As mentioned in the above the value of wheeling cost for 60MW transaction is evaluated in the three different methods have used in the incremental power flow and the corresponding data causes are shown in the below fig:5.1. In the first
From To P Q S Line
Bus Bus MW MVAR MVA Loss
MW
1 2 -0.072 26.92 26.920 0.125
1 5 10.717 10.80 10.78 0.111
2 3 25.062 7.753 25.628 0.296
2 4 18.749 3.275 18.813 0.193
2 5 14.292 3.30 14.394 0.112
3 4 -9.44 -1.93 9.740 0.060
4 5 -19.2 -0.33 19.280 0.047
4 7 -19.9 -10.2 20.153 0
4 9 0.531 -1.10 1.221 0
5 6 -2.14 -16.7 16.952 0
6 11 9.521 7.201 11.975 0.119
6 12 8.181 2.928 8.691 0.081
6 13 18.93 9.16 21.041 0.256
7 8 -60.0 -14.7 61.775 0
7 9 40.02 15.39 42.692 0
9 10 3.135 0.679 3.212 0.003
9 14 7.90 1.34 8.017 0.076
10 11 -5.86 -5.13 7.767 0.047
12 13 1.991 1.171 2.315 0.011
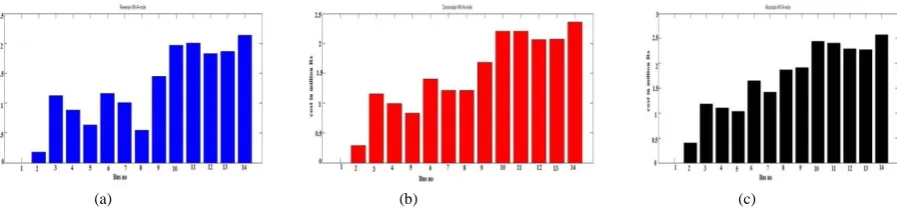
method the value of direct flow is positive and the reverse flow is negative and the result is reduction of positive reactive power as shown in fig: 5.1(a). In second method the value of reverse flow is zero, so addition is only in positive reactive power shown in fig: 5.1(b). In third method, both direct flow and reverse flow are positive. Hence, the result is in positive reactive power shown in fig: 5.1(c).
(a) (b) (c)
Fig 5.1 Wheeling cost evaluation for 60 MW transaction (a) Reverse approach (b) Dominant approach (c) Absolute Approach (Rs/MW/Year)
B. MVA-Mile method on single transaction
Similarly, the above mentioned three methods are implemented in MVA mile method on single transaction and the corresponding data causes are shown in below fig: 5.2.
(a) (b) (c)
Fig 5.2 Wheeling cost evaluation for 60 MW transaction (a) Reverse approach (b) Dominant approach (c) Absolute Approach (Rs/MW/Year)
TABLE II
Transmission wheeling cost evaluation for 60 MW transaction by MVAR and MVA Mile methods for 14 bus
Bus No
MVAR-Mile method MVA-Mile method
Reverse(Rs) Dominant(Rs) Absolute(RS) Reverse(Rs) Dominant(Rs) Absolute(Rs)
1 0 0 0 0 0 0
2 52383.39 68160.71 158704.8 180162.3 292059.6 403957
3 61668.24 128347.3 318362.9 1124426 1155216 1186005
4 145668.5 168341.55 282351.6 881000.3 993501.3 1106002
5 166635 206978.07 220591.1 631221.1 833520.8 1035820
6 162843.7 182006.5 426856.8 1158673 1402240 1645807
7 114042.3 125682 365406.3 1007850 1214547 1421245
8 141281.4 135720.3 412722.1 548146.4 1210081 1872015
9 65303.29 206284.2 347265.1 1444796 1681308 1917820
10 38295.64 209742.9 381190.3 1971349 2204936 2438523
11 31993.36 174932.9 381859.2 2003656 2204079 2404502
12 150099.8 303015.4 455931 1831565 2062374 2293183
13 15551.13 218444.5 421337.9 1862315 2068593 2274872
MULTI TRANSACTION
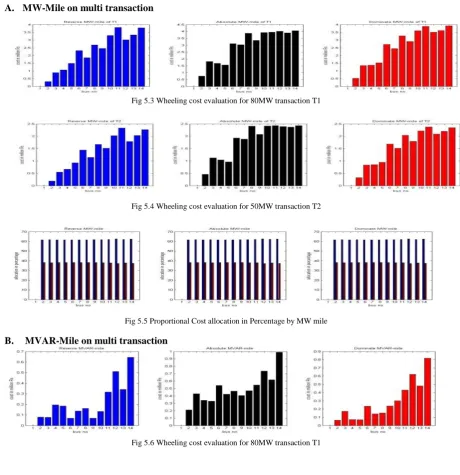
Transmission Wheeling cost evaluation for multi transactions are 80MW and 50MW are shown in below figures. In the first case 80MW of transaction T1 can be evaluated using reverse, absolute and dominant approaches. In the second case 50MW of transaction T2 can be evaluated using reverse, absolute and dominant approaches. Proportional Cost allocation in Percentage can be calculated for respective transactions.
A. MW-Mile on multi transaction
Fig 5.3 Wheeling cost evaluation for 80MW transaction T1
Fig 5.4 Wheeling cost evaluation for 50MW transaction T2
Fig 5.5 Proportional Cost allocation in Percentage by MW mile
B. MVAR-Mile on multi transaction
Fig 5.7 Wheeling cost evaluation for 50MW transaction T2
Fig 5.8 Proportional Cost allocation in Percentage by Mvar-mile
C. MVA-Mile on multi transaction
Fig 5.9 Wheeling cost evaluation for 80MW transaction T1
Fig 5.10 Wheeling cost evaluation for 50MW transaction T2
Fig 5.11 Proportional Cost allocation in Percentage by MVA-mile
VI. CONCLUSION
Based on results it is clear that absolute method provides more revenue to the transmission owner for both single and multi transaction, when compare to reverse and dominate methods. Table II shows that absolute method provides more transmission wheeling cost in MW, MVAR and MVA mile methods for both single and multi transactions. From the results it is also cleared that MVA mile method provides more transmission wheeling cost to the transmission owner compare to the MW and MVAR methods. From the Fig : 5.5, Fig: 5.8 and Fig: 5.11 it is clear that the customer who is consumed less power is to be charged less cost, i.e. he will be charged less proportional to the consumption.
REFERENCES
[1] Gaurav Jain, Kanwardeep singh and derma (2013)”Transmission wheeling cost evaluation using MW-Mile Methodology”IEEE transactions on power systems, Vol. 58, No 2
[2] Operation of restructured power systems by kankar Bhattacharya, math H.J. bollen and Jappe E.daalder
[3] Jing, Z. X., and Duan, X. Z., (2002) “The cost and pricing method of uniform transmission services”, Proceedings of Power on International Conference on Power System Technology, Vol. 3,7, pp. 13-17.
[4] D. Shirmohammmadi, C. Rajgopalan, E.R. Award and C. L. Thomas “Cost of Transmission Transaction: Introduction”, IEEE Trans. On Power System, Vol.6 No.4, Nov 1991, pp. 1546-1560
[5] M y hasan,N.h rasid “wheeling charges methodology for deregulated electricity Markets using tracing based postage stamp methods’vol.3 No .2 2011
[6] Hyde M. Merrill, Bruce W. Erickson, “Wheeling Rates Based on different transactions Marginal cost Theory”, IEEE Trans. on Power System, Vol.4, No. 4, Oct 1989.
[7] power system analysis by H.Saadat
BIOGRAPHY
J. Sreenivasulu received his M. Tech. from JNT University, Anantapur, A. P., India, in 2009. Currently, he is working as Asst. Prof. in EEE Dept., JNTUA College of, Ananthapuramu, A. P., India. His research interest is Electrical Power Engineering Systems.