Online Data Reduction for the Belle II Experiment using DATCON
FlorianBernlochner1, BrunoDeschamps1, JochenDingfelder1, Carlos Marinas1, and Chris-tianWessel1,a
1Physikalisches Institut, University of Bonn, Germany
Abstract.The new Belle II experiment at the asymmetrice+e−accelerator SuperKEKB at KEK in Japan is designed to deliver a peak luminosity of 8×1035cm−2s−1. To
per-form high-precision track reconstruction, e.g. for measurements of time-dependent CP-violating decays and secondary vertices, the Belle II detector is equipped with a highly segmented pixel detector (PXD). The high instantaneous luminosity and short bunch crossing times result in a large stream of data in the PXD, which needs to be signifi-cantly reduced for offline storage. The data reduction is performed using an FPGA-based Data Acquisition Tracking and Concentrator Online Node (DATCON), which uses in-formation from the Belle II silicon strip vertex detector (SVD) surrounding the PXD to carry out online track reconstruction, extrapolation to the PXD, and Region of Interest (ROI) determination on the PXD. The data stream is reduced by a factor of ten with an ROI finding efficiency of>90% for PXD hits inside the ROI down to 50 MeV inpTof the stable particles.
We will present the current status of the implementation of the track reconstruction using Hough transformations, and the results obtained for simulatedΥ(4S)→ BB¯events.
1 Motivation for the Belle II Experiment
Since the Belle experiment stopped taking data in 2010, its successor Belle II is being developed. The Belle II experiment will be located at the KEK laboratory in Japan, at the only interaction point of the SuperKEKB collider, which is the successor of the KEKB machine. SuperKEKB will collide asym-metric energy beams (7 GeV electrons and 4 GeV positrons) with a design instantaneous luminosity of 8×1035cm−2s−1. This luminosity is 40 times the instantaneous luminosity of KEKB. This produces higher data rates and thus higher background rates with which the new Belle II detector has to cope. Due to limited bandwidth of the readout electronics and to minimise the amount of mass storage re-quired, online data reduction is essential. The working principle of one of the two deployed online data reduction systems, the Data Acquisition Tracking and Concentrator Online Node (DATCON) is described in this article.
2 The Belle II Vertex Detector
A sketch of the Belle II detector is shown in Figure 1. The innermost part of the detector is the silicon based vertex detector system (VXD), which is surrounding the beryllium beam pipe. The other
ae-mail: [email protected]
DOI: 10.1051/
,00014 (2017) 71500
1
EPJ Web of Conferences 50 epjconf/201 0014
Figure 1.Overview of the Belle II Detector. Figure 2. The Belle II Vertex Detector. It contains two subdetectors, the PiXel Detec-tor (PXD) with two layers, surrounded by the Silicon Vertex Detector (SVD) with four lay-ers. The innermost radius is 14 mm, the out-ermost radius is 135 mm.
sub-detectors are: the central drift chamber, the solenoid magnet producing a magnetic field of 1.5T, detectors for particle identification, the electromagnetic calorimeter, and an instrumented flux return that can detectKLand muons. The VXD consists of two components: a PiXel Detector (PXD) based
on DEPFET [1] technology and a Silicon Vertex Detector (SVD) based on double-sided silicon strip sensors. The placement of both components is shown in Figure 2. Both PXD and SVD are very thin detectors with only 0.2% and 0.6% of a radiation length per layer, respectively. The PXD consists of 2 layers at radii of 14 and 22 mm from the interaction point with in total 40 modules. A module contains 250×768 pixels, having two types of pixels with a pitch of 50×55μm2 (256 pixels in central region) and 50×70μm2(512 pixels in forward and backward region) for layer 1 and 50×65
μm2(256 pixels in central region) and 50×70μm2(512 pixels in forward and backward region) for layer 2. The information in the 8 million pixels is read out at a data rate of 256 Gb/s, corresponding to 90% of the data rate of the complete Belle II detector without data reduction. The SVD consists of 4 layers at radii ranging between 39 and 135 mm. In total the SVD contains 172 sensors with 768× 768 strips having a pitch of 50 and 160μm (layer 3) and 768×512 strips having a pitch of 75×240
μm (layers 4 to 6), respectively. This results in about 240000 strips in total [2].
II experiment is designed in such a way that only the hits of interest for physics analysis recorded in the PXD are forwarded to permanent storage. To implement this, the hits of other sub-detectors as the SVD are used to execute an online track finding. The reconstructed tracks are then used to define Regions of Interest (ROI) on the PXD and only the subset of pixels inside an ROI are permanently stored. For the maximum tolerable occupancy of 3%, a data reduction factor of about 10 for PXD hit information is required.
3 Data Reduction Concept
!"# !##
$%&'!
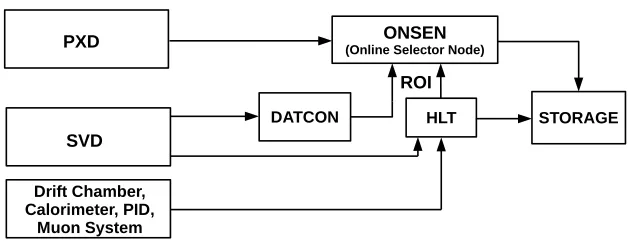
Figure 3. A simplified illustration of the Belle II data acquisition system with the two data reduction systems: DATCON receives hit recorded by the SVD and performs an online track reconstruction to define ROIs on the PXD. The HLT receives hit information from the SVD, the drift chamber, and the muon system as well as information from the PID detectors to define ROIs on the PXD. Both HLT and DATCON run independently of each other. The ROIs of both systems are sent to the ONSEN system, which performs the overall PXD data reduction by applying the ROIs to the PXD data.
Figure 3 shows a simplified sketch of the Belle II Data Acquisition (DAQ) system. The data of the SVD, the drift chamber and the sub-detectors for particle identification (PID), calorimetry and muon detection are sent to the Higher Level Trigger (HLT) [3]. The data from the SVD are additionally sent to the DATCON, which performs online track reconstruction, extrapolation to the PXD, and calculation of ROI’s in the PXD. The ROIs are then sent to the Online Selector Node (ONSEN) [4]. Besides DATCON, the HTL is the second system that performs a calculation of ROI’s in the PXD. For this task the HLT not only can use data from the SVD, but also from the drift chamber and the other sub detectors. In addition, HLT provides the trigger signal for the complete detector and pipelines the data of the sub-detectors, except PXD, to the storage. The PXD data are only sent to ONSEN, which merges the ROI’s of HLT and DATCON and performs the overall PXD data reduction by rejecting hits outside the ROIs. The HLT uses a computing farm with 6400 cores in total and runs sophisticated track finding and fitting algorithms. These HLT algorithms will also be used in the later offline track reconstruction. DATCON, on the other hand, runs a fast FPGA-based track reconstruction.
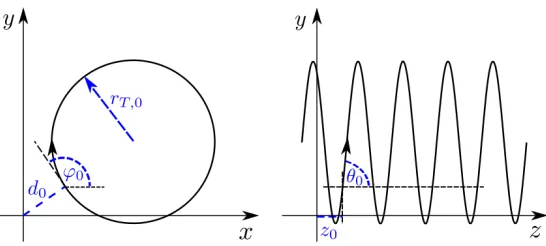
A track in a magnetic field, parametrised by a helix, is characterised by five parameters at the point of closest approach from to the beamline. This is illustrated in Figure 4. The parameters are: the initial azimuthal angleϕ0, the distance of closest approachd0, the radius of the trackrT,0, the initial polar angleθ0, and the initialz-coordinate at the point of closest approachz0.
A schematic overview of the data reduction procedure and the data flow inside DATCON is shown in Figure 5: The ROIs are calculated by using SVD hits to reconstruct tracks and extrapolating the
DOI: 10.1051/
,00014 (2017) 71500
1
EPJ Web of Conferences 50 epjconf/201 0014
Figure 4. Two-dimensional view of a helix as parametrisation of a track inside a magnetic field. The index 0 indicates parameters at the point of closest approach of an ideal track. The values of these parameters can change with time due to e.g. multiple scattering or other processes which cause energy loss.
trajectories to the PXD. For the purpose of track finding, the tracks are assumed to be circular in the x-y-plane , with an additional ghost hit at the origin of the coordinate system where the beam spot is located. The algorithm assumes that the trajectories can be approximated by straight lines in the r-z-plane withz00. The hits are transformed using Hough [5] and Hesse transformations:
ρ = 2
r2 hit
·x cosϕ +ysinϕ, (1)
s = rhit cosθ +zhitsinθ, (2)
whereρ = rT1 denotes the track curvature,rhitis the distance of the hit from thez-axis ,zdenotes the globalzcoordinate of the hit, andx, yare the conformally transformed values ofx, yof the hit defined by:
x, y =
xhit, yhit
r2 hit
=
xhit, yhit
x2 hit +y2hit
. (3)
The conformal transformation is only valid ford0 =0, which is a good approximation forB-meson decays as their decay products (except the charged particlese±,μ±,π±, andp/p¯) only have a short life-time and decay in close proximity to the origin of thez-axis . Note that the conformal transformation is needed as the Hough transformation is better applicable to straight lines. Using conformal and Hough transformation, a helix trajectory is mapped onto a straight line. Hits on this straight line correspond to intersecting of lines in the Hough parameter space. Thus the task of finding tracks in real space is equivalent to finding intersections of lines in Hough space. Once the intersections are found, equations 1 and 2 allow for a straightforward computation of the angle and track curvature
ρ = 1
rT.
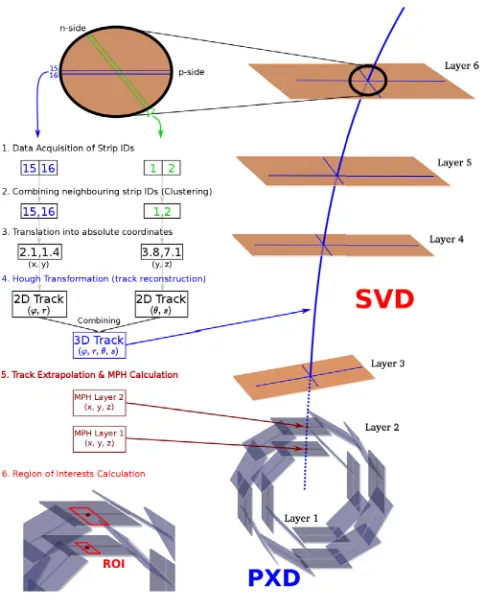
Figure 5. Schematic overview of the DATCON track reconstruction and extrapolation to the PXD. The data of the the SVD strips (1.) are converted to clusters (2.) in local detector coordinates, from which the absolute coordinates of the hits are computed (3.). These coordinates are Hough-transformed (4.) to reconstruct possible tracks, yielding two 2D tracks with information onϕandr, andθands, respectively. The information is combined to obtain 3D tracks, which are extrapolated to the PXD. The positions of the most probable hits are calculated from the intersection of the extrapolated tracks with the PXD layers (5.). Finally the ROI’s on the two PXD layers are calculated (6.).
4 Preliminary Results
To develop and test the necessary algorithm to be implemented on an FPGA, a C++ and python based implementation of the algorithm is used, running inside the Belle II Analysis and Software Framework (BASF2) [6]. The BASF2 framework allows for the simulation of the detector response of particles traversing the Belle II detector and includes the full decay chain ofΥ(4S)→ BB¯ → stable particles (i.e. e±,μ±,π±,p/p, and¯ KL). This allows one to assess the performance of a given
algorithm using simulated decays and variable background conditions. The preliminary performance of such simulations of the DATCON using 100,000 simulatedBB¯events are shown.
Figure 6 shows the performance of the track reconstruction for the azimuthal and the polar angle: 92% and 93% of all reconstructed tracks are within 1◦of the true track inϕandθ, respectively.
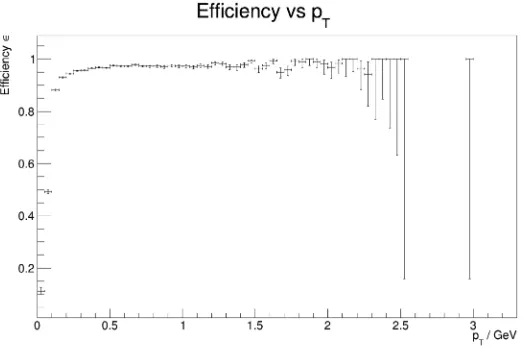
In Figure 7, the track reconstruction efficiency as a function of the transverse momentum, pT, is shown: The overall track reconstruction efficiency is 96% over the complete momentum range
DOI: 10.1051/
,00014 (2017) 71500
1
EPJ Web of Conferences 50 epjconf/201 0014
Figure 6.Angular residualsΔof the reconstructed tracks, defined as difference between reconstructed and true angles, forϕ(blue) andθ(red) of the cases. In 92% (ϕ) and 93% (θ), respectively, the reconstructed values show a deviation of less than 1◦from the true track. The sharp edges edges at ±0.35◦and ±0.7◦in both distributions are caused by the discrete Hough space.
Figure 7.Track reconstruction efficiency as a function of the transverse momentumpT. The sharp drop in the low-pT region is caused by the fact that particles withpT<80 MeV do not reach the third layer of the SVD and thus do not produce the required minimum number of three SVD hits. The large error bars forpT >1.5 GeV are due to limited occurrence of particles with such a transverse momentum in the simulation. The average track reconstruction efficiency is 96% in the completepT-range shown.
Figure 8.Residuals of the extrapolation to the PXD (measured in pixels) in local sensor coordinatesuandv. The residual is defined as the difference between the local coordinates of the extrapolated hit and the local coordinates of the true simulated Monte-Carlo hit. The left side shows the residuals on a logarithmic scale and the ROI of 80×120 pixels around the MPH as a red box. The right side shows a 3D illustration of the residuals. With ROIs of size 80×120 pixels, the ROI finding efficiency is 94% with a data reduction factor of 15. To obtain a higher ROI finding efficiency, it is possible to further increase the ROI size while still reducing the data by a factor of about 10.
Figure 9.Efficiency of the ROI finding as a function of trackpT. Particles with a transverse momentum below 80 MeV cannot be found during tracking, and thus also no extrapolation is possible for these tracks. For tracks withpT>100 MeV, the ROI finding efficiency is above 90%, the average over the completepT-range is larger than 94%, with the data reduction factor being above 10.
Figure 8 shows the residuals of the extrapolated hits, defined as the difference between the local position of the extrapolated hit and the local position of the true MC hit, measured in pixels in the local coordinatesuandv. Over 90% of the extrapolated hits are very close to the true hit position within
DOI: 10.1051/
,00014 (2017) 71500
1
EPJ Web of Conferences 50 epjconf/201 0014
ΔR= √u2+v2of 50 pixels, and 94% of all MPHs in the PXD are located such that the ROIs of size 80×1120 pixels (u×v) calculated around the MPHs include the corresponding true PXD hits. As can be seen in Figure 8, the residual distribution is slightly wider inv-direction than inu-direction, which is why the ROI size is chosen to be larger inv-direction. Finally, Figure 9 shows the ROI-finding efficiency as a function of trackpT. The average ROI-finding efficiency over the whole pT-range is larger than 94%, and for tracks withpT>100 MeV the algorithm is nearly 100% efficient. The median data reduction factor is about 15, leaving room to further optimise the ROI size and other aspects of the algorithm.
5 Conclusions and Outlook
In this article the performance of the DATCON system was presented: DATCON performs an FPGA-based online track reconstruction to define ROIs on the Belle II Pixel Detector using reconstructed hits from the Silicon Vertex Detector. This allows one to reduce the amount of data needed to be stored offline. The currently achieved median data reduction factor is 15. The track reconstruction efficiency that can be achieved withΥ(4S)→ BB¯events is about 96% over the fullpT range, as determined by simulation. The efficiency of finding a true hit within a DATCON ROI is 94%. Future improvements on the performance could be obtained by tuning the ROI size using thepT of the reconstructed tracks or by improving the clustering of the Hough space.
Acknowledgements
This work is supported by the German Federal Ministry of Education and Research (BMBF).
References
[1] R.H. Richter et al., Nucl. Instrum. Meth.A511, 250 (2003) [2] T. Abe et al. (Belle-II) (2010),1011.0352
[3] R. Itoh, T. Higuchi, M. Nakao, S.Y. Suzuki, S. Lee, IEEE Trans. Nucl. Sci.60, 3720 (2013) [4] K. Lautenbach et al., JINST12, C06023 (2017)
[5] P.V.C. Hough,C590914, 554 (1959)