Article
1
Comparative Transcriptome Analysis of Gene
2
Expression Patterns in Tomato under Different Light
3
Intensity Distributions
4
Juanjuan Ding
1,†, Jiantao Zhao
2,†, Tonghua Pan
1, Linjie Xi
1, Jing Zhang
1,*and
5
Zhirog Zou
1,*
6
1 College of Horticulture, Northwest A&F University, Yangling 712100, China; [email protected];
7
[email protected]; [email protected]
8
2 INRA, UR1052, Génétique et Amélioration des Fruits et Légumes, Domaine Saint Maurice, 67 Allée des
9
Chênes CS 60094 – 84143 Montfavet Cedex, France; [email protected]
10
* Correspondence: [email protected]; Tel: +86-029-87082613; [email protected];
11
Tel.: +86-029-87081192
12
† These two authors contributed equally to the present study.
13
14
15
Abstract:
Plants grown under fluctuating light impact plant developments compared with those16
grown under non-fluctuating light conditions. However, our knowledge on the underlying
17
regulatory mechanisms is still quite limited, particularly from the transcriptional perspective. In
18
order to investigate the influence of different light intensity distributions on tomato plant
19
development, we designed three fluctuating light intensity distributions with the non-fluctuating
20
light intensity as control and compared the transcriptional differences after five weeks of
21
treatment. We found plant height and aerial/root weight were significantly reduced under all
22
fluctuating light treatments. Transcriptome analysis revealed that the number of up and down
23
regulated genes had a distinct distribution pattern between different treatments and control. The
24
largest difference between the numbers of down and up regulated genes was found between
25
treatment 1 and 3, reaching to a total of 416 genes. The number and type of the top 20 enriched
26
pathways differed between treatments and control. The largest number of genes enriched was
27
involved in the biosynthesis of secondary metabolites. These results provide insights into the
28
transcriptional regulations of tomato under different light intensity distributions.
29
30
Keywords:
transcriptome; Solanum lycopersicum; RNA-seq; light intensity distributions;31
differentially expressed genes.
32
33
34
35
36
1. Introduction
37
Artificial light sources are widely used in crop cultivation systems [1], especially in controlled
38
environmental conditions for precise growth control in closed plant factories [2]. However, artificial
39
light source requires excessive energy consumption and accounts for up to 85% of total power
40
consumption in a closed plant factory [3]. Increasing light intensity is an effective method to
41
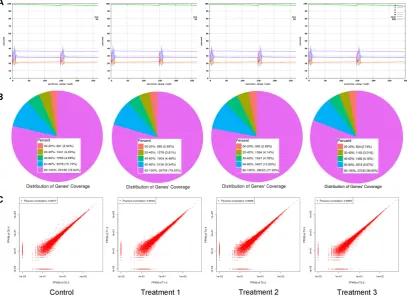
promote plant growth and development, as well as potentially reduce the energy cost [1,3–8].
42
Biomass production and quality can be improved by adjusting light intensity, light quality, light
43
period, and light source, demonstrating the great potentials of wild applications [6,9–11].
44
Durations of monochromatic light distribution has an impact on plant biomasses [12,13]. Light
45
fluctuations also impact plant phenotypes and acclamatory responses [5]. Light intensities of
46
uniform spectra have difference influences on the growth and leaf development of young tomato
47
plants under red and blue light-emitting diodes (LED) light combinations [9]. Proper management
48
of light use efficiency could improve photosynthesis, resulting a higher yield potentials [5,14,15].
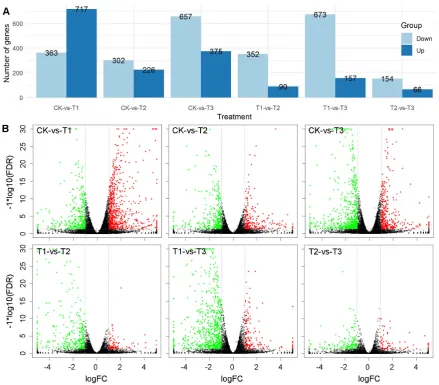
49
However, our knowledge on the light energy distribution under uniform daily light integral (DLI)
50
and light period is still limited, especially the underlying regulation mechanisms.
51
Tomato is the highest-value fruit and vegetable crop worldwide [16]. This fruit contains
52
diverse nutritional and health-promoting metabolites, including sugars, lycopene, organic acids,
53
amino acids and volatiles [17–23]. However, the underlying regulations of these complex traits are
54
quite complex [18,23–28]. Light intensity distributions showed potentials to improve plant biomass.
55
However, the underlying mechanisms are quite complex and our understandings are still remain
56
quite limited. High-through output RNA sequencing (RNA-seq) is a powerful and cost-effective
57
tool to investigate the gene transcript profiling in various species [29–36]. In this study, RNA-seq
58
technology was used to investigate the transcriptome differences between different light intensity
59
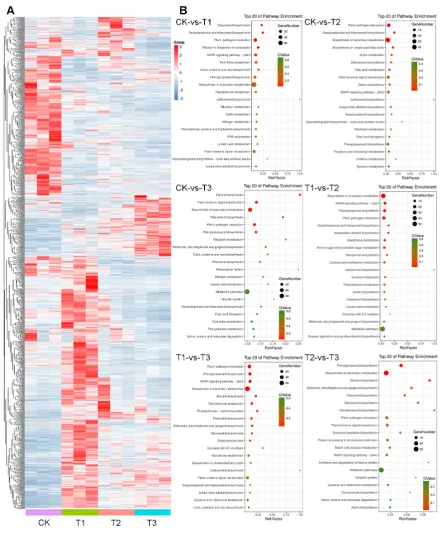
distributions, in order to deepen our knowledge in the underlying regulatory mechanisms and
60
promote artificial light applications and efficiencies.
61
62
2. Results
63
2.1. Experimental Design and Phenotypic Characterization
64
In this study, we divided the total photosynthetic photo flux Intensity during the day into
65
different distributions (Figure 1A). All three treatments had the same total photosynthetic photo
66
flux Intensity compared with the control. After five weeks of treatment, plant heights of all three
67
treatments were significantly reduced, compared with the control (Figure 1B,C). In addition, both
68
the fresh and dry weight of aerial and root were also significantly reduced, compared with the
69
control (Figure 1D). These results showed that light Intensity distributions during the time had a
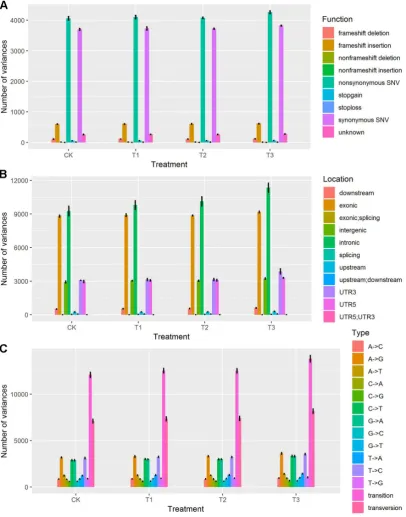
70
significant impact on the morphological development of tomato.
74
Figure 1. Experiment design and measurements of fresh and dry weight of aerial and root respectively.
75
(A) Light distribution patterns of control (CK), treatment 1 (T1), treatment 2 (T2) and treatment 3 (T3). (B)
76
Morphological comparisons between different treatments after five weeks. (C) Comparison of plant height
77
between different treatments after five weeks. (D) Comparisons of fresh weight of aerial part, dry weight of
78
aerial part, fresh weight of root part and dry weight of root part between different treatments after five weeks.
79
80
2.2. Transcriptome Sequencing, Assembly and Annotation
81
In order to understand the mechanisms of the effects of light Intensity distributions on the
82
development of tomato, we performed RNA-seq based deep transcriptome sequencing analysis,
83
after five weeks of treatments. The sequencing quality for all the treatments and the control was
84
quite high, after cleaning the raw sequencing data. The percentage of bases with Q20 (high
85
sequencing quality) was close to 100 percent (Figure 2A). Gene coverage ranged from 80% to 100%
86
accounted for approximately 80% of the total genes (Figure 2B). Within each control or treatment,
87
the correlation coefficient between replicates was higher than 99.5%, indicating a high consistency
88
between replicates (Figure 2C). These results showed that the transcriptome sequencing quality was
89
sufficiently high for further analyses.
91
Figure 2. Transcriptome sequencing quality analysis between treatments and control. (A) Base
92
composition and quality distributions. (B) Statistic maps of gene coverage. (C) Correlation coefficient maps
93
between different sequencing repeat.
94
95
2.3. Gene Expression Difference Analysis
96
Difference analysis of gene expression between treatments was performed using edgeR
97
software [37,38]. FDR and log2FC were used to screen differential genes. The screening conditions
98
were FDR < 0.05 and |log2FC| > 1. Hundreds of genes were up or down regulated between control
99
and treatments, as well as between different treatments (Figure 3A). In general, the number of up
100
regulated genes was lower than that of down regulated genes, with the only exception between
101
treatment 1 and control. In particular, the largest difference between the numbers of down
102
regulated and up regulated genes was found between treatment 1 and 3, reaching to a total of 416
103
genes (Figure 3A). Volcano plots demonstrated that the number of up and down regulated genes
104
had a distinct distribution pattern between different treatments and control (Figure 3B). For
105
example, the distribution pattern of down regulated genes between treatment 1 were much higher
106
than that of treatment 2 and 3, respectively. Though the number between down and up regulated
107
genes between treatment 2 and 3 were smaller compared with other comparison, the distribution
108
patterns were quite similar (Figure 3B). These results showed clear global gene expression patterns
109
between different treatments and control.
111
112
Figure 3. Difference analysis of gene expression between treatments. (A) Comparison of the number of
113
up and down regulated genes. (B) Volcano plots between treatments and control. Red and green points
114
represent up and down regulated genes, respectively.
115
116
2.4. Global Gene Expression Patterns and Pathway Enrichment
117
Gene clustering heatmap revealed a distinct global gene expression pattern between control
118
and treatments (Figure 4A). In particular, a large group of genes were identified with higher
119
expressions, compared with the other treatments, as well as the control. For treatment 2 and 3,
120
distinct genes with high expression levels were also identified (Figure 4A). We then performed GO
121
expression enrichment analysis (Figure 4B). For each comparison, the top 20 enriched pathways
122
differed in both the number and type of pathways and also the order of the most highly enriched
123
pathways (Figure 4B). Similarly, the largest number of genes enriched was involved in the
124
biosynthesis of secondary metabolites, though the degree of enrichment might not be the highest
125
compared with the other top enriched pathways (Figure 4B).
127
128
Figure 4. Gene expression clustering and GO pathway enrichment analysis. (A) Global gene
129
expression patterns between control and treatments. (B) GO pathway enrichment analysis between control and
130
treatments. RichFactor refers to the ratio of the number of transcripts in the pathway entry in the differentially
131
expressed transcript to the total number of transcripts in the transcript that are located in the pathway entry.
132
The larger the RichFactor, the higher the degree of enrichment. QValue is the PValue after multiple hypothesis
133
test corrections, ranging from 0 to 1, the closer to zero, the more significant the enrichment. The figure is
134
plotted using the Qvalue from small to large to sort the top 20 paths.
135
136
2.5. SNP/InDel Annotations
137
Transcriptome sequencing also identified various single nucleotide polymorphisms
138
(SNPs) (Figure 5). Up to nine types of functional variations were identified for each control and
treatment, such as frameshift/nonframeshift deletion/insertion and nonsynonymous SNV (Figure
140
5A). Among these, nonsynonyous SNV and synonyous SNV represented the dominant functional
141
variations, with an overall similar trend for all type of functional variations (Figure 5A). In addition,
142
these SNPs were located in different locations, with the dominant locations in exonic and intronic
143
locations, both of which were highest among all treatment and control (Figure 5B). All mutation
144
types were identified in all each treatment, as well as the control, with two dominant types of
145
transition and transversion (Figure 5C). These results demonstrated a comprehensive
146
transcriptional regulation in tomato under different light Intensity distributions.
147
148
Figure 5. Gene expression clustering and GO pathway enrichment analysis. (A) Global gene expression
149
patterns between control and treatments. (B) GO pathway enrichment analysis between control and
150
treatments.
151
3. Discussion
153
The light environment acts as not only a photosynthetic driving force, but also a signal of plant
154
morphological and physiological adaption under different environmental changes [39–44]. Plants
155
grown under fluctuating light had significantly lower dry mass compared with those grown under
156
non-fluctuating light conditions [5,12], which is consistent with the results obtained in this study.
157
Results from this study also demonstrated the possibility to regulate plant heights by modifying the
158
light intensity distributions [45,46].
159
The treatments in this study represent a miniature of natural daily light distributions,
160
providing possible hints on the influence of circadian clock on plant development. In this study,
161
many genes involved in hormone metabolism are circadian controlled, such as abscisic acid, auxin,
162
and cytokines [47]. Transcriptome-based analysis in this study identified many differentially
163
expressed genes belonged to diverse gene pathways. Notably, the largest number of genes enriched
164
in different treatments and control was metabolite-related pathways, demonstrating the great
165
influence of light intensity distributions on primary and secondary metabolites. As a central
166
mediator in the coordination of metabolism, circadian clock in higher plants maintains homeostasis
167
under a predictable, changing environment [48], which involved in dynamic regulations of diverse
168
physiological processes [40]. However, the highest light intensity of treatments still did not reach
169
the tomato light saturation point, which is limited by the maximum number of lamps in the
170
artificial green box. Further investigations are needed to identify the key regulated metabolites and
171
the relationship between transcriptome and metabolome. It is also of great interests to investigate
172
the influence of light intensity distributions during a complete tomato life circle, especially the key
173
metabolic differences of tomato fruit quality at the red-ripe stage.
174
175
176
177
178
4. Materials and Methods
179
4.1 Materials and Plant Growth Condition
180
Tomato seeds (Solanum lycopersicum) (Jinpeng No.1) were used as the research material. Seeds
181
were sown in a plastic seedling tray (53 cm × 27.5 cm × 4.5 cm) within the artificial climate chamber
182
at south campus, Northwest A&F University, Yangling, China. The pH of nutrient solution was 5.5,
183
with the concentration of N, P2O5 and K2O at 28, 76 and 132 mg/L, respectively. The temperature
184
and relative humidity during the time were 28°C and 65%, respectively, which decreased to 18°C
185
and 55% at night. Three weeks after sowing, plants were transplanted into 7 cm × 7 cm × 8 cm black
186
plastic pots. After three weeks’ irrigation with a half dose Yamazaki nutrient solution (EC 1.0 ± 0.2
187
mS/cm), the dose of solution was doubled (pH 6.5 ± 0.5, EC 2.0 ± 0.5 mS/cm) till light Intensity
188
treatment.
189
4.2 Light Intensity Distribution Design
190
Three different light Intensity distributions (treatment 1, 2 and 3, hereafter T1, T2 and T3) were
191
designed in order to investigate their effects on tomato plant early stage development. The total
192
daily light integral for each treatment and the control was the same during each day, with a total
193
lighting period of 12 h. We first set a non-fluctuating light intensity at 200 μmol m-1 s-1 for 12 h as
194
the control. We then modified the highest light intensity to 400 μmol m-1 s-1 for 2 h, after 4h30min
195
(T1), 3h (T2) and 6h (T3) lighting (Figure 1A). Light intensity was measured using the PAR meter
196
(Model MQ-100, Apogee Instruments Inc., Logan, Utah, USA). The nutrient solution and
197
environmental conditions, except the light Intensity, was the same till the end of experiment.
4.3 Morphological Measurements
199
After five weeks of light treatments, fresh tomato plants were divided into two groups
200
randomly. The fresh developed leaves from the first group with similar morphological shapes were
201
immediately frozen with -80 °C liquid nitrogen for RNA sequencing. The remaining samples were
202
used for measurements of some morphological traits, including plant height, fresh aerial and root
203
weight, which were quickly dried at 105°C for 15 min and then kept at 60 to 80 °C for 48 h, till the
204
samples were completely dried. The dried aerial and root weight were then measured to compare
205
with the fresh weight.
206
4.4 RNA Extraction and Illumina Sequencing
207
Total RNAs were extracted from the frozen fresh tomato leaves using the EASYspin Plus Kit
208
according to the manufacturer’s instructions (Aidlab Biotechnologies Co. Ltd., Beijing, China). The
209
quality and quantity of extracted RNAs was measured using agar gel electrophoresis and
210
Nanodrop micro spectrophotometer (Thermo Scientific, Wilmington, DE, USA). RNAs from three
211
biological repeats with the same concentration and volume were equally combined for RNA-seq.
212
Library was constructed using the NEBNext Ultra RNA library prep kit (NEB#E7530, New England
213
Biolabs, USA). The quality of the cDNA library was measured using DNA 1000 assay Kit
(5067-214
1504, Agilent Technologies, Santa Clara, CA, USA) before sequencing on an Illumina HiSeq TM
215
2500 by Gene Denovo Biotechnology Co. (Guangzhou, China).
216
4.5 Sequence Quality Control and De Novo Assembly
217
Raw reads containing adapters, with more than 10% of unknown nucleotides and with more
218
than 50% of low quality (Q-value ≤ 20) bases were filtered before mapping to ribosome RNA
219
(rRNA) database in Bowtie2 [49]. Mapped rRNA reads were removed before mapping to reference
220
genome by TopHat2 (version 2.0.3.12) [50]. The reconstruction of transcripts was carried out with
221
software Cufflinks [51], together with TopHat2. Gene abundances were quantified by software
222
RSEM [52]. The gene expression level was normalized by using FPKM (Fragments Per Kilobase of
223
transcript per Million mapped reads) method. Single-nucleotide Polymorphism (SNP) were
224
identified in GATK [53] and SNP/InDel annotation was done using ANNOVAR [54].
225
4.6 Differentially Expressed Genes (DEGs) Analysis
226
Differentially expressed genes across treatments and control were identified using the edgeR
227
package (http://www.r-project.org/) in R. Genes with a fold change ≥2 and a false discovery rate
228
(FDR) <0.05 were treated as significant DEGs. DEGs were then subjected to enrichment analysis of
229
GO functions and KEGG pathways.
230
4.7 Gene and Pathway Enrichment Analysis
231
Gene Ontology (GO) enrichment analysis provides all GO terms that significantly enriched in
232
DEGs comparing to the genome background. All DEGs were mapped to GO terms in the Gene
233
Ontology database (http://www.geneontology.org/). Significantly enriched GO terms (FDR
234
Correction p-value ≤ 0.05) were identified by hypergeometric test by comparing with the genome
235
background. Pathway enrichment analysis was performed using the Kyoto Encyclopedia of Genes
236
and Genomes (KEGG) database [55]. Pathways with FDR corrected p-value ≤ 0.05 were defined as
237
significantly enriched pathways in DEGs.
Author Contributions: Conceptualization, J.Z., Z.Z, and J.D; Methodology, J.D., T.P. J.-T.Z. and Z.Z; Software,
242
J.-T.Z. and J.D.; Validation, J.D.; Formal Analysis, J.D. and J.-T.Z.; Resources, J.D.; Data Curation, J.D., J.-T.Z.
243
T.P. and L.X.; Writing-Original Draft Preparation, J.-T.Z. and J.D.; Writing-Review & Editing, all co-authors;
244
Visualization, J.-T.Z; Supervision, J.Z. and Z.-R.Z; Project Administration, J.Z. and Z.-R.Z.; Funding
245
Acquisition, J.Z. and Z.-R.Z.
246
247
Funding: This research was funded by the Research and development of structure optimization and
248
supporting technology of energy-saving solar greenhouse [2017ZDXM-NY-057] and the Study on key
249
technologies of healthy vegetable production in protected-horticulture with high efficient utilization of
250
resources [2016ZB09]. J.-T.Z. is funded by the Chinese Scholarship Council (CSC) scholarship [201606300007].
251
Acknowledgments: This research was supported by the Key Laboratory of Protected Horticultural
252
Engineering in Northwest, Ministry of Agriculture and Rural Affairs, PR China. We thank Changxun Mu for
253
providing help to build the light system and Jingjing Qiao for the technical support for the artificial climate
254
control room.
255
256
Conflicts of Interest: The authors declare no conflict of interest.
257
258
259
References
260
1. Ibaraki, Y. Lighting Efficiency in Plant Production Under Artificial Lighting and Plant
261
Growth Modeling for Evaluating the Lighting Efficiency. In LED Lighting for Urban
262
Agriculture; Springer Singapore: Singapore, 2016; pp. 151–161.
263
2. Goto, E. Plant production in a closed plant factory with artificial lighting. Acta Hortic.2012,
264
956, 37–49, doi:10.17660/ActaHortic.2012.956.2.
265
3. Kozai, T. Resource use efficiency of closed plant production system with artificial light:
266
Concept, estimation and application to plant factory. Proc. Japan Acad. Ser. B 2013, 89, 447–
267
461, doi:10.2183/pjab.89.447.
268
4. Yin, Z.-H.; Johnson, G. N. Photosynthetic Acclimation of Silene Dioica to Growth in
269
Fluctuating Light. Photosynth. Mech. Eff.2017, 2277–2280, doi:10.1007/978-94-011-3953-3_533.
270
5. Vialet-Chabrand, S.; Matthews, J. S. A.; Simkin, A. J.; Raines, C. A.; Lawson, T. Importance of
271
Fluctuations in Light on Plant Photosynthetic Acclimation. Plant Physiol. 2017, 173, 2163–
272
2179, doi:10.1104/pp.16.01767.
273
6. Fu, Y.; Li, H.; Yu, J.; Liu, H.; Cao, Z.; Manukovsky, N. S.; Liu, H. Interaction effects of light
274
intensity and nitrogen concentration on growth, photosynthetic characteristics and quality
275
of lettuce (Lactuca sativa L. Var. youmaicai). Sci. Hortic. (Amsterdam). 2017, 214, 51–57,
276
doi:10.1016/J.SCIENTA.2016.11.020.
277
7. Sago, Y. Effects of Light Intensity and Growth Rate on Tipburn Development and Leaf
278
Calcium Concentration in Butterhead Lettuce. HortScience 2016, 51, 1087–1091,
279
doi:10.21273/hortsci10668-16.
280
8. Manivannan, A.; Soundararajan, P.; Halimah, N.; Ko, C. H.; Jeong, B. R. Blue LED light
281
enhances growth, phytochemical contents, and antioxidant enzyme activities of Rehmannia
282
glutinosa cultured in vitro. Hortic. Environ. Biotechnol.2015, 56, 105–113,
doi:10.1007/s13580-283
015-0114-1.
9. Fan, X. X.; Xu, Z. G.; Liu, X. Y.; Tang, C. M.; Wang, L. W.; Han, X. lin Effects of light intensity
285
on the growth and leaf development of young tomato plants grown under a combination of
286
red and blue light. Sci. Hortic. (Amsterdam).2013, 153, 50–55, doi:10.1016/j.scienta.2013.01.017.
287
10. Jeong, B. R.; KrishnaKumar, S.; Hwang, S. J.; Atulba, S. L. S.; Kang, J. H. Light intensity and
288
photoperiod influence the growth and development of hydroponically grown leaf lettuce in
289
a closed-type plant factory system. Hortic. Environ. Biotechnol. 2014, 54, 501–509,
290
doi:10.1007/s13580-013-0109-8.
291
11. Peng, X.; Wang, T.; Li, X.; Liu, S. Effects of light quality on growth, total gypenosides
292
accumulation and photosynthesis in Gynostemma pentaphyllum. Bot. Sci.2017, 95, 235–243,
293
doi:10.17129/botsci.667.
294
12. Jao, R. C.; Fang, W. Growth of potato plantlets in vitro is different when provided
295
concurrent versus alternating blue and red light photoperiods. HortScience2004, 39, 380–382,
296
doi:10.21273/HORTSCI.39.2.380.
297
13. Rabara, R. C.; Behrman, G.; Timbol, T.; Rushton, P. J. Effect of Spectral Quality of
298
Monochromatic LED Lights on the Growth of Artichoke Seedlings. Front. Plant Sci.2017, 8,
299
190, doi:10.3389/fpls.2017.00190.
300
14. Slattery, R. A.; VanLoocke, A.; Bernacchi, C. J.; Zhu, X.-G.; Ort, D. R. Photosynthesis, Light
301
Use Efficiency, and Yield of Reduced-Chlorophyll Soybean Mutants in Field Conditions.
302
Front. Plant Sci.2017, 8, 549, doi:10.3389/fpls.2017.00549.
303
15. Gu, J.; Zhou, Z.; Li, Z.; Chen, Y.; Wang, Z.; Zhang, H.; Yang, J. Photosynthetic Properties and
304
Potentials for Improvement of Photosynthesis in Pale Green Leaf Rice under High Light
305
Conditions. Front. Plant Sci.2017, 8, 1082, doi:10.3389/fpls.2017.01082.
306
16. FAO The State of the World’s Forest Genetic Resources; 2014; ISBN 9789251084021.
307
17. Goff, S. A.; Klee, H. J. Plant volatile compounds: Sensory cues for health and nutritional
308
value? Science (80-. ).2006, 311, 815–819, doi:10.1126/science.1118446.
309
18. Sauvage, C.; Segura, V.; Bauchet, G.; Stevens, R.; Do, P. T.; Nikoloski, Z.; Fernie, A. R.;
310
Causse, M. Genome-Wide Association in Tomato Reveals 44 Candidate Loci for Fruit
311
Metabolic Traits. Plant Physiol.2014, 165, 1120–1132, doi:10.1104/pp.114.241521.
312
19. Bauchet, G.; Grenier, S.; Samson, N.; Segura, V.; Kende, A.; Beekwilder, J.; Cankar, K.;
313
Gallois, J.-L.; Gricourt, J.; Bonnet, J.; Baxter, C.; Grivet, L.; Causse, M. Identification of major
314
loci and genomic regions controlling acid and volatile content in tomato fruit: implications
315
for flavor improvement. New Phytol.2017, 215, 624–641, doi:10.1111/nph.14615.
316
20. Tieman, D.; Zhu, G.; Resende, M. F. R.; Lin, T.; Nguyen, C.; Bies, D.; Rambla, J. L.; Beltran, K.
317
S. O.; Taylor, M.; Zhang, B.; Ikeda, H.; Liu, Z.; Fisher, J.; Zemach, I.; Monforte, A.; Zamir, D.;
318
Granell, A.; Kirst, M.; Huang, S.; Klee, H. A chemical genetic roadmap to improved tomato
319
flavor. Science (80-. ).2017, 355, 391–394, doi:10.1126/science.aal1556.
320
21. Zhao, J.; Xu, Y.; Ding, Q.; Huang, X.; Zhang, Y.; Zou, Z.; Li, M.; Cui, L.; Zhang, J. Association
321
Mapping of Main Tomato Fruit Sugars and Organic Acids. Front. Plant Sci. 2016, 7, 1286,
322
doi:10.3389/fpls.2016.01286.
22. Zhang, J.; Zhao, J.; Xu, Y.; Liang, J.; Chang, P.; Yan, F.; Li, M.; Liang, Y.; Zou, Z.
Genome-324
Wide Association Mapping for Tomato Volatiles Positively Contributing to Tomato Flavor.
325
Front. Plant Sci.2015, 6, 1042, doi:10.3389/fpls.2015.01042.
326
23. Zhao, J.; Sauvage, C.; Zhao, J.; Bitton, F.; Bauchet, G.; Liu, D.; Huang, S.; Tieman, D. M.; Klee,
327
H. J.; Causse, M. Meta-analysis of genome-wide association studies provides insights into
328
genetic control of tomato flavor. Nat. Commun.2019, Accepted.
329
24. Tieman, D.; Bliss, P.; McIntyre, L. M.; Blandon-Ubeda, A.; Bies, D.; Odabasi, A. Z.;
330
Rodríguez, G. R.; Van Der Knaap, E.; Taylor, M. G.; Goulet, C.; Mageroy, M. H.; Snyder, D.
331
J.; Colquhoun, T.; Moskowitz, H.; Clark, D. G.; Sims, C.; Bartoshuk, L.; Klee, H. J. The
332
chemical interactions underlying tomato flavor preferences. Curr. Biol. 2012, 22, 1035–1039,
333
doi:10.1016/j.cub.2012.04.016.
334
25. Mageroy, M. H.; Tieman, D. M.; Floystad, A.; Taylor, M. G.; Klee, H. J. A Solanum
335
lycopersicum catechol-O-methyltransferase involved in synthesis of the flavor molecule
336
guaiacol. Plant J.2012, 69, 1043–1051, doi:10.1111/j.1365-313X.2011.04854.x.
337
26. Ye, J.; Wang, X.; Hu, T.; Zhang, F.; Wang, B.; Li, C.; Yang, T.; Li, H.; Lu, Y.; Giovannoni, J. J.;
338
Zhang, Y.; Ye, Z. An InDel in the Promoter of Al-ACTIVATED MALATE TRANSPORTER9
339
Selected during Tomato Domestication Determines Fruit Malate Contents and Aluminum
340
Tolerance. Plant Cell2017, 29, 2249–2268, doi:10.1105/tpc.17.00211.
341
27. Klee, H. J.; Giovannoni, J. J. Genetics and Control of Tomato Fruit Ripening and Quality
342
Attributes. Annu. Rev. Genet.2011, 45, 41–59, doi:10.1146/annurev-genet-110410-132507.
343
28. Shen, J.; Tieman, D.; Jones, J. B.; Taylor, M. G.; Schmelz, E.; Huffaker, A.; Bies, D.; Chen, K.;
344
Klee, H. J. A 13-lipoxygenase, TomloxC, is essential for synthesis of C5 flavour volatiles in
345
tomato. J. Exp. Bot.2014, 65, 419–428, doi:10.1093/jxb/ert382.
346
29. Ma, Y.; Hu, R.; Yu, C.; Qi, G.; Wang, S.; Bai, Z.; Liu, Q.; Wang, Y.; Zhou, G.; Zhao, X.
347
Integrated analysis of transcriptome and metabolites reveals an essential role of metabolic
348
flux in starch accumulation under nitrogen starvation in duckweed. Biotechnol. Biofuels2017,
349
10, 1–14, doi:10.1186/s13068-017-0851-8.
350
30. Hu, X.-G.; Liu, H.; Jin, Y.; Sun, Y.-Q.; Li, Y.; Zhao, W.; El-Kassaby, Y. A.; Wang, X.-R.; Mao,
351
J.-F. De Novo Transcriptome Assembly and Characterization for the Widespread and
Stress-352
Tolerant Conifer Platycladus orientalis. PLoS One 2016, 11, e0148985,
353
doi:10.1371/journal.pone.0148985.
354
31. Li, X.; Xing, X.; Tian, P.; Zhang, M.; Huo, Z.; Zhao, K.; Liu, C.; Duan, D.; He, W.; Yang, T.; Li,
355
X.; Xing, X.; Tian, P.; Zhang, M.; Huo, Z.; Zhao, K.; Liu, C.; Duan, D.; He, W.; Yang, T.
356
Comparative Transcriptome Profiling Reveals Defense-Related Genes against Meloidogyne
357
incognita Invasion in Tobacco. Molecules2018, 23, 2081, doi:10.3390/molecules23082081.
358
32. Cao, D.; Fan, J.; Xi, X.; Zong, Y.; Wang, D.; Zhang, H.; Liu, B.; Cao, D.; Fan, J.; Xi, X.; Zong,
359
Y.; Wang, D.; Zhang, H.; Liu, B. Transcriptome Analysis Identifies Key Genes Responsible
360
for Red Coleoptiles in Triticum Monococcum. Molecules 2019, 24, 932,
361
doi:10.3390/molecules24050932.
33. Gao, C.; Ju, Z.; Cao, D.; Zhai, B.; Qin, G.; Zhu, H.; Fu, D.; Luo, Y.; Zhu, B. MicroRNA
363
profiling analysis throughout tomato fruit development and ripening reveals potential
364
regulatory role of RIN on microRNAs accumulation. Plant Biotechnol. J. 2015, 13, 370–382,
365
doi:10.1111/pbi.12297.
366
34. Xi, X.; Zong, Y.; Li, S.; Cao, D.; Sun, X.; Liu, B. Transcriptome analysis clarified genes
367
involved in betalain biosynthesis in the fruit of red pitayas (hylocereus costaricensis).
368
Molecules2019, 24, 445, doi:10.3390/molecules24030445.
369
35. Giovannoni, J.; Nguyen, C.; Ampofo, B.; Zhong, S.; Fei, Z. The Epigenome and
370
Transcriptional Dynamics of Fruit Ripening. Annu. Rev. Plant Biol. 2017, 68, 61–84,
371
doi:10.1146/annurev-arplant-042916-040906.
372
36. Shinozaki, Y.; Nicolas, P.; Fernandez-Pozo, N.; Ma, Q.; Evanich, D. J.; Shi, Y.; Xu, Y.; Zheng,
373
Y.; Snyder, S. I.; Martin, L. B. B.; Ruiz-May, E.; Thannhauser, T. W.; Chen, K.; Domozych, D.
374
S.; Catalá, C.; Fei, Z.; Mueller, L. A.; Giovannoni, J. J.; Rose, J. K. C. High-resolution
375
spatiotemporal transcriptome mapping of tomato fruit development and ripening. Nat.
376
Commun.2018, 9, 364, doi:10.1038/s41467-017-02782-9.
377
37. Robinson, M. D.; McCarthy, D. J.; Smyth, G. K. edgeR: A Bioconductor package for
378
differential expression analysis of digital gene expression data. Bioinformatics2009, 26, 139–
379
140, doi:10.1093/bioinformatics/btp616.
380
38. McCarthy, D. J.; Chen, Y.; Smyth, G. K. Differential expression analysis of multifactor
RNA-381
Seq experiments with respect to biological variation. Nucleic Acids Res.2012, 40, 4288–4297,
382
doi:10.1093/nar/gks042.
383
39. Hogewoning, S. W.; Trouwborst, G.; Maljaars, H.; Poorter, H.; Leperen, W.; Harbinson, J.
384
Blue light dose-responses of leaf photosynthesis, morphology, and chemical composition of
385
Cucumis sativus grown under different combinations of red and blue light. J. Exp. Bot.2010,
386
61, 3107–3117, doi:10.1093/jxb/erq132.
387
40. Sanchez, A.; Shin, J.; Davis, S. J. Abiotic stress and the plant circadian clock. Plant Signal.
388
Behav.2011, 6, 223–231, doi:10.4161/psb.6.2.14893.
389
41. Zheng, Y.; Song, S.; Lei, B.; Li, Y.; Liu, H.; Zhang, Y.; Hao, Y. Effect of supplemental blue
390
light intensity on the growth and quality of Chinese kale. Hortic. Environ. Biotechnol.2018, 60,
391
49–57, doi:10.1007/s13580-018-0104-1.
392
42. Deng, B.; Shang, X.; Fang, S.; Li, Q.; Fu, X.; Su, J. Integrated effects of light intensity and
393
fertilization on growth and flavonoid accumulation in Cyclocarya Paliurus. J. Agric. Food
394
Chem.2012, 60, 6286–6292, doi:10.1021/jf301525s.
395
43. Zervoudakis, G.; Salahas, G.; Kaspiris, G.; Konstantopoulou, E. Influence of light intensity
396
on growth and physiological characteristics of common sage (Salvia officinalis L.). Brazilian
397
Arch. Biol. Technol.2012, 55, 89–95, doi:10.1590/S1516-89132012000100011.
398
44. Bos, H. J.; Tijani-Eniola, H.; Struik, P. C. Morphological analysis of leaf growth of maize:
399
Responses to temperature and light intensity. NJAS - Wageningen J. Life Sci.2000, 48, 181–198,
400
doi:10.1016/S1573-5214(00)80013-5.
45. Olle, M.; Virrsile, A. The effects of light-emitting diode lighting on greenhouse plant growth
402
and quality. Agric. Food Sci.2013, 22, 223–234, doi:10.23986/afsci.7897.
403
46. Kwack, Y.; Kim, K. K.; Hwang, H.; Chun, C. Growth and quality of sprouts of six vegetables
404
cultivated under different light intensity and quality. Hortic. Environ. Biotechnol. 2015, 56,
405
437–443, doi:10.1007/s13580-015-1044-7.
406
47. Gallego, M.; Virshup, D. M. Post-translational modifications regulate the ticking of the
407
circadian clock. Nat. Rev. Mol. Cell Biol.2007, 8, 139–148, doi:10.1038/nrm2106.
408
48. Haydon, M. J.; Mielczarek, O.; Robertson, F. C.; Hubbard, K. E.; Webb, A. A. R.
409
Photosynthetic entrainment of the Arabidopsis thaliana circadian clock. Nature 2013, 502,
410
689–692, doi:10.1038/nature12603.
411
49. Langmead, B.; Salzberg, S. L. Fast gapped-read alignment with Bowtie 2. Nat. Methods2012,
412
9, 357–9, doi:10.1038/nmeth.1923.
413
50. Kim, D.; Pertea, G.; Trapnell, C.; Pimentel, H.; Kelley, R.; Salzberg, S. L. TopHat2: accurate
414
alignment of transcriptomes in the presence of insertions, deletions and gene fusions.
415
Genome Biol.2013, 14, R36, doi:10.1186/gb-2013-14-4-r36.
416
51. Trapnell, C.; Roberts, A.; Goff, L.; Pertea, G.; Kim, D.; Kelley, D. R.; Pimentel, H.; Salzberg, S.
417
L.; Rinn, J. L.; Pachter, L. Differential gene and transcript expression analysis of RNA-seq
418
experiments with TopHat and Cufflinks. Nat. Protoc. 2012, 7, 562–578,
419
doi:10.1038/nprot.2012.016.
420
52. Li, B.; Dewey, C. N. RSEM: accurate transcript quantification from RNA-Seq data with or
421
without a reference genome. BMC Bioinformatics2011, 12, 323, doi:10.1186/1471-2105-12-323.
422
53. Van der Auwera, G. A.; Carneiro, M. O.; Hartl, C.; Poplin, R.; Del Angel, G.;
Levy-423
Moonshine, A.; Jordan, T.; Shakir, K.; Roazen, D.; Thibault, J.; Banks, E.; Garimella, K. V;
424
Altshuler, D.; Gabriel, S.; DePristo, M. A. From FastQ data to high confidence variant calls:
425
the Genome Analysis Toolkit best practices pipeline. Curr. Protoc. Bioinforma. 2013, 43,
426
11.10.1-33, doi:10.1002/0471250953.bi1110s43.
427
54. Wang, K.; Li, M.; Hakonarson, H. ANNOVAR: Functional annotation of genetic variants
428
from high-throughput sequencing data. Nucleic Acids Res. 2010, 38, e164,
429
doi:10.1093/nar/gkq603.
430
55. Kanehisa, M.; Araki, M.; Goto, S.; Hattori, M.; Hirakawa, M.; Itoh, M.; Katayama, T.;
431
Kawashima, S.; Okuda, S.; Tokimatsu, T.; Yamanishi, Y. KEGG for linking genomes to life
432
and the environment. Nucleic Acids Res.2008, 36, D480-4, doi:10.1093/nar/gkm882.
433
434
Sample Availability: Samples of the compounds and materials are available from the corresponding author