Article
Towards a 3D Data Model of Underground Utilities
for Land Administration
Jingya YAN1,†* https://orcid.org/0000-0001-8321-1329, Siow Wei JAW1,2,3, Kean Huat SOON4, Andreas WIESER5and Gerhard SCHROTTER6
1 ETH Zurich, Future Cities Laboratory, Singapore-ETH Centre; [email protected]
2 Geoscience & Digital Eaeth Centre (INSTeG), Research Institute for Sustainable Environment,
Universiti Teknologi Malaysia, Malaysia; [email protected]
3 Department of Geoinformation, Faculty of Built Environment and Surveying, Universiti Teknologi Malaysia,
Malaysia
4 Singapore Land Authority, Singapore – [email protected]
5 ETH Zurich, Institute of Geodesy and Photogrammetry – [email protected]
6 Geomatik + Vermessung Stadt Zurich, Zurich, Switzerland – [email protected]
1
2
3
4
5
6
7
8
9
10
11
12
13
14
15
16
* Correspondence: [email protected]
Abstract: Cities around the world face an increasing need for land as density in urban areas increases
rapidly. The pressure to expand a city’s space is especially acute for a city-state like Singapore. In
the big data era, a data-driven approach of underground spaces is necessary for the sustainable
development of a city along with rapid urbanization. A reliable three dimensional (3D) digital map of utility networks is crucial for urban planners to understand one of the most impactful aspects of
underground space planning. How to map reliable 3D underground utility networks and use it in
the land administration? This is a challenging issue, especially for cities with limited land resources,
congested underground spaces, and a lack of uniform existing practices. First, this paper proposes a
framework for utility data governance from the underground utility data survey to data usage. This
is the backbone to support coordination of different roles in the utility data management and usage. Then, an initial design of the 3D utility cadastral data model is introduced, which aims to support the
3D modelling of utility networks and connect it to the cadastral parcel. It is expected that reliable
and accurate information on underground utility networks can lead to a better understanding and management of underground space, which eventually contributes to better city planning, making the unseen structures visible.
Keywords: 3D Data Model, Underground Utility Networks, Underground Space Planning, Underground Mapping, Utility Cadastre, Land Administration
17
1. Introduction 18
Rapid urbanization creates a strong need to optimize land use in densely populated cities.
19
Attention is thus shifting from the very limited available space above ground to generation and
20
increased use of underground spaces. A prerequisite for including the underground in urban planning
21
is the availability of sufficiently complete, accurate and up-to-date 3D maps of the underground.
22
However, such maps are not yet widely available, if at all, and the required data acquisition is much
23
more challenging than for spaces above ground. Some countries and institutions have implemented
24
or at least conceptualized the 3D mapping of underground utility network and their management in
25
a related cadastral system. For instance, the Canton of Zurich started to establish a comprehensive
26
Canton-wide utility cadastre map based on the Cantonal Act on Geoinformation of 20111, derived
27
from the Federal Act on Geoinformation of 20072and the Cantonal Regulation on Utility Cadastre of
28
20123). The municipalities of the Canton of Zurich have time till 2021 to implement the requirements.
29
The City of Zurich has an own utility cadaster since 1999 and has set up a governance framework
30
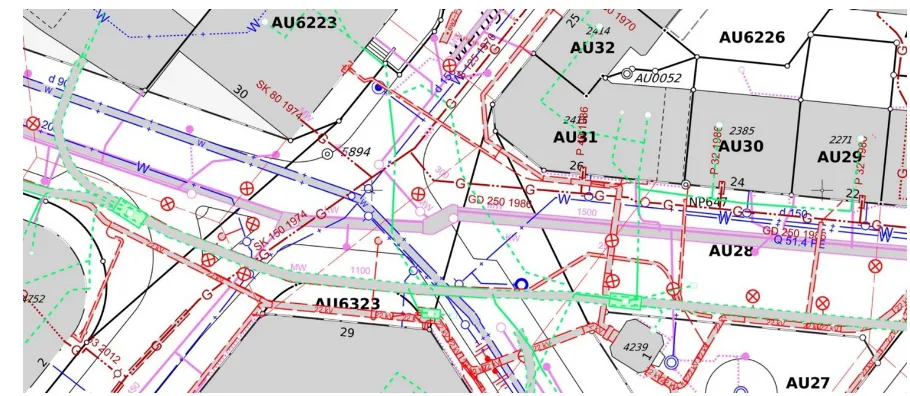
with the corresponding utility providers4. Figure1shows an example of utility map of City of
31
Zurich. Additionally, the United States of America, the United Kingdom, Malaysia, and Canada have
32
developed 3D maps of underground utility networks [1,2].
33
Figure 1.Utility map of City of Zurich5(Source: Geomatik + Vermessung Stadt Zurich).
With a population of more than five million living in an area of 720 square kilometres, Singapore
34
has revealed a plan for placing infrastructure underground. To establish a map of the Singapore
35
underground including utility services, government agencies (e.g. utility owners, land developers,
36
and land owners) have already started sharing their data using Singapore Land Authority (SLA)’s
37
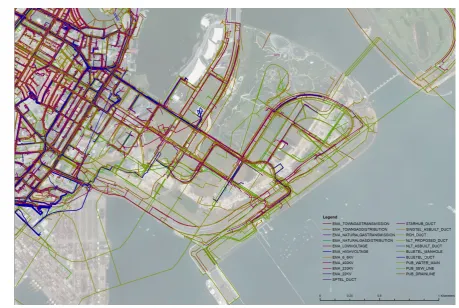
GeoSpace platform. Figure2shows an example in Marina Bay region of Singapore. All the existing
38
data are 2D. Obviously, all of them overlay each other make the chaotic visualization. In order to
39
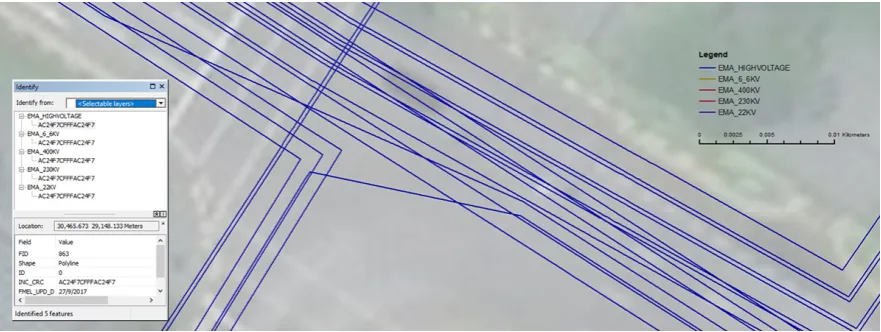
observe the existing data, we zoom in to a corner of Marina Bay region. Figure3apresents five layers
40
of different power grid networks. But the geospatial information of different layers are totally the
41
same. These data are unreliable and so difficult to be visualized in 2D. From figure3b, the limited
42
attributes are provided from current database. Only the main water pipes have diameter. Most of
43
them have 2D geospatial information. In addition, data owners have more details of existing utility
44
data. But most of them are 2D data as well. Depending on the requirement of application, some data
45
owners try to collect 3D data. There are some issues during the data capture to usage. Without the
46
utility survey standard, some of them only use traditional survey method to get the 3D points data of
47
piplines and overlay on the existing data. Nobody can guaranty the quality of these data. Meanwhile,
48
because of limitation of existing data model, 3D data have trouble to integrate with the existing 2D
49
data. The update is once per six months. In general, a number of issues prevent these data from
50
being sufficient for urban planning, land administration, and on-site work. In fact, many existing
51
1 http://www2.zhlex.zh.ch/appl/zhlex_r.nsf/0/84FC05FF03048541C12581DE00372667/$file/704.1_24.10.11_99.pdf 2 www.admin.ch/opc/en/classified-compilation/20050726/index.html
3 http://www2.zhlex.zh.ch/appl/zhlex_r.nsf/0/2177E9F8B5B576A1C1257A99002C2307/$file/704.14_27.6.12_78.pdf 4 www.stadt-zuerich.ch/ted/de/index/geoz/geodaten_u_plaene/leitungskataster.html
5 www.stadt-zuerich.ch/content/dam/stzh/ted/Deutsch/geoz/Geodaten_und_Plaene/Formulare_und_
databases, not only the ones in Singapore, contribute incompletely to the spatial understanding of the
52
underground because of similar restrictions. In particular:
53
Figure 2.An example of utility data in Singapore (Source: Singapore Land Authority, 2018).
• The data are often only 2D i.e., lacking depth information entirely, or 2.5D (i.e. featuring depth
54
as an attribute to horizontal position rather than as an independent coordinate. Furthermore, the
55
depth information may be sparse with depths measured at few locations only, e.g. at accessible
56
manholes, and it may be ambiguous because it is not always clear whether the values represent
57
depth relative to a specific surface with unknown elevation or height relative to an established
58
height datum.
59
• It is unknown whether the data represents the current situation, the possibly different as-built
60
state, or just the as-designed state. Furthermore, the geometric accuracy and the completeness of
61
the are often unknown.
62
• Much of the attribute information (e.g. diameter, material, installation date) required to support
63
specific applications is not available or not represented the appropriate level of detail.
64
• There is a lacks of standards for organizing the data and semantic information of underground
65
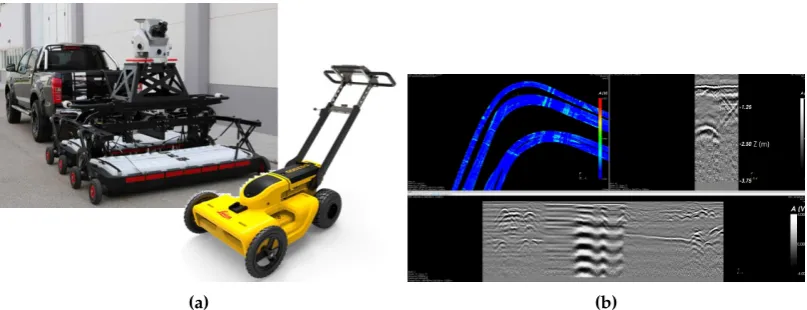
utilities, impairing data sharing and use of the shared data.
66
Overall, the reliable and accurate 3D data of utility networks is sorely demanded. Therefore, the
67
Singapore-ETH Centre together with the SLA and the Geomatics Department of the City of Zurich
68
have started a related project under the name “Digital Underground”. The initial goals of this project
69
are to develop a road map, a data model and a concept for deriving a unified and complete 3D map
70
of the relevant underground structures (in particular of utilities and spaces like corridors or tunnels).
71
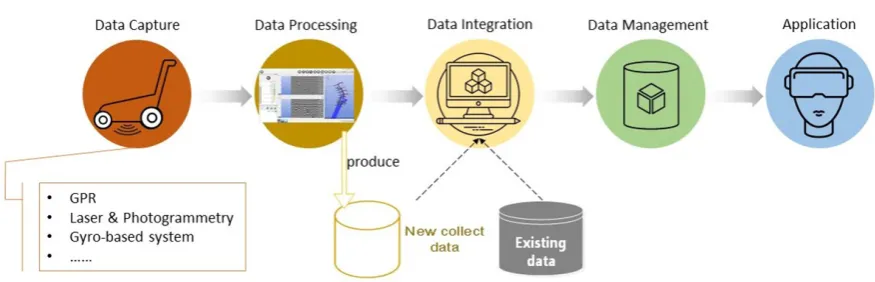
Collecting best practices for underground utility mapping is a special focus within the project. Figure
72
4describes the work process of 3D underground utility mapping. In the data capture, different
73
types of survey techniques are explored and compared in order to find the optimal underground
74
utility survey approach. After the data processing, the new collected data should be integrated to
(a)An example of power grid data
(b)The attributes of existing utility data
Figure 3.The issues of existing utility data (Source: Singapore Land Authority, 2018).
the existing database aiming to improve the information of underground utility. As the backbone
76
of 3D underground utility map, the 3D consolidated database of underground utilities should be
77
developed for data management. Additionally, a 3D map of utility networks could shed light on
78
the management of utility networks such as their ownership and operation in order to ensure legal
79
compliance, efficiency, and resilience of these utility networks. Then, the underground utility data
80
can be used in various applications. However, securing reliable data for a consolidated database with
81
sufficient and consistently accurate information is a challenging task. A gap exists between engineering
82
practices and mapping disciplines for underground utilities. Meanwhile, we need to find the solution
83
of how to use the existing data and integrate it with new collected data.
84
Here we focus on underground utilities, ignoring other underground structures which eventually
85
need to be represented in the same 3D data base as the utilities. We propose an approach to data
86
governance for underground utility data and a 3D underground utility data model, which aims at
87
bridging the gap between underground utility surveying and data management for land administration.
88
Our proposal addresses the following:
89
• The organization of different roles for the sharing of data. It is necessary to make clear the
90
governance of different roles. During data sharing, the communication between different roles
91
(e.g. data producers, regulatory bodies and users) is very important.
92
• Different roles require different permissions to access, change, delete or add data. These
93
permissions must be defined and maintained administratively.
Figure 4.Workflow of underground utility mapping.
• Building and updating the 3D map of the underground requires integration of datasets of
95
different type, quality and source. Data may originate from recent surveying e.g., using Ground
96
Penetrating Radar (GPR) or self-contained sensors tracking their own movement through a pipe.
97
Data for building a map may also be derived from other databases. This integration requires
98
handling various data formats, and quantifying and properly taking into account the respective
99
data quality.
100
• The underground data need to be convertible into the data formats required by a variety of
101
different applications and end users without loss of relevant information.
102
Subsequently, we first introduce related works on 3D underground utility data acquisition and
103
reviews existing data models for utility networks. In section 3 we propose a framework to resolve the
104
above issues about data governance and explain the design of a 3D underground utility data model.
105
In section 4 we briefly summarize a Singapore case study covering the work process from large scale
106
GPR-based data acquisition to 3D visualization. We conclude with a summary and an outlook on
107
future work.
108
2. Related Works 109
2.1. The technologies for 3D underground utility data acquisition
110
The information of the buried utility networks can be retrieve without any physical contact
111
through underground utility mapping. However, underground utility mapping is more challenging as
112
compare to above ground mapping as most of the utility networks are invisible to the naked eyes. In
113
this context, underground utility mapping is adopted to scan, detect, mark and locate utility networks,
114
in collaboration with different subsurface geophysical technologies [3,4]. These subsurface geophysical
115
technologies are considered as the trenchless technologies, where the inspection can be done without
116
proving excavation [5,6]. These subsurface geophysical technologies, such as Ground Penetrating
117
Radar, Electromagnetic Locator, are recommended for capturing the information of the buried utility
118
networks [4,7]. However, optical (e.g. using photogrammetry, or laser scanning) and physical (e.g. total
119
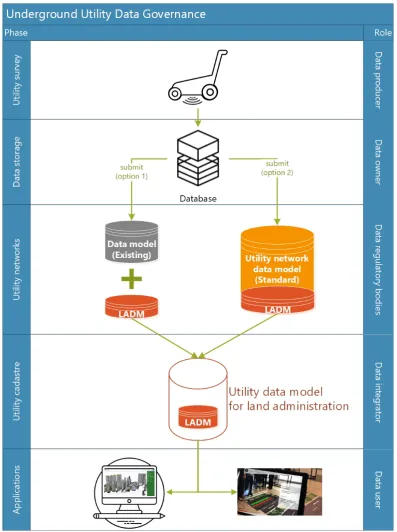
station or global positioning system) measurement are recommended for capturing the information of
120
the utility network while it is still expose through the trenching pits as shown in Table1.
121
As the numbers of utility networks increases, the urban underground is now a spider web of
122
utility networks. The adoption of the above-mentioned technologies at such congested cities has
123
become limited. It is hard to measure the exact location of the utility network. A gyroscope-based
124
system [8] was developed to measure the trajectory of the newly laid pipeline in offline mode. In
125
this paper, our data capturing was using GPR due to its popularity in underground utility mapping
126
[4] and the gyroscope-based system as it is not limit by depth measurement or susceptible to any
127
electromagnetic disturbances [8].
Table 1.Data capture methods for underground utility services.
Method Use case Typical (primary) data
Conventional surveying Open pit Sparse point trajectory Laser scanning & photogrammetry Open pit Dense point cloud
GPR Buried utilities Radargram
IMU-based system Buried, newly built Dense point trajectory
Marker tagging Buried Sparse set of points
2.1.1. Ground Penetrating Radar (GPR)
129
GPR is a widely used technology for characterizing structures in the underground. It is based on
130
recording the delay and power of electromagnetic (EM) signals scattered and reflected at discontinuities
131
of the permittivity. Such discontinuities are associated with differences in materials or differences in
132
material properties allowing to detect e.g. man-made objects, holes, and layers of different composition
133
or water content in the underground [9,10]. GPR is used for a variety of applications, among them
134
geophysical exploration, archeology, and the buried utility networks [11,12]. Depending on the type of
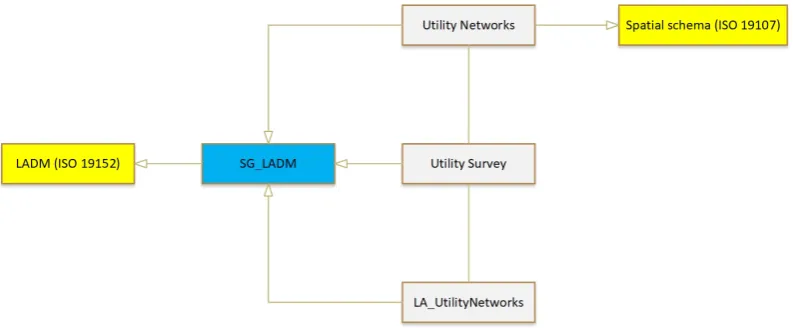
135
transmitted signals, Impulse radar systems and Continuous wave radar systems are distinguished,
136
with the former being more common [13]. The penetration depth, i.e., the maximum depth at which
137
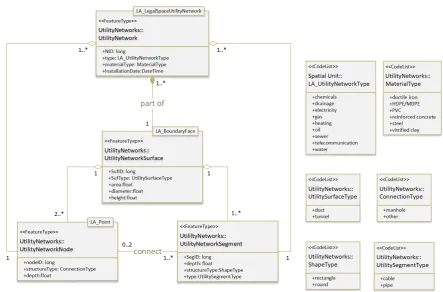
discontinuities can be detected using GPR is on the order of a few meters to a few tens of meters,
138
depending on the soil characteristics, transmission power, signal stacking time and the frequency
139
which typically range from 10 MHz to 4 GHZ. Lower frequencies require bigger antennas but facilitate
140
higher penetration depths. Higher frequencies on the other hand yield better spatial resolution and
141
thus allow correctly locating smaller objects or distinguishing objects at smaller distances [11]. 3D
142
information is obtained by moving the radar antennas along the ground surface, recording data
143
quasi-continuously, and subsequently analyzing the data tomographically. Figure5a shows two
144
examples of GPR instruments, one being integrated with a mobile mapping trailer, and the other one a
145
manually pushed cart.
146
As opposed to optical techniques used for mapping above ground, the (relatively) low-frequency
147
GPR signals cannot be bundled well, and the radar images (radargrams) obtained from the
148
measurements, see (Figure5b) for an example, are thus typically difficult to interpret. So far, both the
149
data capturing processes (selection of frequencies and data recording parameters) and the extraction
150
of 3D information of underground utilities from the raw data require an operator with significant
151
expertise . Along with unavoidably physical limitations the factors impede the application operation
152
of the GPR as a sole means for mapping the underground.
153
(a) (b)
2.1.2. Gyroscope-based systems
154
Utilities with a diameter of more than about 5 cm through which a probe can travel may
155
be accessible to mapping with an inertial measurement unit (IMU). Such a unit measures 3-axis
156
acceleration and 3-axis rotation rates which can be integrated over time yielding position and
157
orientation changes of the unit. If the unit is mounted within a probe and the probe travels through
158
the utility (typically a pipe), the trajectory of the probe – and thus the 3D coordinates of points along
159
the axis of the utility [8].
160
The potential benefits of such a measurement system are that (i) it can acquire the as-built
161
information of the suitable utilities even if they are buried at a depth exceeding the penetration
162
depth of GPR, (ii) the location can be geometrically more accurate than using above-ground
163
measuring technologies for location of underground structures, (iii) it can acquire data irrespective
164
of the properties of the surrounding underground (e.g. soil composition, water content) and of
165
electromagnetic fields, and (iv) that the probe can be equipped with additional sensors capturing
166
more information than just the coordinates (e.g. diameter, radius of curvature, corrosion). Major
167
disadvantages are that (i) only pipes with sufficient diameter, sufficient minimum radius or curvature
168
and accessibility can be measured, (ii) depending on the measurement system, the pipe needs to
169
be empty during the measurement i.e., the service of the utility is interrupted, (iii) the accuracy of
170
the 3D coordinates degrades rapidly with time such that only short parts of the utility, with known
171
coordinates of the start and end point can be measured if high accuracy is needed, and (iv) additional
172
provisions may be required, e.g. short periods through which the probe remains stationary while
173
moving fast at others. Figure6bshows an example of such a probe and a 3D map of utilities mapped
174
using it.
175
(a) (b)
Figure 6.An example of a Gyroscope-based pipeline measurement system (a) and the 3D map of the measured pipes (b).
It can be concluded that each technology has its advantages and limitations. The selection of
176
using the right instrument depends on its application. A comprehensive collection of utility network
177
mapping technologies may be required to acquire reliable 3D utility network data. The data that is
178
obtained by different instruments needs to be integrated with utility networks attributes before storing
179
in a geospatial database to support 3D visualization, utility data management, urban planning and
180
others application.
181
2.2. The review of data model for underground utility networks
182
A range of utility data models has been developed for storage, visualization, exchange, analysis in
183
the geospatial domain. Obviously, the general data model is not enough to reach all the requirements
184
from different users. In order to develop the 3D data model for the land administration of underground
185
utilities, this work reviews the existing data models that are related to underground utility networks
186
and land administration.
187
2.2.1. 3D data model for underground utility networks
188
The CityGML utility network ADE [14] focuses mainly on the representation of topographical,
189
graph structural and functional information across the multi-utility networks in 3D space [14,15]. This
data model not only represents a utility network component by its 3D topography and complementary
191
graph structure [14], but also considers interdependencies between utility network features and city
192
objects [16]. Because this data model is an extension of GityGML [17], which is the popular standard
193
for 3D city modelling (e.g. building), is beneficial to integrate information of utility network to the
194
infrastructures to support urban planning and the other city studies. However, it does not consider
195
the accuracy of the data. Some works begin to extend the existing data model to consider much more
196
details about utility networks, such asScholtenhuiset al.represent geographical uncertainties of utility
197
locations based on CityGML Utility Network ADE. The Industry Foundation Classes (IFC) utility
198
model [19], which is an ISO standard for data exchange, pays more attention to the supply service of
199
buildings in the civil engineering and architecture domain. It describes 2D and 3D geometry of utilities
200
within the building and the logical or physical connection between building service components.
201
However, the IFC utility model lacks spatial information. The INSPIRE Utility Networks [20] organize
202
the basic information of utility network and administrative service of utility networks in a city or
203
country range. It is a part of INSPIRE, which is a standard of European Union to describe the
204
spatial information of infrastructures. However, the INSPIRE Utility networks lacks of definition
205
of 3D geometric information of utility networks. ESRI developed the ArcGIS utility model [21] that
206
provides a GIS-based utility solution to represent the underlying logical and physical relations of
207
utility networks. The ArcGIS utility model is a general utility data model to represent the 2D geometric
208
information and connections of the utility networks.
209
Until now, there is not a widely accepted international standard for an underground utility
210
data model [22]. Even though the standardized data models, such as CityGML and IFC have been
211
developed to integrate multi-layer utility network data, these data models do not guarantee the
212
information to be reliable, and there is currently no integration with above-ground urban features.
213
Moreover, in order to provide utility data for 3D visualization and other applications, it is necessary to
214
integrate different types of utility datasets from multiple surveying methods. Table2compares four
215
popular utility data model relevant to the objectives of this work. Obviously, most of the existing utility
216
data models are to focus on the 3D representation, include 3D geometric and topological information.
217
The existing data models provide a good reference to describe the geometric and spatial information
218
of utility networks in 3D. Nevertheless, none of them consider the accuracy of data of underground
219
utility networks. Industry service providers are often not aware of these extensive standards that
220
should ideally guide mapping procedures and accuracy requirements for underground utility network
221
mapping. The surveying method is related to data accuracy and data management directly. Hence,
222
we need a 3D utility data model to fill the gap between underground survey and land administration
223
applications.
224
Table 2.Comparison of model characteristics.
CityGML Utility Network ADE ArcGIS Utility Networks INSPIRE Utility Networks IFC
3D representation modelling
-3D geometries + - - ++
-Topological aspects ++ ++ ++ ++
-Hierarchical modelling ++ . ++ +
Land Administration - - -
-Data quality management - - -
--: no support, .: basic support, +: sophisticated support, ++: comprehensive support.
2.2.2. Underground utility in land administration
225
The rapid urbanization and increasing complexity of urban spaces worldwide presents an
226
urgent need to provide much more and precise information for land usage. Obviously, 2D cadastral
227
information and visualization are not enough for current land administration. During the past decade,
228
a number of works research on the 3D cadastre from various aspects, such as legal, organization
and technique [1,23,24]. The Land Administration Domain Model (LADM) [25] is an important
230
legal framework to define and integrate concepts and terminology of Land Administration for 3D
231
representations. As an international standard, the LADM provides a flexible conceptual schema from
232
three main aspects: organizations, rights and spatial in formations [24]. The integration of 2D and 3D
233
information in the LADM can provide solutions for 3D cadastre. However, the LADM still lacks of
234
information about underground utility services.
235
In recent years, some researchers or government agencies begin to consider the cadstre for
236
underground infrastructures. Pouliot and Girardprovided a discussion about the integration of
237
underground utility networks in the land administration system. Based on the case study of Quebec,
238
they discussed three key questions in the following:
239
• Do we need to register underground objects?
240
• Should underground networks be registered in the Land Register, with the same specifications
241
as land parcels?
242
• Which information should be part of the registration process?
243
On the basis of their discussion and the situation of Singapore, it is necessary to register the utility
244
segments as the legal objects in the land administration system, which helps to identify the ownership
245
of underground utility. Moreover, land parcel, as an important role in the land administration, should
246
be connected to the underground utility [1,26].
247
3. Design of the 3D Data model for Underground Utility Networks 248
3.1. A Framework for Utility Data Governance
249
From data capture to usage, the whole work process includes several participants in different
250
stages. Hence, this work proposes a framework for underground utility data governance at a top level
251
(Figure7), which aims to resolve issues about communication between different organizations, data
252
integration, and data sharing during 3D mapping of underground utility networks. This framework
253
consists of five roles that are listed in the following:
254
• A data producer, who can be a contractor and/or part of the data regulatory bodies’ organization,
255
will submit data to the utility network database after utility survey.
256
• Data owner manages their collected data. This role could be companies or data regulatory bodies.
257
• Data regulatory bodies, which are government agencies, will collect data and manage them
258
based on their utility network data model. The data regulatory bodies should provide a clear
259
permission to use and predefined subset of utility data, which will be used by data integrator.
260
• The data integrator integrates all utility data and manages the utility cadastre of all the utility
261
networks in a city or country. The data integrator should provide the required information for
262
the application of utility cadastre management to users. This role is vital in this framework,
263
connecting the data regulatory bodies and users.
264
• Data users can use utility data for utility cadastre management applications.
265
In this work process, the surveyor as data producer to capture data during the field work. After that,
266
the data will be submitted to data owner (e.g. Public Utilities Board (PUB) of Singapore) who needs
267
to manage the data of their own utility networks. According to the requirements of government,
268
the utility data will be submitted to data regulatory bodies (e.g. PUB and SLA), which include two
269
options. If the data regulatory body has the utility data model, they can continue to use it. Otherwise,
270
a general utility network data model will be designed as a standard to manage underground utility
271
data for data regulatory bodies. A consolidated 3D utility data model will be designed to support
272
utility cadastre management. The data integrator (e.g. SLA) needs to integrate data of different kinds
273
of utility networks. The LADM plays as a connection component to build relationship between the
274
general utility network data model and utility cadastre data model in the utility cadastre management.
Meanwhile, the LADM will connect underground utility network to the land administration of above
276
ground. At last, the utility cadastre data model should support applications in the land administrative
277
management.
Figure 7.The framework of underground utility network data governance.
278
3.2. 3D Utility Cadastre Data Model
279
Current work focuses on the design of 3D utility cadastre data model. In order to understand
280
the demands of underground utility data users, a workshop was organized to learn the work process
281
and needs of land administration in Singapore. This studying includes four application domains,
land acquisition and purchase, planning and coordination, land transfer and sale, and land leasing.
283
Currently, the existing data sources are hardcopy of utility network, 2D CAD and 2D geospatial
284
information. There is an urgent demand of 3D geospatial information of underground utility and space
285
to evaluate underground environment and support reallocation, land sales and the other applications.
286
Therefore, the 3D utility cadastre data model includes three packages to organize the basic information
287
and structure of utility networks, utility survey information, and the land administration information
288
(Figure8). In order to connect 3D utility cadastre data model to the information of land administration,
289
these three packages inherit from Singapore cadastral data model and LADM (ISO 19152). Meanwhile,
290
the geometric and spatial definition are inherited from Spatial schema data model ([27]).
Figure 8.The overview of packages of 3D utility cadastre data model.
291
TheUtility Networkspackage describes the basic information of utility networks, includes
292
geometric, spatial and physical information. Based on the partonomy (part–whole) relationships,
293
this work defines the hierarchy of utility networks in three levels (Figure9). The macro-level is the
294
whole utility networks, which is described byUtilityNetworkclass with the basic information of utility
295
networks, such as the type, material of utility networks. The meso-level is the surface of the utility
296
networks, which is the part of the utility networks. The surface could be the tunnel, duck, manhole
297
and the other types of space in the utility networks. Hence, the aims ofUtilityNetworkSurfaceclass are
298
to describe the types and 3D geometric information (e.g. diameter) of surface. The micro-level is the
299
basic elements of utility networks, includes nodes and segments of utilities. The node is a connection
300
point in the network, which is defined byUtilityNetworkNodeclass. The segment is the line segment of
301
the utility, which is defined byUtilityNetworkSegmentclass. The relationship between micro and meso
302
level helps to transform 2D to 3D data as well. Figure10shows the relationships of different classes in
303
theUtility Networkpackage and basic attributes of each class. The values of utility networks type
304
inherit from LA_LegalSpaceUtilityNetwork in the LADM (ISO 19152) [25].
305
TheLA_UtilityNetworksclass (Figure11) aims to describe the land administration information
306
of utilities. On one side, it connects to the utility network surface in order to identify the land
307
administration information of different parts of utility networks. On the other side, it connects to the
308
cadastral parcel from Singapore cadastral data model and LADM ([25]). The spatial relationship is
309
used to describe the relationship of cadastral parcels and utilities, includes contain, cross and touch.
310
This class could support ownership management of utilities and the land administration management.
311
TheUtility Surveyclass (Figure12) aims to organize utility survey information. It could help to
312
manage survey status and accuracy of data. TheUtility Surveyclass inherits attributes of the survey
313
from Singapore cadastral data model. Furthermore, the ground conditions and survey methods are
314
related to accuracy of data directly. Hence, theUtility Surveyclass integrates information from Standard
315
and Specification for Utility Survey in Singapore ([28]). TheEvaluateattribute describes the method to
316
check the accuracy of surveying data. If the accuracy of data is unknown, the value ofEvaluateis null.
Figure 9.Multilevel structure of utility network.
Figure 11.The classes of land administration.
In future work, the accuracy level should be defined to be based on the depth level, soil condition and
318
survey method.
319
Figure 12.The classes of utility survey.
4. Case study 320
This initial study aims to integrate of GPR data and the existing underground utility data and
321
land cadastral data in the form of geospatial database. It aims to find a reasonable work process to
322
bridge the gap between data capture and application. Moreover, this implementation can help to
323
improve the design of 3D data model for underground utility.
324
4.1. Study area and datasets
325
This initial study was conducted at around Lorong 2, 3 and 4 at Toa Payoh, which is located in
326
the northern part of Singapore. This is one of pilot study sites in our project to deploy mobile GPR
327
platform, Pegasus: Stream for 3D mapping of above and underground. The scan site is a 1.8 km long
328
bi-directional 4-lane asphalt road in an inland area of Singapore that has seen development since the
329
1960s. This study was conducted to investigate the feasibility of GPR for large scale underground utility
mapping for the purpose of improving the quality of existing utility map information. Pegasus:Stream
331
integrating photogrammetry, laser scanning and ground penetrating radar to capture above and
332
underground environment in one scan. The data were collected at a driving speed of about 15 km/h.
333
The data were then post-processed in order to obtain digital 3d models of both the environment above
334
ground environment and underground utilities in different format. After data processing, the GPR
335
data needs to export to CAD format or GIS format with x, y, z value as points and lines for 3D data
336
modelling and visualization. Figure13shows an example of GPR data in CAD (Figure13a) and GIS
337
(Figure13b) format.
338
(a)CAD (b)GIS
Figure 13.GPR data in CAD and GIS format.
The existing datasets from Geospace and cadastral data from Singapore Land Authority were
339
used as secondary data to obtain or improve the attributes of utilities that were extracted from the
340
radargram and to explore the relationship between the above land administration information and
341
underground utilities. These existing utility data are as-build data from utility services (e.g.: power,
342
water, gas, telecommunication and sewerage) and cadastral information in 2D form. Of these datasets,
343
it contains only a small portion of information that has diameter with updated time and type. It
344
possess challenges for land planning with such limited information.
345
4.2. 3D Visualisation
346
To develop the 3D utility data model for land administration, the underground utilities need to be
347
connected to the land parcels. Figure14explains the work process in this case study. The data model is
348
designed in UML and exported to XML format, which can be imported into ArcGIS as a geodatabase
349
schema. Based the database schema, the GPR data can be loaded as utility network components in
350
polyline and point. According to the information from the existing utility data and GPR data, the
351
utilities can be modelled in 3D (multipatch). The 3D modelling is realized manually in the ArcSence
352
and CityEngine.
353
In order to get the related land administration information, the utility networks data can be
354
integrated with cadastral parcel through their spatial relationships. Because the existing cadastral data
355
is in 2D, the current work only considers the pipe line within the cadastral parcel in 2D. In order to
356
improve the accuracy of data in 3D, the current cadastral data has to be extended to 3D so as to support
357
more spatial relationships (e.g. cross and touch). Figure15shows an example of 3D visualization of
358
utilities with objects above ground. As shown in the figure, the selected pipe line is highlighted in
359
pink. The information shown in the pop window includes spatial data from GPR and other attributes
360
about underground utility survey and land cadastral information above ground.
Figure 14.Implementation process.
Figure 15.A result example of 3D visualization with land administration information.
4.3. Discussion
362
This is a simple implementation to explore the work process of 3D modelling of underground
363
utility from the GPR data and existing 2D data. Because GPR cannot capture the diameters, material
364
and some attributes of utilities, it is necessary to extract these information from GeoSpace database
365
for 3D modelling. Depending on the spatial relationship (e.g. overlap, within) of the GPR data and
366
existing utility data, some of the utilities from GPR data can be connect to the existing utility data.
367
Because of two main limitations, there is a big challenge to improve the accuracy of data. First, the
368
existing utility data is as-build data which may not be reliable enough for updating work. Second,
369
the existing utility data is in 2D data, which is difficult to identify utilities accurately. Hence, the
370
future work needs to find the solution to detect much more attributes of utilities from GPR data. In
addition, the tentative integration of underground utility and land cadastral data helps to improve the
372
development of data model for land administration.
373
5. Conclusions 374
This work proposes to develop a consolidated 3D data model of underground utilities for land
375
administration. The work includes two parts. On one hand, a framework for data governance is
376
designed to organize the workflow of utility data survey, management and application. This framework
377
is made up of four roles and two kinds of the data model. Through the understanding of current
378
workflow in the utility data usage, this work needs to clearly define different roles, including their
379
operations and rights for 3D underground utility mapping. On the other hand, a 3D data model of
380
underground utilities is designed with 3D spatial information, i.e. utility survey information, and land
381
administration information of underground utilities. In order to fill the gap between data capture and
382
usage, this data model has the following main tasks:
383
• Integrating utility networks data of varying formats, which were acquired using a variety of
384
non-destructive surveying technologies. This data model is a first step towards bridging the gap
385
between data acquisition and data management for underground utility mapping.
386
• Integrating the existing data and GPR data. As mentioned earlier, GPR data cannot get the
387
diameters and types of utilities. This way helps to improve the attributes of utilities from GPR
388
data. Moreover, it is also a process to transform utility data from 2D to 3D.
389
• A crucial part of the utility network data model is to connect the utility network data model with
390
the Land Administrative Domain Model for 3D cadastral management of underground space in
391
Singapore. It is useful to support ownership management applications and build the relationship
392
of utilities and land parcels. Such a reliable and complete centralized repository of underground
393
utility data will provide a crucial basis for planning and administering underground spaces.
394
A case study is implemented based on the GPR data from the large scale mobile underground
395
utility mapping. The initial implementation transform GPR data from CAD to GIS format and
396
3D visualization of utilities based on 3D utility data model. In order to get land administration
397
information, the utility networks have been connecting to cadastral parcel. The accuracy and details of
398
utility networks need to be improved in future work, such as the spatial relationship between utilities
399
and cadastral parcels. To fully support underground space planning, the cadastral data model should
400
eventually be extended to include other underground features in the future, such as underground
401
substations, pedestrian links, common services tunnels, road and rail networks, etc.
402
This is a work in progress and is in its initial stages. Two main aspects of limitations need to
403
be improved in future work. First, for the accuracy of utilities data. Obviously, the GPR data is not
404
enough to provide the comprehensive 3D underground utility networks. The other kinds of data
405
(e.g. Gyroscope) should be integrated to provide more precise attributes for underground utilities.
406
Moreover, the details of shapes and structures of utilities need to be improved. Second, the next step of
407
data model development will improve the definition of land administration for underground utilities.
408
A pilot study will be conducted to implement the entire process from data capture to data integration
409
and application, working with a selection of agencies and the preferred data integrator. It aims to
410
evaluate and improve the framework. After that, recommendations from this study can be used for
411
the implementation of the platform in Singapore with government agencies. Also, this work will not
412
limit itself to underground utilities. In future work, it will be extended to include other underground
413
structures such as underground indoor spaces, and support urban planning applications.
414
Author Contributions:Conceptualization, Jingya YAN and Kean Huat SOON; methodology, Jingya YAN and 415
Kean Huat SOON; implementation, Jingya YAN; Data curation, Jingya YAN and Siow Wei JAW; writing—original 416
draft preparation, Jingya YAN; writing—review and editing, Siow Wei JAW, Kean Huat SOON, Gerhard 417
SCHROTTER and Andreas WIESER; visualization, Jingya YAN; supervision, Gerhard SCHROTTER and Andreas 418
Funding: UNDERGROUND-RELATED STUDIES AND PROJECTS FUND (USPF), Ministry of National 420
Development and is sponsored by Singapore Land Authority. 421
Acknowledgments:This publication has been realised as part of the project “Digital Underground: 3D Mapping 422
of Utility Networks” at the Future Cities Laboratory, established by ETH-Zurich and Singapore’s National 423
Research Foundation (NRF), and operating under the auspices of the Singapore-ETH Centre. 424
Conflicts of Interest:The authors declare no conflict of interest. 425
References 426
1. Pouliot, J.; Girard, P. 3D Cadastre: With or Without Subsurface Utility Network?; International Federation 427
of Surveyors (FIG): Athens, Greece, 2016. OCLC: 831214525. 428
2. Tan, L.C.; Looi, K.S. Towards a Malaysian multipurpose 3D cadastre based on the Land Administration 429
Domain Model (LADM)–an empirical study. Proceedings of the 5th FIG Land Administration Domain 430
Model Workshop, 2013, pp. 24–25. 431
3. Hao, T.; Rogers, C.; Metje, N.; Chapman, D.; Muggleton, J.; Foo, K.; Wang, P.; Pennock, S.; 432
Atkins, P.; Swingler, S.; Parker, J.; Costello, S.; Burrow, M.; Anspach, J.; Armitage, R.; Cohn, A.; 433
Goddard, K.; Lewin, P.; Orlando, G.; Redfern, M.; Royal, A.; Saul, A. Condition assessment of the 434
buried utility service infrastructure. Tunnelling and Underground Space Technology2012, 28, 331–344. 435
doi:10.1016/j.tust.2011.10.011. 436
4. Lai, W.W.L.; Dérobert, X.; Annan, P. A review of ground penetrating radar application in civil engineering: 437
a 30-year journey from locating and testing to imaging and diagnosis.NDT & E International2018,96, 58–78. 438
5. Ni, S.H.; Huang, Y.H.; Lo, K.F.; Lin, D.C. Buried pipe detection by ground penetrating 439
radar using the discrete wavelet transform. Computers and Geotechnics 2010, 37, 440–448. 440
doi:10.1016/j.compgeo.2010.01.003. 441
6. Rogers, C.; Hao, T.; Costello, S.; Burrow, M.; Metje, N.; Chapman, D.; Parker, J.; Armitage, R.; Anspach, J.; 442
Muggleton, J.; Foo, K.; Wang, P.; Pennock, S.; Atkins, P.; Swingler, S.; Cohn, A.; Goddard, K.; Lewin, 443
P.; Orlando, G.; Redfern, M.; Royal, A.; Saul, A. Condition assessment of the surface and buried 444
infrastructure – A proposal for integration.Tunnelling and Underground Space Technology2012,28, 202–211. 445
doi:10.1016/j.tust.2011.10.012. 446
7. Lagüela, S.; Solla, M.; Puente, I.; Prego, F.J. Joint use of GPR, IRT and TLS techniques for 447
the integral damage detection in paving. Construction and Building Materials 2018, 174, 749–760. 448
doi:10.1016/j.conbuildmat.2018.04.159. 449
8. van Disseldorp, R. Unique Autonomous Pipeline Mapping System. 2nd Pipeline Technology Conference, 450
2007. 451
9. Sato, M. GPR and Its Application to Environmental Study2001. 452
10. Lunt, I.A.; Hubbard, S.S.; Rubin, Y. Soil moisture content estimation using ground-penetrating radar 453
reflection data. Journal of hydrology2005,307, 254–269. 454
11. Lai, W.W.L.; Chang, R.K.W.; Sham, J.F.C. A blind test of nondestructive underground void 455
detection by ground penetrating radar (GPR). Journal of Applied Geophysics 2018, 149, 10–17. 456
doi:10.1016/j.jappgeo.2017.12.010. 457
12. Desai, L. Underground Utility Survey2016. 2, 4. 458
13. Yelf, R.J. Application of ground penetrating radar to civil and geotechnical engineering.Electromagnetic 459
Phenomena2007,7, 18. 460
14. Becker, T.; Nagel, C.; Kolbe, T.H. Integrated 3D Modeling of Multi-Utility Networks and Their 461
Interdependencies for Critical Infrastructure Analysis. InAdvances in 3D Geo-Information Sciences; Springer, 462
2011; pp. 1–20. bibtex: becker_integrated_2011. 463
15. Becker, T.; Nagel, C.; Kolbe, T.H. Semantic 3D modeling of multi-utility networks in cities for analysis and 464
3D visualization. InProgress and New Trends in 3D Geoinformation Sciences; Springer, 2013; pp. 41–62. 465
16. Hijazi, I.; Kutzner, T.; Kolbe, T.H. Use Cases and their Requirements on the Semantic Modeling of 3D 466
Supply and Disposal Networks. Kulturelles Erbe erfassen und bewahren-Von der Dokumentation zum 467
virtuellen Rundgang, 37. Wissenschaftlich-Technische Jahrestagung der DGPF, 2017, pp. 288–301. 468
17. Gröger, G.; Kolbe, T.H.; Nagel, C.; Häfele, K.H. OGC city geography markup language (CityGML) encoding 469
18. Scholtenhuis, L.L.o.; Duijn, X.d.; Zlatanova, S. Representing geographical uncertainties of utility location 471
data in 3D.Automation in Construction2018,96, 483–493. doi:10.1016/j.autcon.2018.09.012. 472
19. Liebich, T. IFC 2x Edition 3. InModel implementation guide. version 2.0; AEC3 Ltd., 2009. 473
20. JRC. D2.8.III.6 INSPIRE Data Specification on Utility and Government Services – Technical Guidelines. 474
European Commission Joint Research Centre2013. 475
21. ESRI. What are geometric networks?, 2017. 476
22. Lieberman, J.; Ryan, A. OGC Underground Infrastructure Concept Study Engineering Report. OGC 477
Engineering Report, Open Geospatial Consortium, 2017. 478
23. van Oosterom, P. Research and development in 3D cadastres. Computers, Environment and Urban Systems 479
2013,40, 1–6. doi:10.1016/j.compenvurbsys.2013.01.002. 480
24. van Oosterom, P.; Lemmen, C. The Land Administration Domain Model (LADM): Motivation, 481
standardisation, application and further development. Land Use Policy 2015, 49, 527–534. 482
doi:10.1016/j.landusepol.2015.09.032. 483
25. International Standards Organization. ISO 19152: Geographic information — Land Administration 484
Domain Model (LADM), 2012. 485
26. Döner, F.; Thompson, R.; Stoter, J.; Lemmen, C.; Ploeger, H.; Oosterom, P.v.; Zlatanova, S. Solutions for 4D 486
cadastre – with a case study on utility networks. International Journal of Geographical Information Science 487
2011,25, 1173–1189. doi:10.1080/13658816.2010.520272. 488
27. International Standards Organization. ISO 19107:2003(en), Geographic information — Spatial schema, 489
2003. 490