DOI: 10.1534/genetics.110.121764
Inferring Population Decline and Expansion From Microsatellite Data:
A Simulation-Based Evaluation of the Msvar Method
Christophe Girod,* Renaud Vitalis,
†Raphaël Leblois
‡and Hélène Fréville*
,§,1*UMR 7179 (Centre National de la Recherche Scientifique–Muséum National d'Histoire Naturelle), F-91800 Brunoy, France,†Centre National de la Recherche Scientifique–Institut National de la Recherche Agronomique and‡Institut National de la Recherche Agronomique, UMR
Centre de Biologie pour la Gestion des Populations (INRA–Institut de Recherche pour le Développement–Centre de Coopération Internationale en Recherche Agronomique pour le Développement–Montpellier SupAgro), F-34988 Montferrier-sur-Lez Cedex,
France and§Centre d'Ecologie Fonctionnelle et Evolutive, UMR 5175, Centre National de la Recherche Scientifique, F-34293 Montpellier Cedex 05, France
Manuscript received August 4, 2010 Accepted for publication February 21, 2011
ABSTRACT
Reconstructing the demographic history of populations is a central issue in evolutionary biology. Using likelihood-based methods coupled with Monte Carlo simulations, it is now possible to reconstruct past changes in population size from genetic data. Using simulated data sets under various demographic scenarios, we evaluate the statistical performance of Msvar, a full-likelihood Bayesian method that infers past demographic change from microsatellite data. Our simulation tests show that Msvar is very efficient at detecting population declines and expansions, provided the event is neither too weak nor too recent. We further show that Msvar outperforms two moment-based methods (theM-ratio test and Bottleneck) for detecting population size changes, whatever the time and the severity of the event. The same trend emerges from a compilation of empirical studies. The latest version of Msvar provides estimates of the current and the ancestral population size and the time since the population started changing in size. We show that, in the absence of prior knowledge, Msvar provides little information on the mutation rate, which results in biased estimates and/or wide credibility intervals for each of the demographic parameters. However, scaling the population size parameters with the mutation rate and scaling the time with current population size, as coalescent theory requires, significantly improves the quality of the estimates for contraction but not for expansion scenarios. Finally, our results suggest that Msvar is robust to moderate departures from a strict stepwise mutation model.
I
NFERRING past demography is a central concern in evolutionary biology and applied ecology. Character-izing past variations in population size is crucial,e.g., for understanding the impact of past climaticfluctuations on the current distribution of species ( Jacobsenet al. 2005; Elmer et al. 2009; Hu et al. 2009) and for the conservation of endangered species (Frankham et al. 2002). Characterizing the demographic history of a spe-cies by direct approaches requires the monitoring of census data, which can be extremely difficult, not to say impossible, particularly in long-lived species. Yet var-iations in census numbers of individuals also affect the dynamics of the genes carried by these individuals. A powerful alternative to direct approaches is therefore to use the recent advances in population genetic theory, which allow inferences on past demography from the observed distribution of genetic variation in natural populations (Lawton-Rauh2008).Until recently, most of these indirect methods relied on summary statistics calculated from genetic data and tests for departure from their theoretical distribution under a given demographic and mutational model (Cornuetand Luikart1996; Schneiderand Excoffier 1999; Garza and Williamson 2001). For instance, Cornuetand Luikart’s(1996) approach relies on the rationale that rare alleles, which contribute marginally to the heterozygosity, are more likely to be lost follow-ing a bottleneck. A transient excess in heterozygosity, compared to that expected at equilibrium given the observed number of alleles in the sample, can therefore be used as a proxy to detect a bottleneck (Luikartand Cornuet1998). Conversely, a transient heterozygosity deficiency may provide evidence for a population expan-sion (Cornuetand Luikart1996; Lebloiset al.2006). In the same line of ideas, Garza and Williamson (2001) proposed a test to detect past population de-clines, based on the ratio (M) of the number of alleles to the range in allele size observed at microsatellite loci. Because they are easy to implement and do not require time-consuming computations, these moment-based methods have been used in many empirical studies
Supporting information is available online athttp://www.genetics.org/ cgi/content/full/genetics.110.121764/DC1.
1Corresponding author: Centre d’Ecologie Fonctionnelle et Evolutive,
UMR 5175 CNRS, 1919 Rte. de Mende, 34293 Montpellier Cedex 5, France. E-mail: [email protected]
(see, e.g., Spencer et al. 2000; Comps et al. 2001; Colautti et al. 2005). However, these methods suffer from a limited statistical power because they do not make full use of the data. Furthermore, they do not provide any estimate of the severity and the duration of the bottleneck.
Likelihood-based methods coupled with Monte Carlo sampling offer a powerful alternative to these moment-based methods (Felsenstein 1992; Griffiths and Tavaré 1994; Emerson et al. 2001). They rely upon the computation of the likelihood of a sample configu-ration,i.e., the probability to observe the allele counts or the DNA polymorphic sites in that sample, given a demographic and mutational model. The parameters of interest of the underlying model are then estimated by maximizing the likelihood of the observed data. Likelihood-based methods that have been developed for inferring past demographic changes from the observed distribution of genetic variation include, e.g., Batwing (Wilson and Balding 1998; Wilson et al. 2003), Beast (Drummond and Rambaut 2007), IM and IMa (Hey and Nielsen 2004, 2007), Lamarc (Kuhner 2006), and Msvar (Beaumont 1999). These methods differ not only with respect to the underlying demographic model, but also with respect to the markers used (mi-crosatellites, DNA sequences, etc.). However, because the computational burden required to evaluate statis-tical power and accuracy is particularly high, only few studies have attempted to test these methods (Wilson
et al. 2003; Abdo et al. 2004; Rousset and Leblois
2007; Chikhi et al. 2010; Strasburg and Rieseberg 2010).
Among those methods, the one developed by Beaumont (1999), implemented in the software package Msvar and further improved by Storz and Beaumont (2002) and Storz et al.(2002), has been increasingly used in the past few years to infer past demographic changes (supporting information, Table S1). Msvar assumes a demographic model consisting of a single isolated population, which has undergone a linear or exponential change in effective population size at some time in the past. This method is designed to analyze multilocus microsatellite data that evolve according to a stepwise mutation model (SMM) (Ellegren2004). Msvar uses a Markov chain Monte Carlo (MCMC) method to sample from the posterior distribution of the model parameters (i.e., the current effective popu-lation size, the ancestral effective popupopu-lation size before the demographic change, the time at which the latter occurred, and the mutation rate of microsatellite loci). Although Msvar has been widely used, the statistical performance of the method has never been extensively evaluated. In his original article, Beaumont(1999) sim-ulated a handful of data sets with known mutational and demographic parameters and then evaluated the per-formance of the method for detecting demographic events and its sensitivity to the shape (linear or
expo-nential) of the demographic change. However, the pre-cision of the estimation of the model parameters was not evaluated. Furthermore, the performance of Msvar with respect to the severity of demographic change, the time since the population started changing in size, and the mutation model has not been studied yet.
Here, we therefore aimed at evaluating the statistical performance of Msvar (i) in detecting population declines and expansions and (ii) in providing accurate estimates of the model parameters, as a function of the severity of the demographic change, the time since it occurred, and the mutation model. To that end, we performed stochastic simulations to generate micro-satellite data sets under different demographic scenarios and mutation models and then analyzed these simulated data with Msvar. In light of our results, we comment upon the published empirical studies that used Msvar and provide some guidelines for future studies.
METHODS
Demographic model: The demographic model im-plemented in Msvar (Beaumont 1999; Storz and Beaumont2002) considers an isolated panmictic pop-ulation of sizeN0at sampling time (t¼0). Going back-ward in time, the population size N(t) changes deterministically (either linearly or exponentially) to an ancestral size N1 at time t ¼ Ta and then remains constant at N1 for t . Ta (Beaumont 1999). In the following, we will consider only an exponential change in population size, with
NðtÞ5N0
N1
N0
t=Ta ;
for 0,t, Ta, andN(t$Ta)¼N1. For simplicity, the time is measured in units of generations, and population sizes are expressed as numbers of diploid individuals.
Simulation study: To test how Msvar performed de-pending upon the nature of the demographic change (decline or expansion), its strength, and its time of oc-currence, we simulated population declines and expan-sions for a range of parameter values for the current population sizeN0, the ancestral population sizeN1, and the timeTa. The computational burden of the method prevented an exhaustive exploration of the parameter space. In afirst set of simulations, we therefore concen-trated on a set of parameter values that represented a range of situations characterized by weak, moderate, and strong changes in population size, with varying time of occurrence. For population declines, we fixed the current population size N0 ¼ 100 in all scenarios and varied the ancestral population sizeN1¼{1000; 10,000; 100,000} and the time since the demographic changeTa
and varied the current population size N0 ¼ {1000; 10,000; 100,000} and the time since the demographic change Ta ¼ {10; 50; 100; 500}. A total of 24 sets of demographic parameters were therefore considered. For thisfirst set of simulations, each locus evolved accord-ing to a strict SMM, as assumed in Msvar.The mutation rate m was set at 1023, which is in agreement with
esti-mates from the literature (Ellegren2004).
Then, to test how Msvar performed depending upon the mutation model, we performed a second set of simulations. The mutation process of microsatellites is complex and highly heterogeneous across loci and organisms (Ellegren 2000, 2004). While some obser-vations of spontaneous mutations support a strict SMM, others suggest that multistep mutations occur, with a fre-quency of multistep changespvarying from 0.04 to 0.74 (Ellegren 2000, 2004). Apart from a strict SMM, we thus simulated microsatellite data under a generalized stepwise model (GSM) withp¼0.22, an average value found in the literature (Dibet al.1996; Ellegren2000; Estoupet al.2001; Ellegren2004), and withp¼0.74, the most extreme value reported ever (Fitzsimmons 1998). The mutation rate m was set at 1023. For that
second set of simulations, we considered a population decline scenario (withN0¼100,N1¼10,000, andTa¼
500), a population expansion scenario (with N0 ¼
10,000,N1¼100, andTa ¼500), and a stable popula-tion scenario, taking the (constant) populapopula-tion size as the harmonic mean of the population size change from 100 to 10,000 forTa¼500 generations;i.e.,N0¼N1¼
464. This second set of simulations therefore consisted of seven sets of parameters: three mutation models were considered for the stable population scenario (the SMM and the two GSMs), and two mutation models were considered for each of the declining and expand-ing population scenarios (the two GSMs).
Microsatellite data were simulated with Simcoal2 (Laval and Excoffier 2004), which generates sam-ples of genes under various demographic models, using a discrete-generation coalescent algorithm. Discrete-generation algorithms produce simultaneous and multiple coalescences, which are canceled out in the continuous-time approximation of the coalescent. There might there-fore be a slight discrepancy between the coalescence rate in the discrete-generation algorithm and the continuous-time approximation that is assumed in Msvar, particularly for large sample sizes and small effective population size (see,e.g., Figure S2 in Cornuet et al.2008). However, we find it more relevant to simulate the data without relying on approximations. Each data set consisted of a sample of 50 diploid individuals, genotyped at 10 un-linked microsatellite loci. This sampling scheme is consis-tent with empirical studies that inferred past demographic changes using Msvar: from an exhaustive survey of the literature (Table S1), we found that the median numbers of microsatellite loci and sampled individuals across data sets were 11.5 and 30, respectively.
For each set of parameters, we simulated five micro-satellite data sets to have replicates from the same underlying demographic and mutation model. We therefore obtained a total of 120 simulated data sets for the first set of simulations and 35 data sets for the second set. For each set, we calculated the mean and standard deviation over the five replicates of the expected heterozygosity He (Nei 1978), the observed number of allelesNa, the range in allele sizeAr, and the variance of allele range Va, using Arlequin (Excoffier
et al.2005).
Parameterization of Msvar: In Msvar, the posterior distribution of the model parameters is computed by means of a MCMC method using the Metropolis– Hastings algorithm (Metropoliset al.1953; Hastings 1970). The likelihood is calculated from the genealog-ical history of the sample of genes, represented as a sequence of events (coalescences and mutations, see Beaumont1999).
We used version 1.3 of Msvar, which provides separate estimates for N0, N1, m, and Ta (Storz and Beaumont2002). This implementation of Beaumont’s (1999) method, available at http://www.rubic.rdg.ac.uk/
mab/stuff/, relies upon a hierarchical model where demographic and mutational parameters are allowed to vary among loci. The extent of interlocus variation is set by priors, as described in File S1. The parameter values reported in the following correspond to the mean of N0, N1, Ta, and m, across loci. To test whether the method could retrieve information from the data, we chose relatively flat priors on the mean parameters, in-cluding the mutation rate.
Implementation: Analyses were run on a Beowulf cluster made of 19 computer nodes, with CPUs ranging from biprocessors AMD Opteron monocore running at 1.8 GHz to biprocessors Intel Xeon quadcore running at 2.0 GHz. For each of the simulated data sets, three independent Msvar analyses were performed, with different starting values of the model parameters and different sets of seeds for the random number gener-ator. For the first set of simulations (strict SMM with population size change), each Markov chain was initially run for 109 steps and was thinned to 40,000
output lines by recording parameter values every 25,000 steps. In the absence of convergence, longer chains were run (see results). For the second set of simulations (strict SMM with stable population and GSM with stable, expanding, and declining popula-tions), each Markov chain was run for 3 · 109 steps,
within-chain variance, which should be close to 1 if the within-chains converge to the target distribution. The multivariate Gelman and Rubin’s diagnostic was calculated from the meansM[{MN0, MN1, MTa, Mm} and standard devi-ationsV[{VN0, VN1, VTa, Vm} of Msvar parameters across loci, using the CODA package (Plummer et al. 2006) implemented in the statistical software R (R Develop-ment Core Team 2009). Although it might be recom-mended to run more chains to compute Gelman and Rubin’s diagnostic (e.g., Nettel et al. 2009 used eight independent chains), the computational burden pre-vented us from running more than three chains in the present study.
Analysis of Msvar outputs: Msvar outputs were analyzed by focusing on two issues: (i) the performance of Msvar at detecting past demographic changes and (ii) the precision of Msvar estimates of the model parameters. For each of the simulated data sets, we combined the three Markov chains before running the following analyses. The strength of evidence of popula-tion expansionvs. population decline (and vice versa) was evaluated using Bayes factors ( Jeffreys1961; Kass and Raftery1995), as suggested by Beaumont(1999) and Storzand Beaumont(2002). The Bayes factor is a ratio where the numerator is the posterior probability of one model divided by its prior probability and the denominator is the posterior probability of an alterna-tive model divided by its prior probability (Gelmanet al. 1995). With identical priors for the population decline and the population expansion models (i.e., identical priors forN0andN1), the Bayes factor for, e.g., a pop-ulation decline is the ratio of the posterior probability of a population decline divided by the posterior proba-bility of a population expansion. This ratio can be esti-mated by counting the number of states in the chain in which the population has declined (i.e.,N0/N1,1) and then dividing this by the number of states in which the population has expanded (i.e.,N0/N1.1) (see Storz and Beaumont2002).
We estimated the marginal posterior distributions of the model parameters using the LOCFIT package (Loader 1999) implemented in R (R Development Core Team 2009). Point estimates of natural parame-tersN0,N1,Ta, andmwere computed from the mode of their marginal posterior distribution. The 90% highest probability density (HPD) intervals were computed with the CODA package. We also estimated the marginal posterior distributions of the scaled parameters u0 [
4N0m,u1[4N1m, andtf[Ta/(2N0), and we computed
point estimates and 90% HPD intervals for these scaled parameters. For each demographic scenario consid-ered, we calculated the absolute value of the bias for both natural and scaled parameters over thefive repli-cated data sets.
Detection of population size change with Bottleneck and the M-ratio test: Finally, for the first set of simu-lations (strict SMM with population size change), we
compared the performance of Msvar to detect genetic signatures of demographic changes with the two most widely used moment-based methods available for micro-satellite data. First, we analyzed the data sets using the method developed by Cornuet and Luikart (1996) and implemented in the software package Bottleneck v.1.2 (Cornuet and Luikart 1996). Wilcoxon signed-rank tests were performed to determine if a data set exhibited a significant number of loci with heterozy-gosity excess as expected in bottlenecked populations (Luikartet al. 1998) or with heterozygosity deficiency as expected in expanding populations (Cornuet and Luikart1996). Second, we calculated Garzaand Williamson’s(2001) Mratio on the 60 data sets cor-responding to population declines. We compared em-pirical values of theMratio to 95% critical values (Mc) derived from 10,000 simulations of stable populations using the program Critical_M. Simulations were per-formed using the true value ofu1(u1¼4, 40, and 400
in the scenarios considered) and assuming a strict step-wise mutation model. We considered that an M ratio below the critical valueMcwas indicative of a population decline.
RESULTS
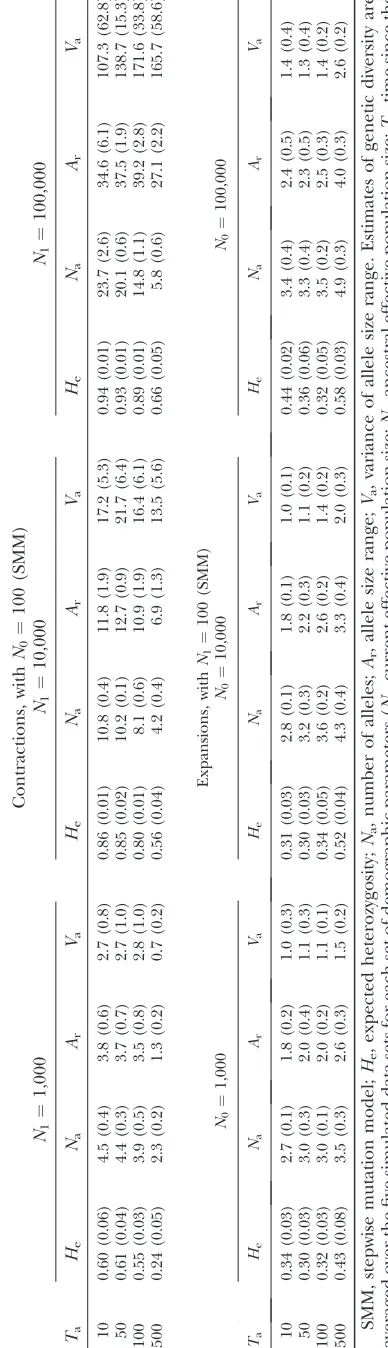
Genetic diversity of the simulated data sets, under a strict SMM:For thefirst set of simulations (strict SMM with population size change), the expected heterozy-gosity He, the number of alleles Na, and the range in allele size Ar are reported in Table 1. For contraction scenarios,Heranged from 0.24 to 0.94.Naranged from 2.3 to 23.7 andArvaried from 1.3 to 39.2. In agreement with theoretical expectations,He,Na, and Ar increased withN1, the genetic diversity in the current population being sustained by large ancestral populations. Further-more, genetic diversity decreased with increasing Ta, the loss of genetic diversity being more pronounced for long contraction events. For expansion scenarios,
He ranged from 0.30 to 0.58. Na ranged from 2.7 to 4.9 and Ar varied from 1.8 to 4.0. In agreement with theoretical expectations,He,Na, andAr increased with increasing Ta since the number of mutations that seg-regate in the population increases with the age of the expansion event. We also observed a tendency for ge-netic diversity to increase with increasingN0, although this trend was not clear cut.
MCMC convergence: In the following, we used Gelman et al.’s (2004) rule of thumb, which suggests that values of the multivariate Gelman and Rubin’s con-vergence diagnostic between 1.0 and 1.1 indicate rea-sonable convergence, whereas values .1.1 indicate poor convergence. Of the 120 analyses of thefirst set of simulations, 67 converged after 109steps (Table S2).
and were thinned to 120,000 output lines by record-ing parameter values every 25,000 steps. Of these 53 analyses, 20 converged after 3 · 109steps, which took
on average 20 days per chain. Finally, the last 33 non-converged analyses were run for 1.5·1010steps, which
took 60 days per chain on average. Of these 33 analyses, 16 converged after 1.5·1010steps. Therefore, a total of
17 analyses of 120 (14.2%) did not converge after 1.5· 1010steps. Most of these nonconverged analyses
corre-sponded to recently and severely bottlenecked pop-ulations (Ta , 500 and N0/N1 ¼ 0.001; Table S2). However, visual inspection of the three chains in the nonconverged analyses, as well as the similarity of the marginal posterior distributions, suggested that the chains were close to equilibrium. Therefore, we included the 17 nonconverged analyses in our results. The cumula-tive computation time for the completion of all the analyses included in our study exceeded 276· 103hr
(33.5 years). There was a significantly positive correla-tion between the time of convergence and the average range in allele size Ar in the sample for both contrac-tions (Spearman’sr¼0.82;P,0.001) and expansions (Spearman’sr ¼0.49; P,0.001).
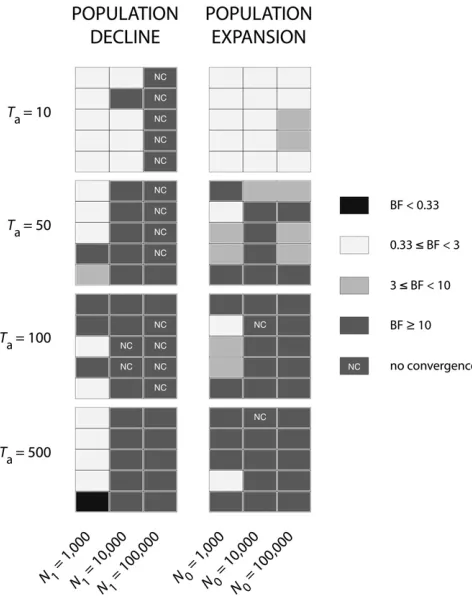
Detection of demographic events with Msvar, under a strict SMM: Bayes factors (BF) were computed for each of the 120 analyses of the first set of simulations and interpreted following Jeffreys (1961): BF $ 10 indicate strong support, BF ranging from 3 to 10 indi-cate substantial support, BF ranging from 0.33 to 3 in-dicate no support, and values ,0.33 indicate false detection of contraction or expansion. In 85 analyses of 120 (70.8%), Bayes factors indicated a change in population size consistent with the simulated scenario with substantial to strong support (BF$3 and BF$10, respectively; see Figure 1). Of the 60 Markov chains corresponding to contraction scenarios, 41 (68.3%) in-dicated a population decline (BF $ 3), of which 40 (97.6%) showed strong support (BF$ 10). Fifteen of these 40 analyses (37.5%) did not converge. Of the 60 analyses corresponding to expansion scenarios, 44 (73.3%) indicated a population expansion (BF $ 3), of which 34 (77.3%) showed strong support (BF $ 10). Two of these 34 analyses (5.9%) did not converge. Overall, all the ancient (Ta $ 50) and severe demo-graphic changes (N0/N1 # 0.01 for contractions and
N0/N1 $ 100 for expansions) were detected with sub-stantial to strong support (Figure 1). By contrast, recent declines and expansions (Ta ¼ 10) were largely un-detected (BF , 3), except for strong contractions (N0/N1¼0.001). Moreover, weak contractions (N0/N1¼
0.1) were largely undetected whatever their time of occurrence and one false expansion was even detected for an ancient and weak bottleneck (BF, 0.33, Ta ¼
500,N0/N1¼0.1).
Comparison of Msvar with moment-based methods:
Because Bayes factors cannot be formally compared to
P-values, we were not able to use the same criterion for
detecting population size change with Msvar, Bottle-neck, and theM-ratio test. Therefore, we reported in Figure 2 the criteria that are generally used in empirical studies: BF $ 3 for Msvar, the result of the Wilcoxon signed-rank tests at the a ¼ 0.05 level for Bottleneck (Cornuet and Luikart 1996), and an M ratio below the critical valueMc(Garzaand Williamson2001) for theM-ratio test.
Bottleneck detected a significant excess of heterozy-gosity in only 5 of the 60 data sets corresponding to contraction scenarios (8.3%). Ancient events (Ta ¼
500) were never detected whatever their severity. More-over, there was no clear relationship between the rate of detection of population decline and the severity of the event. Finally, 4 data sets corresponding to ancient con-tractions (Ta $ 100) showed significant heterozygote
deficiency, hence supporting population expansions. Contrastingly, Bottleneck detected a significant defi-ciency in heterozygosity in 35 of 60 data sets corre-sponding to expansion scenarios (58.3%). Garza and Williamson’s(2001)M-ratio method correctly detected a signal of contraction in 32 of 60 data sets (53.3%). The rate of detection was higher for ancient (Ta$50)
and moderate-to-severe population declines (N0/N1$
0.01), with 26 significant tests of 30. Recent (Ta ¼10) and/or weak declines (N0/N1 ¼ 0.1) were barely de-tected (6 significant tests of 30).
Estimation of demographic and mutational parame-ters with Msvar, under a strict SMM:Demographic and mutational parameters were estimated for all data sets, by combining the three Markov chains run for each data set. We assessed the quality of the estimates by examining the marginal posterior distributions of the parameters, compared to their prior distributions. We summarized these results by calculating the modes and the 90% HPD intervals for each data set (Figure S1, Figure S2,Figure S3, andFigure S4) as well as the ab-solute value of the bias and the average HPD range over the five replicate data sets for each of the 24 demo-graphic scenarios (Figures 3 and 4).
Estimates of the natural parameters N0, N1, Ta, and m:
Overall, the marginal posterior distributions of the demographic parameters N0, N1, and Ta were wide and departed only slightly from the priors (e.g., Figure 5, A and B). The estimated 90% HPD limits were there-fore broad (Figure 3), ranging from 24 to 8 in log10
scale (Figure S1andFigure S2).
For contractions, replicated data sets tended to pro-vide more consistent results for old and severe events, compared to recent events (Ta ¼10) or events of low severity (N0/N1¼0.1) (Figure S1). The precision of the demographic parameter estimates tended to increase with increasing severity of the demographic change (measured by the ratio N0/N1) and the time of the event: (i) the 90% HPD range of the demographic parameter estimates decreased with increasing N0/N1
(Figure 3 and Figure S1); (ii) for moderate to strong contractions (N0/N1 . 0.1), the 90% HPD range de-creased with increasing Ta; and (iii) for N0/N1 ¼ 0.1, the 90% HPD range was the lowest for intermediate values of Ta. The absolute value of the bias of N0 esti-mates tended to be lower than that ofN1and was max-imized for recent events (Ta ¼10).
The quality of the estimates of N0, N1, and Ta was poorer for expansions, compared to contractions. The marginal posterior distributions were not sharply peaked and did not depart markedly from the priors. The 90% HPD limits were wide and the absolute value of the bias was high, overall (Figure 3). This was true whatever the severity of the event and its time of occur-rence. It is noteworthy that, with few exceptions, all de-mographic parameter estimates differed markedly across replicate data sets (Figure S2). We noted that for a given expansion severity, estimates of N0 increased with Ta, while estimates ofN1decreased withTa (Figure S2).
For contractions and expansions, the marginal pos-terior distributions ofmdeparted only slightly from the prior distributions, whose mean was set atam¼24 on
a log10 scale. Because the true mutation rate m of the
simulated data sets was set at 23 on a log10 scale, the Figure 1.—Detection of change in population size with
mutational parameter m was therefore systematically underestimated, as already pointed out by Milton
et al. (2009). The 90% HPD intervals of the marginal
posterior distributions ofmwere wide (data not shown). Finally, we examined the patterns of correlation be-tween natural parameters to assess the performance of Msvar to estimate natural parameters separately. We observed strong correlations between natural parame-ters of the model. Overall, bothN0andN1were nega-tively correlated with the mutational parameterm and there was a positive correlation betweenN0andTa( Fig-ure S5). The correlations were stronger for more severe events and more ancient events. Furthermore, the cor-relations were more pronounced for contractions than for expansions.
Estimates of the scaled parameters u0, u1, and tf: Scaled
parameters were overall much more precisely estimated than the natural parameters for contractions, whereas they were poorly estimated for expansions. As with the natural parameters, the quality of the estimates de-pended upon the severity of the demographic change and its time of occurrence.
For contractions, the marginal posterior distributions of the scaled parametersu0,u1, andtfwere very peaked
and departed markedly from the prior distributions
(e.g., Figure 5, C and D), except for contractions of low severity (N0/N1 ¼ 0.1). The precision (low bias, narrow 90% HPD interval) increased with increasing severity of the event and time of occurrence (Figure 4 andFigure S3). In particular, estimates ofu1andtfwere
overall very precise for moderate to severe bottlenecks (N0/N1,0.1), except for very recent events (Ta¼10). Althoughu0was also well estimated for ancient declines
(Ta . 50) from moderate to strong severity, the bias and the range of 90% HPD intervals were larger com-pared to those of u1. Replicate data sets provided
con-sistent results for u1 and tf, for moderate and strong
contractions (N0/N1, 0.1) that occurred.10 genera-tions ago (Ta . 10). Larger variation across replicate data sets was observed for u0.
For expansions, the marginal posterior distributions of the scaled parameters u0 and u1 were peaked and
departed markedly from the prior distributions (data not shown). However, the mode of the marginal poste-rior distributions for u0 departed markedly from the
true simulated value, resulting in severe biases (Figure 4 and Figure S4). By contrast, the scaled parameter u1
noted that the marginal posterior distributions of u0andu1were skewed, respectively, to upper and lower
values (Figure 4 andFigure S4). The 90% HPD intervals of the marginal posterior distributions for the time pa-rametertfwere wide in most conditions (Figure 4 and Figure S4) and estimates were severely biased, except forTa¼500. Both the 90% HPD interval and the bias decreased with increasingTa. We observed large varia-tions across replicate data sets for all scaled parameters in almost all situations, particularly fortf.
Influence of the mutation model in Msvar:Of the 30 analyses presented in Figure 6 for the GSM, 12 (40%) did not converge after 3 · 109 steps. Out of these, 9
analyses (75%) concerned the data sets generated with the strongest GSM (p¼0.74). With data generated un-der the moun-derate GSM (p ¼0.22), Msvar successfully detected a population decline for the five simulated data sets and a population expansion for four simulated data sets offive. However, Msvar detected a false signal of population decline for two data sets offive that were simulated under a stable population scenario (Figure 6). Under a strong GSM (p ¼0.74), Msvar detected a signal of population decline with strong support (BF$ 10), whatever the simulated scenario (Figure 6).
The quality of Msvar estimates of scaled parameters for the moderate GSM (p ¼ 0.22) was very similar to that observed for the strict SMM, with very precise
esti-mates ofu1andtf, a slightly larger bias, and 90% HPD
intervals foru0compared tou1in contraction scenarios
and poorer estimates, with large variations across re-plicate data sets, in expansion scenarios (Figure S6). For stable population scenarios, both the strict SMM and the moderate GSM (p¼0.22) produced unbiased estimates of u0 and u1, but with very large 90% HPD
intervals. Note that in the absence of population size change, estimates of tf are meaningless. Very
consis-tently, Msvar produced biased estimates of the model parameters, with very narrow 90% HPD intervals, for all the data sets generated under the strong GSM (p ¼
0.74) (Figure S6).
DISCUSSION
simulation-based evaluations, given the set of demo-graphic and mutational parameters considered here (see, e.g., Figure 3B in Cornuet and Luikart 1996). For moderate to severe population declines (N1/N0$
100), however, the rate of detection was lower in our study than in Cornuet and Luikart(1996). Two pos-sible reasons may explain this discrepancy. First, the average heterozygosity in our simulated data sets was Figure4.—Precision of the estimates of the scaled parametersu0,u1, andtf. Bias (histograms) and absolute value of the range of the 90% HPD interval (horizontal colored traits) for scaled parametersu0,u1, andtf(from left to right) are presented in a log10 scale. Top, population declines; bottom, population expansions. In each graph, the dotted vertical line separates scenarios of increasing severity (N1¼1000,N1¼10,000, andN1¼100,000 for population declines andN0¼1000,N0¼10,000, andN0¼ 100,000 for population expansions). For each severity, the time of occurrence of the demographic event Tais represented by different colors (orange forTa¼10, light green forTa¼50, dark green forTa¼100, and blue forTa¼500).
overall higher than in Cornuet and Luikart (1996) who considered a variable mutation rate across loci and simulations, to cover a range of heterozygosities per set of parameters. Second, we simulated an exponential change of population size, whereas Cornuet and Luikart (1996) assumed an instantaneous reduction of population size in their simulation-based tests. The
impact of the shape of the demographic change on the performance of Bottleneck has not been studied yet. Consistent with our study, the simulation-based evalua-tion of Bottleneck by Lebloiset al.(2006) also showed a low statistical power of the method. Interestingly, Bottleneck performed largely better for expansions (58.3%) than for contractions (8.3%), given the model parameter values of our study.
We found that theM-ratio test was more efficient than
Bottleneck,which is consistent with Lebloiset al.(2006), for retrieving signals of population declines from our simulated data sets (32 significant tests of 60). The rate of detection was higher for ancient and moderate-to-severe declines, while recent and weak declines were barely detected. These results are consistent with pre-vious simulation-based studies that have shown that the
M-ratio test has low statistical power for small u1
val-ues (here, u1 ¼4, see Garza and Williamson 2001;
Williamson-Natesan2005) and for recent population declines (see Williamson-Natesan2005; Lebloiset al. 2006). Here, we applied theM-ratio test by comparing the statistic M estimated from the data with the ex-pected distribution of that statistic, conditionally on the true value of u1. This procedure increased the
sta-tistical power of theM-ratio test. Since the true value of the parameteru1is generally unknown in real situations,
Garzaand Williamson (2001) recommended the use ofMc¼0.68 as a conservative threshold for the critical value. The reanalysis of our data sets withMc¼0.68 (e.g., as in Lebloiset al.2006) resulted in a lower rate of de-tection (22 significant tests of 60), but in similar quali-tative trends (higher rate of detection for severe and ancient population declines).
Given the set of demographic and mutational param-eters used in our study, and using the decision criteria recommended by the developers of each method, Msvar clearly outperformed theM-ratio test and Bottle-neck for detecting population size change. While Msvar correctly detected 68.3% of the declines, the M-ratio test and Bottleneck detected only 53.3% and 8.3%, re-spectively, of the declines. Any population decline detected by the M-ratio test and Bottleneck was also recovered by Msvar,apart from one case of weak recent decline that was identified only by Bottleneck (Ta¼10 andN0/N1¼0.1). Therefore, our study does not sup-port the previous claims that the M-ratio test and Bot-tleneck are best suited to detect recent population declines, whereas Msvar is more appropriate to detect ancient contractions (Garza and Williamson 2001; Williamson-Natesan 2005). Moreover, while Msvar detected 73.3% of the population expansions, Bottle-neck detected only 58.3% of the expansions. Any ex-pansion detected by Bottleneck was also recovered by Msvar.
Performance of Msvar: What does coalescent theory tell us?Not surprisingly, we found that the performance of Msvar to infer past demography strongly depended Figure 6.—Detection of change in population size with
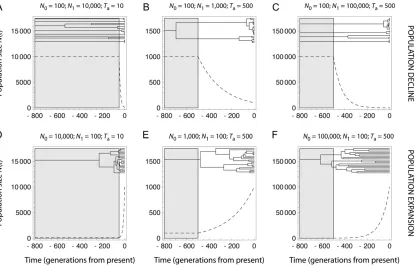
on the information available in the data, which may be inferred from coalescent theory. Coalescent theory in-deed predicts that variations in population size strongly affect the shape of gene genealogies, which are star shaped with long terminal branches in expanding populations and shallower in declining populations (Figure 7 and Hein et al.2005).
Coalescent theory further shows that only scaled para-meters can be directly estimated from the data (Tavaré
et al.1997; Nordborg2007). Indeed, all parameters in
coalescent models are scaled, and the likelihood func-tion in Msvar makes no excepfunc-tion (Beaumont 1999). Hence, inference of unscaled quantities such as popu-lation size, or time measured in generations, requires external information. In our study, unscaled parame-ters were therefore much less precisely estimated than the scaled ones (Figure 5) and were also highly corre-lated (Figure S5; see also Figure 5 in Storzet al.2002). We deliberately chose poorly informative priors, to test the capacity of Msvar to retrieve information from the data only. In empirical studies, more informative priors of the natural parameters are usually specified. We ac-knowledge that Msvar offers a principled approach for providing prior information on the mutation rate, to recover posterior densities for natural parameters. Yet it should be borne in mind that precise estimates of unscaled parameters may then largely stem from the
specification of the priors. Imagine that analyses were performed using a prior distribution for the mutation rate with very low standard deviation (i.e., sm close to
zero). We would then necessarily recover the same level of precision for the natural parameters and the scaled parameters. Yet this improved precision may come at the expense of accuracy, if the prior distribution for the mutation rate departs from its true distribution.
Scenarios of population decline:Msvar was very efficient
for detecting population declines. However, its perfor-mance for detecting change in population size and accurately estimating the model parameters was lowest for recent events (Ta ¼10) of low-to-moderate severity (N0/N1 $ 0.01), as well as for events of low severity (N0/N1 ¼ 0.1). This is expected since, for very re-cent declines, the gene genealogy can barely be dis-tinguished from that expected in a stable population with population size N1 (Figure 7A). Interestingly, for
N0/N1¼0.1, the performance of Msvar was maximized for intermediate values of Ta, particularly with respect to the precision of u1 estimates. This might be easily
number has a known distribution in a constant-size pop-ulation (Tavaré 1984), and Leblois and Slatkin (2007) extended Tavaré’s (1984) formula in the case of an exponentially growing or declining population. Using their Equation 2 that gives an expression for the probability Pr(jjn) that a sample of n genes has
j ancestors Ta generations ago, we may compute the expected numbermof lineages at the time of the pop-ulation size change as
m5X n
j51
j PrðjjnÞ5 X n
j51
jX n
i5j
ð2i21Þð21Þi2jjði21Þn½i j!ði2jÞ!nðiÞ e
2iði21Þt=2; (1)
wherea(i)[a(a11). . .(a1i21),a[i][a(a21). . .
(a 2 i 1 1), and t5ÐTa
0 ðdt9= 2Nðt9ÞÞ5ðð12N0=N1Þ= N0 LogðN1=N0ÞÞTa. For a declining population with
Ta ¼ 500 and N0/N1 ¼ 0.1, we get m ¼ 1.43, which confirms that most coalescence events are expected to occur in the current population with this set of parame-ter values.
For moderate to severe contractions (N0/N1# 0.1), both the bias and the 90% HPD range ofu0decreased
with increasingTa. Using Equation 1, we found that the expected numbermof lineages at the time of the event varies between 48.49 and 2.20 forTavarying from 10 to 500 and for N0/N1 ¼ 0.01. This indicates that more coalescence events are expected to occur in the declin-ing population when the event is older (see also Figure 7C). In contrast,u1was overall precisely estimated (see
Figure 4 and Figure S3). This is so because, for the scenarios considered here, a large part of the genealogy depends upon the ancestral history, with several line-ages coalescing in the ancestral population (see, e.g., Figure 7, B and C) at a rate that depends upon u1.
Had we considered older events (Ta . 500), though, thereby decreasing the number of lineages in the an-cestral population, it is likely that the precision of u1
estimates would have declined.
In summary, most scenarios of population decline result in gene genealogies with large times to the most recent common ancestor (TMRCAs). With the set of model parameters considered here, since a large part of gene genealogies depends uponu1, this latter
parame-ter is generally precisely and accurately estimated. Con-trastingly,u0can be precisely and accurately estimated
only if the demographic event is severe and ancient. If the change in population size is too recent, provided that it is not too pronounced,u0estimates tend to
con-verge to the true value ofu1, and no change of
popu-lation size is detected. If the difference in popupopu-lation size is weak, then the difference in coalescence rates before and after the event is not sufficient for Msvar to detect a population size change and to provide pre-cise estimates ofu0andu1.
Scenarios of population expansion: Msvar was also very
efficient for detecting expansions. Nevertheless, the estimates of the scaled current population sizeu0were
more severely biased and less precise, compared to sce-narios of population decline, for the same relative se-verity of the event. This may be explained by the fact that expanding populations result in young genealogies with short TMRCAs (compare Figure 7, A–C, to 7, D–F) and hence rare mutation events. We found that the absolute value of the bias increased withN0. We further found that both the 90% HPD range and the absolute value of the bias of u0 decreased with increasing Ta
(Figure 4 andFigure S4). Using Equation 1, we found that the expected number mof lineages at the time of the event varies between 48.49 and 2.20 forTa varying from 10 to 500 and forN0/N1¼100. This indicates that the number of coalescence events in the expanding population is expected to increase asTaincreases (see also Figure 7F). More generally, the likelihood surface for expanding populations is complex (Beaumont 1999). In particular, as the genealogies become more star shaped, the joint posterior distribution ofu0andtf
reduces to a ridge along a line log10(2mTa)¼ k
inde-pendent of u0 (Figure 4b in Beaumont 1999), which
suggests that Msvar provides information on 2mTa, rather than on u0 in expanding populations. It is
worth noting that Wakeleyet al.(2001) found similar results in inferring demographic history from single-nucleotide polymorphims (see a comparison in Beaumont2004).
Estimates ofu1had a low bias but a large 90% HPD
range (Figure 4). Although the marginal posterior dis-tributions of u1 were generally peaked, they were flat
tailed on the left. This is so, because large ancestral population sizes are not compatible with the low poly-morphism observed in the data. Instead, a large range of small values ofu1may be equally likely, provided the
genealogy is star shaped.
Influence of the underlying demographic model:
Athough Msvar equally detected population declines and expansions, inferences of the demographic param-eters were in general more accurate for declines than for expansions. In addition to the above argument from coalescent theory, the exponential model assumed for population size change may partly explain this pattern. For declines, the size of the declining populationN(t) decreases sharply at Ta and converges rapidly to N0
(Figure 7, A–C). Therefore, most coalescence events occurring in the declining population take place while
N(t) is close to N0. For expansions, instead, the size of the expanding populationN(t) increases smoothly atTa
before it converges rapidly to N0 (Figure 7, D–F). Therefore, a large proportion of the coalescence events that occur in the growing population take place whileN
coalescent rate during the change in population size
(Hein et al. 2005). For, say, Ta ¼ 500, the harmonic
mean of an exponentially declining population with
N0¼100 andN1¼10,000 is 464, which is strictly equal to the harmonic mean of an exponentially growing pop-ulation with N0 ¼ 10,000 and N1 ¼ 100. Hence, the harmonic mean of a declining population is closer to its current size (N0) than its ancestral size (N1), while the reverse is true for expanding populations. There-fore, given the exponential model of population growth, one might expect poor statistical properties of u0 estimates in expanding populations, compared to
declining populations.
Robustness of Msvar to the misspecification of the mutation model: Most importantly, our results suggest that Msvar is robust to moderate departures from a strict SMM, e.g., a GSM with p # 0.22, typical of those ob-served in the literature (see Figure 6 and Figure S6). However, severe departures from a strict SMM (here, a GSM with p ¼ 0.74) led Msvar to detect a signal of population decline with strong support (BF$10), even in expanding populations (Figure 6 and Figure S6). This is not surprising since it has been recognized that violation of the assumptions of the SMM might induce severe bias in the inference of demographic history (Gonseret al. 2000). Indeed, mutations that arise un-der a strong GSM involve large changes in allele length, which produce some gaps in the distribution of allele types. The large resulting variance of allele rangeVais reminiscent of that observed with population decline (Storzand Beaumont2002), even in expanding pop-ulations (compare Table 1 toTable S3).
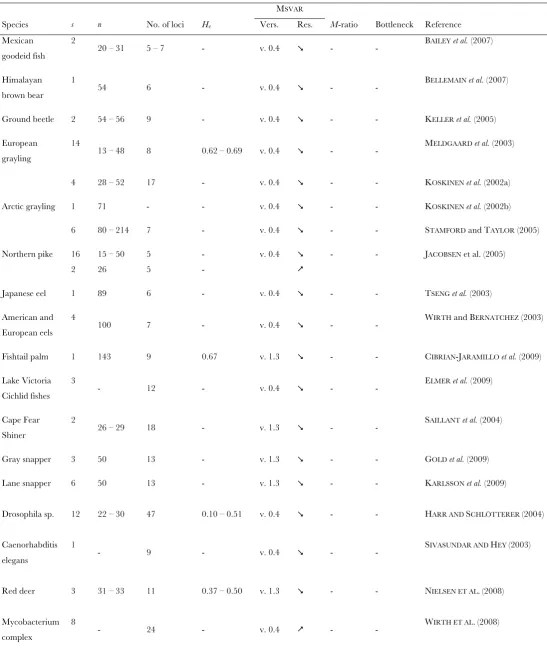
Insights from empirical studies: The better perfor-mance of Msvar compared to theM-ratio test and Bot-tleneck also emerged from the empirical studies that inferred past demographic changes from microsatellite data using Msvar and at least one of the M-ratio or Bottleneck methods (Table S1). We found indeed that Msvar detected a population decline whenever one of the moment-based methods provided a significant test. By contrast, a large number of population declines that were not detected with any of the moment-based meth-ods were detected with Msvar. Unfortunately, the scar-city of expansion events detected in the literature (Table S1) prevented any empirical comparison of Msvar and Bottleneck for growing populations. Impor-tantly, the average genetic diversity measured from our simulated data sets was not substantially different from that observed in empirical studies (compare Table 1 to Table S1).
Because of the large heterogeneity of the published results, we did not attempt to analyze the quality of Msvar estimates in empirical studies. Some studies used Msvar 0.4 (Beaumont1999), hence providing estimates for scaled parameters, and some studies used Msvar 1.3 (Storz and Beaumont 2002), hence providing esti-mates for unscaled parameters. Only a handful of
stud-ies used both methods, and few provided estimates of the scaled parameters using Msvar 1.3, as in the present study. Finally, credibility intervals were often not re-ported or calculated using different methods, which hampered any comparison among studies.
Recommendation guidelines and conclusions: Our simulation tests as well as an exhaustive survey of the literature clearly demonstrate that Msvar outperforms both theM-ratio test and Bottleneck for detecting pop-ulation declines. Our study further shows that Msvar is also very efficient to detect population expansions and outperforms Bottleneck in that respect. However, to our knowledge, Msvar has only scarcely been applied on presumably expanding populations (see, e.g., Hufbauer
et al. 2004; Bonhomme et al. 2008; Wirth et al. 2008).
Hence, we confidently recommend the use of Msvar for detecting past population size variation, even if this method is computationally demanding.
Most importantly, in contrast to theM-ratio test and Bottleneck, Msvar provides estimates of the parameters that characterize the population demographic history and the mutational model. Using Msvar 1.3 (Storz and Beaumont 2002), we have shown that the scaled parameters are more precisely estimated than the nat-ural parameters. Although the latter are easier to inter-pret, our results clearly advocate drawing conclusions from inferences ofu0,u1, andtf. These parameters were
Finally, we recommend that inferences about pop-ulation demographic change with Msvar should be interpreted cautiously in light of potential departures from the model assumptions. First, Msvar assumes that microsatellites evolve according to a strict SMM. Although a moderate departure from this mutation model, as classically measured with observations of spontaneous mutations (Ellegren 2000, 2004), does not seem to undermine Msvar performance (see Figure 6 and Figure S6), loci that evolve under a strong GSM may invalidate the approach by detecting false signals of population decline whatever the true demographic his-tory. However, the hierarchical model implemented in Msvar 1.3 allows for variations in mutation and demo-graphic parameters across loci and may thus limit the potential biases due to misspecifications of the muta-tion model. Indeed, Storzet al. (2002) argue that loci that strongly depart from the strict SMM shall be given less weight, thereby minimizing their impact on the in-ference made. Second, Msvar assumes that populations are isolated. Real populations, however, are in general connected by geneflow. It is now acknowledged that population structure and/or isolation by distance may result in incorrect inference of population demo-graphic history (Pope et al. 2000; Leblois et al. 2006; Nielsen and Beaumont 2009; Chikhi et al. 2010;
Peter et al. 2010). Finally, further work is needed to
evaluate how Msvar performs when the demography is more complex,e.g., with successions of population de-clines and expansions.
We are grateful to L. Chikhi for sharing an unpublished manu-script, as well as to Mark A. Beaumont and two anonymous reviewers for their constructive criticism of this article. This work was supported by the Plan Pluri-Formation“Evolution et Structure des Ecosystèmes” (2004–2008) from the Muséum National d’Histoire Naturelle (MNHN), by a Nouragues Research grant from the Centre National de la Recherche Scientifique (CNRS) programme Amazonie I (2007), by the CNRS programme Amazonie II (2008–2011), and by the Agence Nationale de la Recherche programme blanc Études de Méthodes Inférentielles et Logiciels pour l'Évolution (EMILE) NT09-611697. This work is part of Christophe Girod’s Ph.D., who was supported by a grant from the French Ministry of Research (2007–2010). Part of this work was carried out by using the resources of the Computa-tional Biology Service Unit from the MNHN (CNRS Unité Mixte de Service 2700).
LITERATURE CITED
Abdo, Z., K. A.Crandalland P.Joyce, 2004 Evaluating the perfor-mance of likelihood methods for detecting population structure and migration. Mol. Ecol.13:837–851.
Beaumont, M. A., 1999 Detecting population expansion and decline using microsatellites. Genetics153:2013–2029.
Beaumont, M. A., 2004 Recent developments in genetic data anal-ysis: What can they tell us about human demographic history? Heredity92:365–379.
Beaumont, M. A., and B.Rannala, 2004 The Bayesian revolution in genetics. Nat. Rev. Genet.5:251–261.
Bonhomme, M., A. Blancher, S. Cuartero, L. Chikhi and B. Crouau-Roy, 2008 Origin and number of founders in an in-troduced insular primate: estimation from nuclear genetic data. Mol. Ecol.17:1009–1019.
Brooks, S., and A.Gelman, 1998 General methods for monitoring convergence of iterative simulations. J. Comput. Graph. Stat.7:
434–455.
Chikhi, L., V. C.Sousa, P.Luisi, B.Goossensand M. A.Beaumont, 2010 The confounding effects of population structure, ge-netic diversity and the sampling scheme on the detection and quantification of population size changes. Genetics 186:
983–995.
Colautti, R. I., M.Manca, M.Viljanen, H. A.Ketelaars, H.Bu¨ rgi et al., 2005 Invasion genetics of the Eurasian spiny waterflea: evidence for bottlenecks and gene flow using microsatellites. Mol. Ecol.14:1869–1879.
Comps, B., D.Go¨ möry, J.Letouzey, B. Thie´ bautand R. J. Petit, 2001 Diverging trends between heterozygosity and allelic rich-ness during postglacial colonization in the European Beech. Genetics157:389–397.
Cornuet, J. M., and G.Luikart, 1996 Description and power anal-ysis of two tests for detecting recent population bottlenecks from allele frequency data. Genetics144:2001–2014.
Cornuet, J.-M., F. Santos, M. A. Beaumont, C. P. Robert, J.-M. Marinet al., 2008 Infering population history with DIY ABC: a user-friendly approach to Approximate Bayesian Computation. Bioinformatics24:2713–2719.
Dib, C., S.Faure´, C.Fizames, D.Samson, N.Drouotet al., 1996 A comprehensive map of the human genome based on 5,264 mi-crosatellites. Nature380:152–154.
Drummond, A., and A.Rambaut, 2007 BEAST: Bayesian evolution-ary analysis by sampling trees. BMC Evol. Biol.7:214.
Ellegren, H., 2000 Microsatellite mutations in the germline: impli-cations for evolutionary inference. Trends Genet.16:552–558. Ellegren, H., 2004 Microsatellites: simple sequences with complex
evolution. Nat. Rev. Genet.5:435–445.
Elmer, K. R., C.Reggio, T.Wirth, E.Verheyen, W. Salzburger et al., 2009 Pleistocene desiccation in East Africa bottlenecked but did not extirpate the adaptive radiation of Lake Victoria haplochromine cichlid fishes. Proc. Natl. Acad. Sci. USA106:
13404–13409.
Emerson, B. C., E.Paradisand C. Thebaud, 2001 Revealing the demographic histories of species using DNA sequences. Trends Ecol. Evol.16:707–716.
Estoup, A., I. J.Wilson, C.Sullivan, J.-M.Cornuetand C.Moritz, 2001 Inferring population history from microsatellite and en-zyme data in serially introduced cane toads,Bufo marinus. Genet-ics159:1671–1687.
Excoffier, L., G.Lavaland S.Schneider, 2005 Arlequin (version 3.0): an integrated software package for population genetics data analysis. Evol. Bioinform. Online1:47–50.
Felsenstein, J., 1992 Estimating effective population size from samples of sequences: inefficiency of pairwise and segregating sites as compared to phylogenetic estimates. Genet. Res. 59:
139–147.
FitzSimmons, N. N., 1998 Single paternity of clutches and sperm storage in the promiscuous green turtle (Chelonia mydas). Mol. Ecol.7:575–584.
Frankham, R., D. A.Briscoeand J. D.Ballou, 2002 Introduction to Conservation Genetics. Cambridge University Press, New York. Garza, J. C., and E. G.Williamson, 2001 Detection of reduction in
population size using data from microsatellite loci. Mol. Ecol.10:
305–318.
Gelman, A., J. B.Carlin, H. S.Sternand D. B.Rubin, 1995 Bayesian Data Analysis. Chapman & Hall, London.
Gelman, A., J. B.Carlin, H. S.Sternand D. B.Rubin, 2004 Bayesian Data Analysis.Chapman & Hall/CRC, New York.
Gonser, R., P. Donnelly, G. Nicholson and A. Di Rienzo, 2000 Microsatellite mutations and inferences about human de-mography. Genetics154:1793–1807.
Griffiths, R. C., and S.Tavare´, 1994 Sampling theory for neutral alleles in a varying environment. Philos. Trans. R. Soc. Lond.344:
403–410.
Hastings, W. K., 1970 Monte Carlo sampling methods using Mar-kov chains and their applications. Biometrika57:97–109. Hein, J., M. H.Schierupand C.Wiuf, 2005 Gene Genealogies,
Hey, J., and R.Nielsen, 2004 Multilocus methods for estimating population sizes, migration rates and divergence time, with ap-plications to the divergence of Drosophila pseudoobscura and D. persimilis.Genetics167:747–760.
Hey, J., and R. Nielsen, 2007 Integration within the Felsenstein equation for improved Markov chain Monte Carlo methods in population genetics. Proc. Natl. Acad. Sci. USA104:2785–2790. Hu, F. S., A. Hampe and R. J. Petit, 2009 Paleoecology meets genetics: deciphering past vegetational dynamics. Front. Ecol. Environ.7:371–379.
Hufbauer, R. A., S. M. Bogdanowicz and R. G. Harrison, 2004 The population genetics of a biological control introduc-tion: mitochondrial DNA and microsatellite variation in native and introduced populations ofAphidus ervi, a parasitoid wasp. Mol. Ecol.13:337–348.
Jacobsen, B. H., M. M. Hansen and V. Loeschcke, 2005 Mi-crosatellite DNA analysis of northern pike (Esox luciusL.) popu-lations: insights into the genetic structure and demographic history of a genetically depauperate species. Biol. J. Linn. Soc.
84:91–101.
Jeffreys, H., 1961 Theory of Probability, Ed. 3. Oxford University Press, Oxford.
Kass, R. E., and A. E.Raftery, 1995 Bayes factors. J. Am. Stat. Assoc. 90:773–795.
Kuhner, M. K., 2006 Lamarc 2.0: maximum-likelihood and Bayesian estimation of population parameters. Bioinformatics22:768–770. Laval, G., and L. Excoffier, 2004 SIMCOAL 2.0: a program to simulate genomic diversity over large recombining regions in a subdivided population with a complex history. Bioinformatics
20:2485–2487.
Lawton-Rauh, A., 2008 Demographic processes shaping genetic variation. Curr. Opin. Plant Biol.11:103–109.
Leblois, R., and M. Slatkin, 2007 Estimating the number of founder lineages from haplotypes of closely linked SNPs. Mol. Ecol.16:2237–2245.
Leblois, R., A. Estoup and R. Streiff, 2006 Genetics of recent habitat contraction and reduction in population size: Does iso-lation by distance matter? Mol. Ecol.15:3601–3615.
Loader, C., 1999 Local Regression and Likelihood. Springer-Verlag, New York.
Luikart, G., and J. M.Cornuet, 1998 Empirical evaluation of a test for identifying recently bottlenecked populations from allele fre-quency data. Conserv. Biol.12:228–237.
Luikart, G., F. W.Allendorf, J.-M.Cornuetand W. B.Sherwin, 1998 Distortion of allele frequency distribution provides a test for recent population bottlenecks. J. Hered.89:238–247. Metropolis, N., A. W. Rosenbluth, M. N. Rosenbluth, A. H.
Tellerand E.Teller, 1953 Equations of state calculations by fast computing machines. J. Chem. Phys.21:1087–1092. Milton, K., J. D.Lozierand E. A.Lacey, 2009 Genetic structure of
an isolated population of mantled howler monkeys (Alouatta palliata) on Barro Colorado Island, Panama. Conserv. Genet.
10:347–358.
Nei, M., 1978 Estimation of average heterozygosity and genetic distance from a small number of individuals. Genetics89:583– 590.
Nettel, A., R. S.Doddand Z.Afzal-Rafii, 2009 Genetic diversity, structure, and demographic change in tanoak,Lithocarpus densiflorus (Fagaceae), the most susceptible species to sudden oak death in California. Am. J. Bot.96:2224–2233.
Nielsen, R., and M.Beaumont, 2009 Statistical inferences in phy-logeography. Mol. Ecol.18:1034–1047.
Nordborg, M., 2007 Coalescent theory, pp. 843–877 inHandbook of Statistical Genetics,Ed. 3, edited byD.Balding, M.Bishopand C.Cannings. John Wiley & Sons, Chichester, UK.
Peter, B. M., D.Wegmannand L.Excoffier, 2010 Distinguishing between population bottleneck and population subdivision by a Bayesian model choice procedure. Mol. Ecol.19:4648– 4660.
Plummer, M., N.Best, K.Cowlesand K.Vines, 2006 Coda: output analysis and diagnostics for MCMC. R News6:7–11.
Pope, L. C., A.Estoupand C.Moritz, 2000 Phylogeography and population structure of an ecotonal marsupial,Bettongia tropica, determined using mtDNA and microsatellites. Mol. Ecol.9:2041– 2053.
R Development Core Team, 2009 R: A Language and Environment for Statistical Computing. R Foundation for Statistical Computing, Vienna.
Rousset, F., and R. Leblois, 2007 Likelihood and approximate likelihood analyses of genetic structure in a linear habitat: per-formance and robustness to model mis-specification. Mol. Biol. Evol.24:2730–2745.
Schneider, S., and L.Excoffier, 1999 Estimation of past demo-graphic parameters from the distribution of pairwise differences when the mutation rates vary among sites: application to human mitochondrial DNA. Genetics152:1079–1089.
Spencer, C. C., J. E.Neigeland P. L.Leberg, 2000 Experimental evaluation of the usefulness of microsatellite DNA for detecting demographic bottlenecks. Mol. Ecol.9:1517–1528.
Storz, J. F., and M. A. Beaumont, 2002 Testing for genetic evi-dence of population expansion and contraction: an empirical analysis of microsatellite DNA variation using a hierarchical Bayesian model. Evolution56:154–166.
Storz, J. F., M. A. Beaumont and S. C. Alberts, 2002 Genetic evidence for long-term population decline in a savannah-dwelling primate: inferences from a hierarchical Bayesian model. Mol. Biol. Evol.19:1981–1990.
Strasburg, J. L., and L. H.Rieseberg, 2010 How robust are‘‘ iso-lation with migration’’ analyses to violations of the IM model? A simulation study. Mol. Biol. Evol.27:297–310.
Tavare´, S., 1984 Line-of- descent and genealogical processes, and their applications in population genetics models. Theor. Popul. Biol.26:119–165.
Tavare´, S., D. J. Balding, R. C. Griffiths and P. Donnelly, 1997 Inferring coalescence times from DNA sequence data. Genetics145:505–518.
Wakeley, J., R. Nielsen, S. N. Liu-Cordero and K. Ardlie, 2001 The discovery of single-nucleotide polymorphisms—and inferences about human demographic history. Am. J. Hum. Genet.69:1332–1347.
Williamson-Natesan, E. G., 2005 Comparison of methods for de-tecting bottlenecks from microsatellite loci. Conserv. Genet. 6:
551–562.
Wilson, I. J., and D. J.Balding, 1998 Genealogical inference from microsatellite data. Genetics150:499–510.
Wilson, I. J., M.Wealeand D. J.Balding, 2003 Inferences from DNA data: population histories, evolutionary processes and foren-sic match probabilities. J. R. Stat. Soc. Ser. A166:155–188. Wirth, T., F.Hildebrand, C.Allix-Be´guec, F.Wo¨ lbeling, T.Kubica
et al., 2008 Origin, spread and demography of theMycobacterium tuberculosiscomplex. PLoS Pathog.4:e1000160.
GENETICS
Supporting Information
http://www.genetics.org/cgi/content/full/genetics.110.121764/DC1
Inferring Population Decline and Expansion From Microsatellite Data:
A Simulation-Based Evaluation of the Msvar Method
Christophe Girod, Renaud Vitalis, Raphaël Leblois and Hélène Fréville
Copyright
Ó
2011 by the Genetics Society of America
C. Girod et al.
2 SI
FILE S1
Supporting Methods
The version 1.3 of MSVAR provides separate estimates for N0, N1, μ and Ta (STORZ and BEAUMONT 2002). This
implementation of BEAUMONT’s (1999) method, available at http://www.rubic.rdg.ac.uk/~mab/stuff/, relies upon a hierarchical model where demographic and mutational parameters are allowed to vary among loci. Hence, the set of parameters of interest is given by {N0i, N1i ,Tai, μi}i = 1,k for k loci and the prior distributions of these parameters depend upon hyper-prior distributions. Priors and hyper-priors were specified following STORZ andBEAUMONT (2002). For each
locus, the prior distributions of the model parameters were assumed to be log-normal distributions, each with means (on a log10 scale) of M {MN0, MN1, MTa, Mμ} and standard deviations (SDs) of V {VN0, VN1, VTa, Vμ}. Hyper-prior distributions
for the means M were themselves assumed to be normal distributions with means N0, N1, Ta,μ and SDsN0,N1,Ta,μ.
Prior means for the current and ancestral population sizes were set equal to the log10-transformed values N0 = N1 = 3, which amounts to consider population contraction and expansion as equally likely. To allow for uncertainty in these estimates, and to avoid a strong effect of the prior specification, we considered prior distribution with large SDs by setting N0 = N1 = 4. The prior mean for the time since the population started changing in size was set equal to 500 generations, giving Ta = 2.7. The SD of the mean around the time of demographic change, Ta = 3, was chosen so that more recent and more ancient dates were also supported. In order to test whether the method could retrieve information on the mutation rate from the data, we chose a relatively flat prior on the mean mutation rate per generation with μ= -4 and μ= 2. Last, the
hyper-prior distributions for the SDs V were assumed to be normal distributions truncated at zero with means N0 =N1 =Ta =μ
= 0 and SDs N0 =N1 =Ta =μ = 0.5. The parameter values reported in the main text correspond to the mean of N0, N1, Ta
C. Girod et al. 3 SI
Supplementary Figure S1
N0Ta = 10
N1 Ta
N1 = 1,000
N1 = 10,000
N1 = 100,000
T = 50a Ta = 100 Ta = 500 Ta = 10 T = 50a Ta = 100 Ta = 500 Ta = 10 Ta = 50 Ta = 100 Ta = 500
Population decline
-10
-5 0 5 10
-10
-5 0 5 10
-10
-5 0 5 10
-10
-5 0 5 10
-10
-5 0 5 10
-10
-5 0 5 10
-10
-5 0 5 10
-10
-5 0 5 10
-10
-5 0 5 10
*%&)$*%$
,)- *) % #
%
'('.*)$.+)$.*))
C. Girod et al. 4 SI
Supplementary Figure S2
N0Ta = 10
N1 Ta
N0 = 1,000
N0 = 10,000
N0 = 100,000
Ta = 50 T = 100a Ta = 500 T = 10a Ta = 50 Ta = 100 Ta = 500 Ta = 10 Ta = 50 Ta = 100 Ta = 500
Population expansion
-10
-5 0 5 10
-10
-5 0 5 10
-10
-5 0 5 10
-10
-5 0 5 10
-10
-5 0 5 10
-10
-5 0 5 10
-10
-5 0 5 10
-10
-5 0 5 10
-10
-5 0 5 10
,&' *%+ " &
% .*/ +*&$
&
()(0+*%0-*%0+**
0-**)&#!.*/
C. Girod et al. 5 SI
Supplementary Figure S3
θ0
Ta = 10
θ1 tf
N1 = 1,000
N1 = 10,000
N1 = 100,000
Ta = 50 Ta = 100 Ta = 500 Ta = 10 T = 50a Ta = 100 Ta = 500 Ta = 10 Ta = 50 Ta = 100 Ta = 500
Population decline
-10
-5 0 5 10
-10
-5 0 5 10
-10
-5 0 5 10
-10
-5 0 5 10
-10
-5 0 5 10
-10
-5 0 5 10
-10
-5 0 5 10
-10
-5 0 5 10
-10
-5 0 5 10
+%&)$*%$
-). *) % #
%
'('/*)$/,)$/*))
/,))(%"!-).
C. Girod et al. 6 SI
Supplementary Figure S4
θ0
Ta = 10
θ1 tf
N0 = 1,000
N0 = 10,000
N0 = 100,000
Ta = 50 Ta = 100 Ta = 500 Ta = 10 T = 50a Ta = 100 Ta = 500 Ta = 10 Ta = 50 Ta = 100 Ta = 500
Population expansion
-10
-5 0 5 10
-10
-5 0 5 10
-10
-5 0 5 10
-10
-5 0 5 10
-10
-5 0 5 10
-10
-5 0 5 10
-10
-5 0 5 10
-10
-5 0 5 10
-10
-5 0 5 10
,&'*%+"&%
.*/ +* & $
&
()(0+*%0-*%0+**
0-**)&#!.*/
C. Girod et al. 7 SI
-2 0 2 4 6 8
-8 -6 -4 -2 0 2
0 2 4 6 8 10
-8 -6 -4 -2 0 2
-2 0 2 4 6 8
-2 0 2 4 6 8
Current population size (N0) Ancestral population size (N1)
Time since the ev
ent (
Ta
)
Mutation rate (
μ
)
Current population size (N0)
Mutation rate (
μ
)
A. B. C.
Supplementary Figure S5
& ! "# $ "#
%"#$
C. Girod et al. 8 SI
Supplementary Figure S6
θ0
SMM
θ1 tf
Stable population
P
opulation decline
P
opulation expansion
GSM1 GSM2
-10
-5 0 5 10
-10
-5 0 5 10
-10
-5 0 5 10
-10
-5 0 5 10
-10
-5 0 5 10
-10
-5 0 5 10
-10
-5 0 5 10
-10
-5 0 5 10
-10
-5 0 5 10
p = 0.00 p = 0.22 p = 0.74
SMM GSM1 GSM2
p = 0.00 p = 0.22 p = 0.74
SMM GSM1 GSM2
p = 0.00 p = 0.22 p = 0.74
3)+ .'/ ,# .7/7131'72..-'
,# . 7 /..'/ 7/.'... 7 2..-' $ ,# . 7 /.'...'/ 7/.. 7
2..-! ) ' 2..-! " 5.6 " /. )
& "! ! ) ! "! ' !% ! * ! ( 7 .).. , #
! '-' 7.)00, & #'/-'7.)41
, & #'0-)%# 5.6
! ! ) !!& " !"! )