HIGHLIGHTED ARTICLE
| MULTIPARENTAL POPULATIONS
Detection of Epistasis for Flowering Time Using
Bayesian Multilocus Estimation in a Barley
MAGIC Population
Boby Mathew,*,1Jens Léon,* Wiebke Sannemann,†and Mikko J. Sillanpää‡,§
*Institute of Crop Science and Resource Conservation, University of Bonn, 53115, Germany,†Plant Breeding, Martin Luther University of Halle-Wittenberg, 06120, Germany, and‡Department of Mathematical Sciences and§Biocenter Oulu, University of Oulu, FIN-90014, Finland ORCID IDs: 0000-0001-8841-6446 (B.M.); 0000-0002-6514-3112 (J.L.); 0000-0003-2808-2768 (M.J.S.)
ABSTRACTGene-by-gene interactions, also known as epistasis, regulate many complex traits in different species. With the availability of low-cost genotyping it is now possible to study epistasis on a genome-wide scale. However, identifying genome-wide epistasis is a high-dimensional multiple regression problem and needs the application of dimensionality reduction techniques. Flowering Time (FT) in crops is a complex trait that is known to be influenced by many interacting genes and pathways in various crops. In this study, we successfully apply Sure Independence Screening (SIS) for dimensionality reduction to identify two-way and three-way epistasis for the FT trait in a Multiparent Advanced Generation Inter-Cross (MAGIC) barley population using the Bayesian multilocus model. The MAGIC barley population was generated from intercrossing among eight parental lines and thus, offered greater genetic diversity to detect higher-order epistatic interactions. Our results suggest that SIS is an efficient dimensionality reduction approach to detect high-order interactions in a Bayesian multilocus model. We also observe that many of ourfindings (genomic regions with main or higher-order epistatic effects) overlap with known candidate genes that have been already reported in barley and closely related species for the FT trait.
KEYWORDSMultiparent Advanced Generation Inter-Cross (MAGIC); multiparental populations; three-way epistatic interactions; sure dependence screening; multilocus association model; multiparental populations; MPP
E
PISTASIS can be defined as the presence of genetic in-teraction between two or more loci in their joint effect on the phenotype. Epistasis is likely to play a crucial role in the genetic variation underlying many complex traits in plants, animals, and humans. Even though the role of epistasis remains controversial, many studies have been devoted to the detection of epistasis in complex traits (e.g., Shimomuraet al.2001; Mäki-Tanila and Hill 2014; Huang and Mackay 2016; Paixão and Barton 2016).
Traditionally, quantitative trait loci (QTL) mapping studies use biparental populations to identify QTL specific to the trait
of interest. However, the precision of biparental QTL mapping is low due to the limited number of recombination events (Huanget al.2012). Recently, Cavanaghet al.(2008) pro-posed a Multiparent Advanced Generation Inter-Cross (MAGIC) strategy to improve power and precision in QTL mapping. Subsequently, many studies reported QTL for var-ious traits identified using MAGIC populations ofArabidopsis thaliana(Koveret al.2009), rice (Bandilloet al.2013), wheat (Huang et al. 2012; Mackay et al. 2014), and barley (Sannemannet al.2015) for different traits. So far, studies on epistasis from MAGIC populations are rare, despite the obvi-ous benefits provided by multiparental populations (Ehrenreich 2017).
The single-locus model is widely used for association mapping of both quantitative and qualitative traits. However, most complex traits are controlled by multiple genes, and genome-wide association studies (GWAS) using a single-locus model may lead to less statistical power and biased effect estimates. To overcome this, various multilocus methods
Copyright © 2018 by the Genetics Society of America doi:https://doi.org/10.1534/genetics.117.300546
Manuscript received September 13, 2017; accepted for publication December 12, 2017.
Supplemental material is available online atwww.genetics.org/lookup/suppl/doi:10. 1534/genetics.117.300546/-/DC1.
1Corresponding author: Institute of Crop Science and Resource Conservation (INRES),
including Bayesian least absolute shrinkage and selection op-erator (BLASSO; Yi and Xu 2008), Elastic-Net (Cho et al.
2010), empirical Bayes (Leyland and Davies 2005), and varia-tional Bayes (Logsdon et al. 2010) methods have been pro-posed. The general difficulty of multilocus methods is the collinearity (interdependence) of the marker data. These same methods can also be applied to estimate the two-way epistatic effects of QTL if the set of markers is extended to include all possible pairwise interaction terms as pseudomarkers (e.g., Xu 2007; Li and Sillanpää 2012; Kärkkäinenet al.2015). Although many methods are available, two-way epistasis detection in GWAS is still challenging because of the (i) huge number of possible pairwise interaction terms, (ii) small sample sizes, and (iii) the presence of many single-nucleotide polymorphisms (SNPs) with quite small marker effects. Quantifying three-way epistasis is even more challenging due to the computational complexity (screening through all possible combinations) and mathematical challenges (to separate the additive main effects and the higher-order interactions), and the requirement to have enough samples in each subgroup.
Modeling epistasis is a high-dimensional regression prob-lem, and approaches like multifactor-dimensionality reduc-tion (MDR) (Ritchie et al. 2001) and sure independence screening (SIS) (Fan and Lv 2008) have been proposed to reduce the dimensionality of the search space in these high-dimensional regression models. The MDR approach is mainly used to detect gene-by-gene interactions in case control stud-ies (e.g., Ritchieet al.2001; Choet al.2004; Moore 2004). SIS operates by ordering SNPs according to their marginal correlation with the trait and selects a given number of best candidate SNPs. In a recent study, Kärkkäinenet al.(2015) used SIS to preselect the variables for the Bayesian LASSO estimation of two-way epistasis in a multilocus association model [see also the approach of Liet al.(2014)].
In Bayesian variable selection methods, hyper-parameter selection and study of the sensitivity of results to those choices are needed. To avoid such tedious processes and to make our algorithm more automated, we decided to use the method from Xu (2003) for variable selection. The method proposed by Xu (2003) specifies a strongly informative prior, which shrinks the effects of unimportant SNPs toward zero during estimation and therefore produces a sparse representation of the model. This method is also called“automatic relevance determination,”because it expresses ignorance with respect to scale and it is parameter-free (MacKay et al. 1994; Figueiredo 2003; Neal 2012), in addition to also being closely related to relevant vector machines (Tipping 2001). Flowering Time (FT) is a key complex trait of interest in agronomic crops and many studies have reported pairwise gene-by-gene interactions affecting the FT in different crops (e.g., Caicedoet al.2004; Durandet al.2012; Maureret al.
2015). Unlike offspring from biparental crossing, the MAGIC population is the result of intercrossing among multiple (eight) founder lines and thus offers greater genetic diversity to detect higher-order epistatic interactions. Therefore, in this study, we used the eight-parent MAGIC barley population
(Sannemannet al.2015) to report the main, two-way- and three-way-interacting QTL for the FT trait identified using the Bayesian multilocus association model.
Materials and Methods
In our analysis, we closely follow the method from Kärkkäinen
et al.(2015), where analysis is done in multiple steps so that residuals obtained from the previous analysis step are taken as phenotypes of the next step. Kärkkäinenet al.(2015) per-formed the dimension-reducing step in the search space of all possible pairwise interaction terms by applying the SIS algorithm, effectively reducing the original 280 million dis-crete predictors to 5000 important candidates, making the problem more suitable to multilocus modeling. The main dif-ferences between Kärkkäinenet al.(2015) and our approach here are the following. (i) They used a maximuma posteriori
probability estimation algorithm of extended Bayesian LASSO while we used Bayesian analysis and Markov chain Monte Carlo (MCMC) sampling introduced by Xu (2003) [see also Hoti and Sillanpää (2006) and Bauer et al.
(2009)]. (ii) Instead of directly using residuals, we ran sev-eral MCMC chains and average mean effect coefficients over multiple chains to minimize influence of collinearity between markers in the analysis, before forming residuals. (iii) In addition to the pairwise epistasis analysis (running two rounds of the algorithm), we also examined three-way (higher order) epistasis (running three rounds of the algo-rithm). (iv) Finally, instead of receiver operating characteris-tic curves (which do not need any specific method to judge QTL), we applied the following decision rule: the interactions that “popped up” in our analysis needed to correspond to those found in the literature or show similarity after Basic Local Alignment Search Tool (BLAST) search to findings in otherflowering plants before we regarded them as real sig-nals (i.e., QTL) [see Weiet al.(2014)]. However, note that this rule may cause some bias to the results if it is applied for traits that have not been broadly studied in any species before. Following the innovation in Kärkkäinenet al.(2015), we use the modified version of the SIS method of Fan and Lv (2008), where correlations between a single pseudomarker and the phenotype are computed one at a time and only a few highest ones are stored in the memory. This speeds up the computation process and saves memory because all possible pairwise and three-way pseudomarkers are not retained in the memory.
Here, we shortly describe the model and the algorithm. Let yi fori¼1;2::;nrepresent the phenotypic value of theith individual in a MAGIC population withnobservations, then the multilocus association model can be defined as:
yi¼b0þ
Xp
j¼1
xijbjþei: (1)
jcoded as 1 for the genotypeAAand21 for theBB;bjis QTL effect associated with marker j, and ei corresponds to the residual, following a normal distribution aseiNð0;s2eÞ:
With genome-wide marker information, the number of markers (p) often exceeds the number of observations (n). In such cases, Equation 1 can become an oversaturated model and the ordinary least-squares approach will not provide a unique solution. So variable selection and shrinkage estima-tion are required to obtain a unique soluestima-tion for Equaestima-tion 1 and the Bayesian shrinkage approach is one alternative. A common assumption in shrinkage models is that most of the regression coefficients (bj) have zero values. In order to include pairwise interactions, Equation 1 can be extended to
yi¼b0þ
Xp
j¼1
xijbjþX
p
k,l
xikxilbklþei; (2)
where the regression coefficientbklis the pairwise interaction effect of locikandl. As the number of loci increases, simul-taneous estimation of main effects (bj) and the interaction effects (bkl) from Equation 2 becomes computationally chal-lenging. Due to the extremely large parameter space of Equa-tion 2, one needs to apply dimensionality reducEqua-tion for the variables to make the use of the multilocus epistatic model practical. Therefore, we used SIS, which is based on the marginal correlation with the trait, to select only a subset of variables to be included in the multilocus epistasis associ-ation model. For SIS, wefirst created the pseudomarker for each pair of SNPs and calculated the correlation with the response variable, then we only retained thedhighly corre-lated pseudomarkers for the epistasis search. When variable selection is applied to both the marker main effects and in-teraction effects (bkl) in Equation 2, the interaction effects may be masked from the main effects (Sillanpää 2009; Kärkkäinen et al. 2015). Therefore, we first estimated the main effects, followed by the interaction effects that were estimated from the residual-outcome analysis (for details, see below).
We also applied SIS to search for three-locus interactions. For that,first we created the pseudomarkers for a set of three SNPs and calculated the correlation with the response vari-able; then, we retained thethighly correlated pseudomarkers for the three-way epistasis search. To prevent masking of the interaction effect, we estimated the main effects and two-way and three-way interaction (pseudomarker) effects separately using Equation 1.
The procedure for the two- and three-way epistasis searches can be summarized as follows:
1. Estimate the marker main effects bjwith the multilocus model.
2. Calculate residuals (E1i) asE1i¼yi2
Pp
j¼1Xijbj: 3. Use SIS to select the most correlated d pseudomarkers
(corresponding to two-way interaction) X1ij, to the residualE1i:
4. Estimate the two-way interaction effects (b1j) with the multilocus model usingE1ias the response variable. 5. Calculate the epistasis residuals (E2i) as
E2i¼E1i2
Pd
j¼1X1ijb1j:
6. Apply SIS to select the most correlated t pseudomarkers (corresponding to three-way interaction) to the residualE2i. 7. Estimate the three-way interaction effects (b2j) with the
multilocus model usingE2ias the response variable.
Here, in steps 2 and 6, the estimatesbj;b1jwere calculated as the average overfive different MCMC chains.
Bayesian estimation requires the prior specification for the unknown parameters in the Equation 1. Following Xu (2003), the marker effects were assigned a normal distribution with mean zero and effect-specific variances2
j:For the effect-specific hyper-parameters we assigned Jeffreys’ scale invariant prior, thus,pðs2
jÞ}1=s2jforj¼1;. . .p:The prior density for the mean b0;ispðb0Þ}1:Letb¼ fbjgands2¼ fs2jgforj¼1;2;. . .p be the unknown model parameters; then, the likelihood of the observation vectoryis
pyjb;s2}s202n=23exp 2 1
2s2 0
Xn
j¼1
yi2b02
Xp
j¼1
xijbj
!2
:
(3)
By Bayes theorem, the joint posterior distribution of the model parameters is proportional to
pb;s2y}pyjb;s2pb;s2: (4)
We applied Gibbs sampling (Geman and Geman 1984) to draw samples from the above joint posterior distribution. See Xu (2003) for more details about the implementation of the Gibbs sampling algorithm. Program codes developed during the project are publicly available and listed in Supple-mental Material,File S1,File S2,File S3,File S4, andFile S5.
Data set
To validate our approach, we analyzed a barley MAGIC double-haploid (DH) population of 533 lines using the multilocus model for identifying the two- and three-way epistatic interactions. This population was derived from an eight-way cross and the pheno-typic data were collected from the research station“Poppelsdorf” of the University of Bonn, Germany. We used the FT phenotype, which was collected during the year 2011, with two replications and we considered the mean over the replications for the anal-ysis. The experiment was arranged in an augmented design and the FT was measured in days until heading [see Sannemann
et al.(2015) for more details about the experiment]. The pop-ulation was genotyped using an Illumina 9 k iSelect SNP chip from TraitGenetics GmbH. After discarding the monomorphic markers,3413 SNPs were available for the analysis.
Data availability
Results
We estimated the main and interacting QTL in the barley MAGIC DH population using the multilocus model. Of the 3413 SNP markers available for analysis, 1082 SNPs were duplicated (i.e., pairwise marker correlation was nearly 1). During the initial MCMC analysis, we found that if“signifi -cant”SNPs are duplicated, Bayesian MCMC-based variable selection will select only one SNP among those duplicated ones. However, in the next MCMC run it may pick another SNP among those duplicated SNPs. High collinearity be-tween markers generally weakens QTL signals by attributing arbitrary parts of every signal to the duplicated marker (e.g., Pasanenet al.2015). Therefore, when we take the average over different MCMC runs there is a possibility that the effect may cancel out and the marker may not appear to be a pos-itivefinding. To avoid this ambiguity, we decided to remove those duplicated SNPs and the remaining 2331 markers were used for thefinal analysis. For the marker effect estimation, we usedfive different MCMC chains (with different random number generator), each having 50,000 iterations with a burn-in period of 10,000 iterations, and only picked markers that were constantly selected in all chains as QTL. We exam-ined the convergence of the MCMC chain using the trace plots and they showed rapid convergence; therefore, we de-cided to use 40,000 iterations to obtain the posterior esti-mates in each case.
Main effect
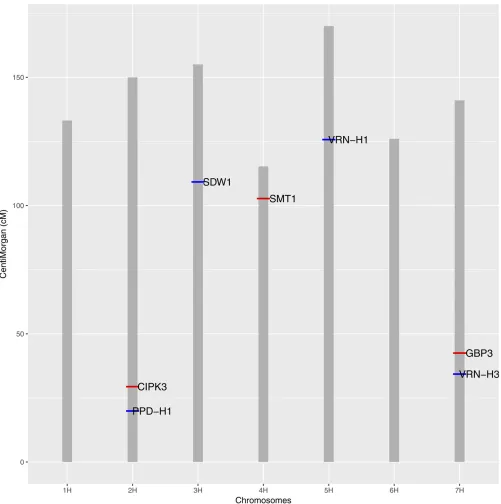
FT is a well-studied complex trait and many candidate genes are already known in various plant species. Most of our identified QTL were close to the already reported candidate genes in barley. However, some of the main and interacting QTL regions are not associated with any reported candidate genes in barley. So, we looked into upstream and downstream regions of the putative QTL and performed a BLAST search to identify closest homologous genes for FT in other plant spe-cies, and thosefindings are reported here for the unknown QTL region. The length of the upstream and downstream regions to be studied were decided based on the observed linkage disequilibrium (LD) (r2.0:8) around the putative QTL. Main effect QTL for this population were already reported by Sannemann et al. (2015) using a single-locus model with binary and haplotype approaches. Unlike the previous study, we used a Bayesian multilocus association model and our results were close to those obtained with the haplotype approach by Sannemannet al.(2015). We found that four main effect QTL were common to both studies. In addition, we found evidence in favor of three more main effect QTL. Among these seven identified QTL, four were already known to be involved in FT regulation and reported by many other studies in barley (Wanget al.2010; Maureret al.2015). The four known regions of major FT genes are: (i) the region 19.9 cM on chromosome 2H with the candidate gene pseu-doresponse regulator (PPD-H1), which provides adaptation to photoperiod in barley (Turneret al.2005); (ii) location
109.20 cM on chromosome 3H with a candidate semidwarf
SDW1gene (Kuczyńskaet al.2013); (iii) region 125.76 cM on 5H with the candidate vernalization (VRN-H1) gene (von Zitzewitzet al.2005); and (iv) location 34.34 on 7H with the vernalization (VRN-H3) gene (Yanet al.2006).
We also detected two clear QTL signals on chromosome 2H at location 29.01 cM [this region has already been reported by Alqudah et al.(2016)] and 33.49 cM. LD analysis for this region showed that these two markers are in high LD, and so we consider this as one QTL region. Since this region has not been previously implicated in FT regulation, we obtained the overlapping protein sequence at 29.01 cM on 2H from Ensembl Plants (www.plants.ensembl.org) for the barley ge-nome and performed a protein BLAST (pBLAST) search against the National Center for Biotechnology Information protein database (https://www.ncbi.nlm.nih.gov/protein/). The pBLAST showed.92% similarity with the gene “CBL-interacting protein kinase 3 (CIPK3)” in various flowering plants. Kimet al.(2003) showed thatCIPK3regulates abscisic acid regulation inArabidopsis. Abscisic acid is known to be involved in variety of physiological processes in plants like seed dormancy (González-García et al. 2003), leaf senes-cence (Zhao et al.2016), and responses to abiotic stresses (Fujii and Zhu 2009). We also performed a pBLAST search as mentioned above for the other two unknown regions, 102.7 cM on 4H and 42.49 cM on 7H, which were found as QTL in our analysis. pBLAST search for the region 102.7 cM on 4H showed high similarity with the gene “Cycloartenol-C-24-methyltransferase (SMT1)” in different flowering plants.
SMT1plays a key role in sterol biosynthesis, and studies have already reported the influence of sterols on plant develop-ment (Carland et al.2010), embryogenesis (Clouse 2000), and hormone signaling (Lindseyet al.2003) inArabidopsis. We also calculated the LD for the region between the two QTL on 7H and found that they are not in LD. The associated SNP at 42.49 cM on 7H was located in the gene “GAMYB -binding protein (GBP3),”and Gubleret al.(1995) previously identified gibberellin-specific transcriptional regulator
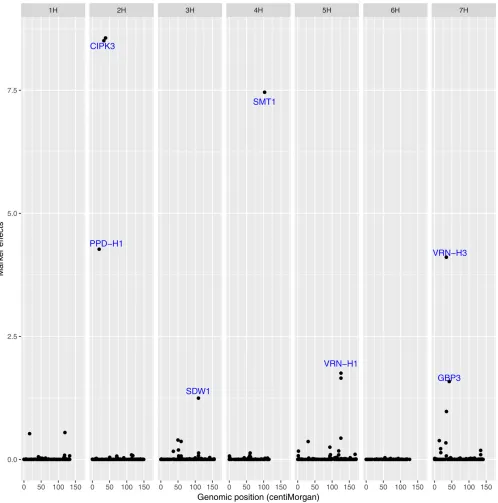
GAMYBin barley aleurone cells. Kanekoet al.(2004) reported that mutations in the riceGAMYBgene retard the growth and development of anthers. Millar and Gubler (2005) reported thatA. thaliana genesMYB33andMYB65, which have high sequence similarity to the barleyGAMYBgene, are regulated by microRNA, and they facilitate anther development. Thus, we believe that this gene is involved in the FT regulation of the MAGIC population. Figure 1 shows the main effect QTL on the corresponding chromosomes. Additionally, we also show the marker effects estimated using a Bayesian multilocus associa-tion model in Figure 2, which indicates that the model can clearly separate the QTL signals in the data.
Two-way epistatic interactions
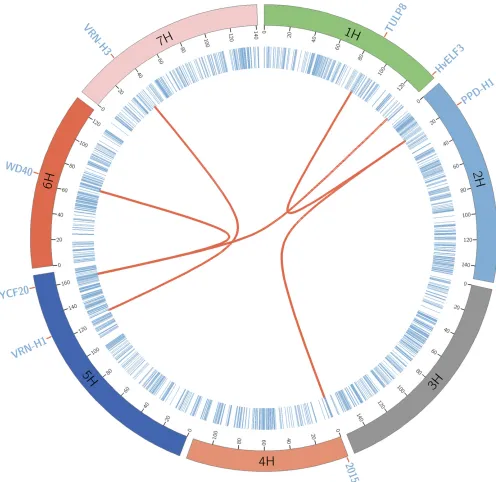
including the main effect regions on 2H at 29.01 and 33.49 cM, suggesting that these regions are involved in the same in-teraction. However, due to the high LD between those markers, we consider them to be spurious epistatic signals due to LD rather than any real epistaticfinding (cf. Woodet al.
2014; Kärkkäinen et al. 2015). The photoperiod response gene [PPD-H1 region (19.9 cM on 2H)] was involved in two epistasis interactions, with the region 1.93 cM on 4H and 87.87 cM on H1. Here, the region2 cM on 4H has been
interactions, one with the region 130.01 cM on H1 and the other66.78 cM on 6H chromosome. pBLAST search for the overlapping gene on region 161.80 cM on 5H showed.90% similarity with the gene“ycf20-like protein (ycf20)”in other flowering plants. InArabidopsis, it is known that theycf20 -like gene affects the thermal dissipation of excess absorbed light (Jung and Niyogi 2010). The region130.01 cM on H1 is known to have the candidate barley clock geneHvELF3, which influences the flowering pathway and leads to the early flowering phenotype in barley (Zakhrabekovaet al.
2012). A pBLAST search for region 66.78 cM on 6H showed high similarity with the gene“tryptophan-aspartic acid (WD) repeat-containing protein”in other species, and WD repeats act as sites for protein–protein interaction inArabidopsis(Van Nocker and Ludwig 2003). QTL regions with the barley ver-nalization genes VRN-H1(125.76 cM on 5H) and VRN-H3
connected by red lines, and the chromosomes are arranged circularly with the cytobands marked in the inner ring of the plot. The circular plot was created using Circos software (Krzywinski et al.2009). Additionally, for comparison pur-poses, we also performed a standard a two-dimensional whole-genome scan using PLINK software (Purcell et al.
2007). Unlike our multilocus approach, PLINK uses a two-locus model for epistasis searching and will report all the markers that are in high LD with a putative two-way-interacting QTL region as significant markers. Therefore, the PLINK epistasis search provided many significant interaction
differences (in the Models and Methods) between the two approaches.
Three-way epistatic interactions
To detect three-way epistasis, we used a set of 1000 most-correlated pseudomarkers as predictors to explain the two-way corrected residuals in the multilocus model. We also found high collinearity among the pseudomarkers con-structed for the three-way epistasis. Therefore, after the Bayesian analysis, we additionally applied an F-test to test the significance of the three-way interaction with the null hypothesis (H0) that a particular three-way interac-tion is zero. The F-statistic was calculated by comparing model Y¼M1þM2þM3þ ðM1:M2Þ þ ðM2:M3Þ þ ðM1:
M3Þ against the alternative model Y¼M1þM2þM3þ ðM1:M2Þ þ ðM2:M3Þ þ ðM1:M3Þ þ ðM1:M2:M3Þ: Here,
Mi;i¼1;2;3 represents the trio found using the Bayesian multilocus analysis,Mi:Mjis the two-way interaction term, andM1:M2 :M3is the three-way interaction term. We used a significance level of P¼1025;to decide whether a trio of markers is significant and found three major three-way-interacting QTL.
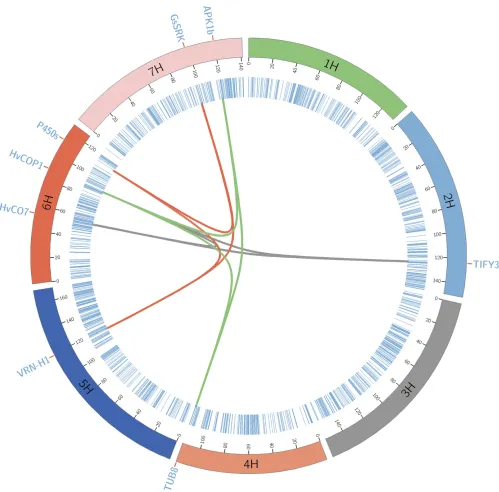
The regions on 6H at 53.75, and 88.73 and 124.29 cM on 2H, showed the most significant three-way interaction. The region53 cM on 6H is known to have the CO (CONSTANS)
gene HvCO7, and the CO (CONSTANS) gene has a crucial
role in the regulation offlowering by photoperiod in Arabi-dopsis(Griffithset al.2003), whereas the region 88.73 cM on 6H is known to have the candidate gene CONSTITUTIVELY PHOTOMORPHOGENIC1 (HvCOP1), which is required for the UV-B response inArabidopsis(Oraveczet al.2006). How-ever, on 2H at 124.29 cM, we did notfind any reported can-didate gene, and on pBLAST search we found that this region colocalizes to the gene TIFY3. This gene is involved in the jasmonate signaling pathway in different flowering plants and jasmonates play a key role inflower development (Cai
et al.2014; Yuan and Zhang 2015; Liet al.2017). In barley, the region 5H (119.8–125.8 cM), spanning VRN-H1 and PHYTOCHROME CPHYC, is known to play a crucial role in FT under long-day photoperiod (Chen et al. 2014). In our analysis region, 119 cM on 5H showed significant interaction with the region 113.24 cM on 6H and 97.30 cM on 7H. pBLAST search for the region on 6H (113.24 cM) found that this region colocalizes with the gene Cytochrome P450 (cyt P450) andcyt P450enzymes catalyze many reactions in plant metabolism (Bolwellet al.1994; Franket al.1996). Addition-ally,cyt P450enzymes are involved in the promotion offl ower-ing followower-ing vernalization (Burn et al. 1993; Dennis et al.
1996). The region on 7H at 97.30 cM showed.95% similarity with gene G-type lectin S-receptor-like serine/threonine pro-tein kinase (GsSRK), which is known to be a positive regulator of plant tolerance to salt stress (Sunet al.2013). The region 88.73 cM on 6H with the candidate gene HvCOP1 was in-volved in two significant three-way interactions. In the second significant three-way epistasis, it showed interaction with the regions on 7H (119.54 cM) and 4H at 115.22 cM. pBLAST
search for the SNP from the region 115.22 cM on 4H showed high similarity with the gene b-tubulin TUB8. Previously, Yoshikawa et al.(2003) reported anther-specific expression ofTUB8in rice. Finally, the pBLAST search for the SNP from the region 119.54 cM on 7H showed.90% similarity with the gene protein kinase 1b (APK1b) inArabidopsis. Elhaddadet al.
(2014) have shown thatAPK1bis predominantly expressed in guard cells and affects light-induced stomatal opening inArabidopsis. Figure 4 represents the genetic map of the major three-way epistatic QTLs and the chromosomes are arranged circularly with the cytobands marked in the inner ring of the plot.
Discussion
During the past decade, many statistical methods have been developed to identify epistatic interactions in GWAS. How-ever, genome-wide detection of epistasis is still statistically and computationally challenging. In this study, we apply an efficient dimensionality reduction approach to model two-and three-way epistasis in a Bayesian multilocus model. Results from our case study demonstrate that our strategy detects already reported main QTL along with new potential QTL regions. Additionally, we were also able to identify novel two- and three-way-interacting regions involving already reported candidate genes.
We also found that the main difficulty in the use of Bayesian multilocus mapping for epistasis searches in MAGIC popula-tions was the high collinearity (due to the close physical linkage and presence of nearly perfect duplicates) among the markers as well as among pseudomarkers, which created inconsistencies in the results from different MCMC chains. If we presume that a marker (A) is a proxy to strong QTL and that markers A and B are highly similar to each other, then only one of these markers will be selected to the model, and the selection is based on the MCMC starting values. This phe-nomenon causes unwanted instability in the results from different MCMC chains and thefinal QTLfindings may look ambiguous. On the other hand, in a single-locus model, both markers A and B may easily appear as significant QTL, and having two QTL peaks implies stronger evidence. Additionally, collinearity due to high LD causes problems in SIS by selecting many representative markers close to a putative QTL region. Hence, we emphasize the importance of a quality control step (to remove the duplicates and high-LD markers) before using Bayesian multilocus models with SIS for epistasis searches. In our algorithm, stable performance of the method was also increased by comparing and utilizing estimates from five different MCMC chains. This, combined with carefully made quality control, appears to be helpful and can yield more meaningful results that are replicable.
8 core processor central processing unit (CPU) with 32 GB random-access memory (RAM). The SIS for the two-way pseudomarkers took5 min on the same computer. Compu-tation time for the two-way epistasis search with 1000 pseu-domarkers and the same number of iterations was15 min. However, the time taken to complete the three-way SIS was 92 hr, and the estimation of three-way interaction effects with 1000 pseudomarkers took15 min. The three-way SIS with 2331 markers needed to go through all ð23313233032329Þ=34 billion combinations.
all chains and those previously reported in the literature as the significant ones (Weiet al.2014).
Finally, we note that the marker coding has been identified as having an influence on epistatic QTL findings (Heet al.
2015; He and Parida 2016; Martiniet al.2017). When deal-ing with MAGIC populations, some researchers defined the numeric codes of genotypes using the identical-by-descent (IBD) approach (Wei and Xu 2016) rather than the iden-tical-by-state (IBS) approach, as in our study. The IBD ap-proach is primarily applied for main effects, because considering epistasis in an eight-parent MAGIC model re-quires 838 = 64 possible interaction effects just for a pair of loci. In contrast, using the IBS approach and our assump-tions, it is much easier to handle the interactions because only one interaction effect is then needed for a pair of loci. We modeled the interactions between markers as the product of the genotype values and the traditional SNP coding (21 and 1) that we used might not be able to detect all the epistatic interactions. The SIS approach seeks interactions marginally and therefore one may ask if some interactions are missed, because they do not show sufficiently large signals in SIS analysis. It is true that we may miss interaction signals whose marginal associations are not large enough, but on the other hand, applying SIS for residuals (which loosely do something similar to joint modeling) should partly alleviate this. Also, doing whole analysis multiple times, by varying the number of selected SIS candidates in each analysis, may give some information about sensitivity of the results. However, our results suggest that the dimensionality reduction based on SIS to the residuals is able to detect some of the strong sig-nificant higher-order interactions in the real data set. In con-clusion, we have illustrated that SIS dimensionality detection can be efficiently combined with Bayesian shrinkage-based variable selection and be successfully applied in real MAGIC populations for three-way epistasis searches, which is other-wise computationally challenging if one goes through all pos-sible combinations by enumeration.
Acknowledgments
The authors thank the editor, two anonymous reviewers, and Fiona Paul Ukken for their suggestions and comments, which helped us to improve our manuscript. The phenotyp-ing work was supported by the German Federal Ministry of Education and Research and was conducted in the network CROP.SENSe.net (Förder-Nr. 0315529). The genotyping work was funded by Europäische Fonds für Regionale Entwicklung (Förderkennzeichen: z1011bc001).
Literature Cited
Alqudah, A. M., R. Koppolu, G. M. Wolde, A. Graner, and T. Schnurbusch, 2016 The genetic architecture of barley plant stature. Front. Genet. 7: 117.
Bandillo, N., C. Raghavan, P. A. Muyco, M. A. L. Sevilla, I. T. Lobina
et al., 2013 Multi-parent advanced generation inter-cross
(MAGIC) populations in rice: progress and potential for genetics research and breeding. Rice 6: 11.
Bauer, A. M., F. Hoti, M. Von Korff, K. Pillen, J. Léon et al., 2009 Advanced backcross-QTL analysis in spring barley (H. vulgare ssp. spontaneum) comparing a REMLvs.a Bayesian model in multi-environmental field trials. Theor. Appl. Genet. 119: 105–123.
Bolwell, G. P., K. Bozak, and A. Zimmerlin, 1994 Plant cyto-chrome P450. Phytochemistry 37: 1491–1506.
Burn, J., D. Bagnall, J. Metzger, E. Dennis, and W. Peacock, 1993 DNA methylation, vernalization, and the initiation of
flowering. Proc. Natl. Acad. Sci. USA 90: 287–291.
Cai, Q., Z. Yuan, M. Chen, C. Yin, Z. Luo et al., 2014 Jasmonic acid regulates spikelet development in rice. Nat. Commun. 5: 3476.
Caicedo, A. L., J. R. Stinchcombe, K. M. Olsen, J. Schmitt, and M. D. Purugganan, 2004 Epistatic interaction between Arabidopsis FRI and FLCflowering time genes generates a latitudinal cline in a life history trait. Proc. Natl. Acad. Sci. USA 101: 15670– 15675.
Carland, F., S. Fujioka, and T. Nelson, 2010 The sterol methyl-transferases SMT1, SMT2, and SMT3 influence Arabidopsis de-velopment through nonbrassinosteroid products. Plant Physiol. 153: 741–756.
Cavanagh, C., M. Morell, I. Mackay, and W. Powell, 2008 From mutations to MAGIC: resources for gene discovery, validation and delivery in crop plants. Curr. Opin. Plant Biol. 11: 215– 221.
Chen, A., C. Li, W. Hu, M. Y. Lau, H. Linet al., 2014 PHYTOCHROME C plays a major role in the acceleration of wheat flowering under long-day photoperiod. Proc. Natl. Acad. Sci. USA 111: 10037–10044.
Cho, S., K. Kim, Y. J. Kim, J. K. Lee, Y. S. Choet al., 2010 Joint identification of multiple genetic variants via elastic-net variable selection in a genome-wide association analysis. Ann. Hum. Genet. 74: 416–428.
Cho, Y., M. Ritchie, J. Moore, J. Park, K. U. Lee et al., 2004 Multifactor-dimensionality reduction shows a two-locus interaction associated with Type 2 diabetes mellitus. Diabetolo-gia 47: 549–554.
Clouse, S. D., 2000 Plant development: a role for sterols in em-bryogenesis. Curr. Biol. 10: R601–R604.
Dennis, E., E. Finnegan, P. Bilodeau, A. Chaudhury, R. Gengeret al., 1996 Vernalization and the initiation offlowering. Sem. Cell Dev. Biol. 7: 441–448.
Durand, E., S. Bouchet, P. Bertin, A. Ressayre, P. Jamin et al., 2012 Flowering time in maize: linkage and epistasis at a major effect locus. Genetics 190: 1547–1562.
Ehrenreich, I. M., 2017 Epistasis: searching for interacting genetic variants using crosses. Genetics 206: 531–535.
Elhaddad, N. S., L. Hunt, J. Sloan, and J. E. Gray, 2014 Light-induced stomatal opening is affected by the guard cell protein kinase APK1b. PLoS One 9: e97161.
Fan, J., and J. Lv, 2008 Sure independence screening for ultrahigh dimensional feature space. J. R. Stat. Soc. B 70: 849–911. Figueiredo, M. A., 2003 Adaptive sparseness for supervised
learn-ing. IEEE Trans. Pattern Anal. Mach. Intell. 25: 1150–1159. Frank, M. R., J. M. Deyneka, and M. A. Schuler, 1996 Cloning of
wound-induced cytochrome P450 monooxygenases expressed in pea. Plant Physiol. 110: 1035–1046.
Fujii, H., and J. K. Zhu, 2009 Arabidopsis mutant deficient in 3 abscisic acid-activated protein kinases reveals critical roles in growth, reproduction, and stress. Proc. Natl. Acad. Sci. USA 106: 8380–8385.
González-García, M. P., D. Rodríguez, C. Nicolás, P. L. Rodríguez, G. Nicolás et al., 2003 Negative regulation of abscisic acid signaling by the Fagus sylvatica FsPP2C1 plays a role in seed dormancy regulation and promotion of seed germination. Plant Physiol. 133: 135–144.
Griffiths, S., R. P. Dunford, G. Coupland, and D. A. Laurie, 2003 The evolution of CONSTANS-like gene families in barley, rice, and Arabidopsis. Plant Physiol. 131: 1855–1867.
Gubler, F., R. Kalla, J. K. Roberts, and J. V. Jacobsen, 1995 Gibberellin-regulated expression of a myb gene in barley aleurone cells: evidence for myb transactivation of a high-pi alpha-amylase gene promoter. Plant Cell 7: 1879–1891. He, D., and L. Parida, 2016 Does encoding matter? a novel view
on the quantitative genetic trait prediction problem. BMC Bio-informatics 17: 272.
He, D., Z. Wang, and L. Parida, 2015 Data-driven encoding for quantitative genetic trait prediction. BMC Bioinformatics 16 (Suppl. 1): S10.
Hoti, F., and M. J. Sillanpää, 2006 Bayesian mapping of genotype3 expression interactions in quantitative and qualitative traits. Heredity 97: 4–18.
Huang, B. E., A. W. George, K. L. Forrest, A. Kilian, M. J. Hayden
et al., 2012 A multiparent advanced generation inter-cross population for genetic analysis in wheat. Plant Biotechnol. J. 10: 826–839.
Huang, W., and T. F. Mackay, 2016 The genetic architecture of quantitative traits cannot be inferred from variance component analysis. PLoS Genet. 12: e1006421.
Jung, H. S., and K. K. Niyogi, 2010 Mutations in Arabidopsis YCF20-like genes affect thermal dissipation of excess absorbed light energy. Planta 231: 923–937.
Kaneko, M., Y. Inukai, M. Ueguchi-Tanaka, H. Itoh, T. Izawaet al., 2004 Loss-of-function mutations of the rice GAMYB gene im-paira-amylase expression in aleurone andflower development. Plant Cell 16: 33–44.
Kärkkäinen, H. P., Z. Li, and M. J. Sillanpää, 2015 An efficient genome-wide multilocus epistasis search. Genetics 201: 865– 870.
Kim, K. N., Y. H. Cheong, J. J. Grant, G. K. Pandey, and S. Luan, 2003 CIPK3, a calcium sensor–associated protein kinase that regulates abscisic acid and cold signal transduction in Arabidop-sis. Plant Cell 15: 411–423.
Kover, P. X., W. Valdar, J. Trakalo, N. Scarcelli, I. M. Ehrenreich
et al., 2009 A multiparent advanced generation inter-cross to
fine-map quantitative traits inArabidopsis thaliana. PLoS Genet. 5: e1000551.
Krzywinski, M., J. Schein, I. Birol, J. Connors, R. Gascoyneet al., 2009 Circos: an information aesthetic for comparative geno-mics. Genome Res. 19: 1639–1645.
Kuczyńska, A., M. Surma, T. Adamski, K. Mikołajczak, K. Krystkowiak
et al., 2013 Effects of the semi-dwarfing sdw1/denso gene in barley. J. Appl. Genet. 54: 381–390.
Leyland, A. H., and C. A. Davies, 2005 Empirical Bayes methods for disease mapping. Stat. Methods Med. Res. 14: 17–34. Li, J., W. Zhong, R. Li, and R. Wu, 2014 A fast algorithm for
detecting gene–gene interactions in genome-wide association studies. Ann. Appl. Stat. 8: 2292–2318.
Li, R., M. Wang, Y. Wang, M. C. Schuman, A. Weinhold et al., 2017 Flower-specific jasmonate signaling regulates constitu-tivefloral defenses in wild tobacco. Proc. Natl. Acad. Sci. USA 114: E7205–E7214.
Li, Z., and M. J. Sillanpää, 2012 Estimation of quantitative trait locus effects with epistasis by variational Bayes algorithms. Ge-netics 190: 231–249.
Lindsey, K., M. L. Pullen, and J. F. Topping, 2003 Importance of plant sterols in pattern formation and hormone signalling. Trends Plant Sci. 8: 521–525.
Logsdon, B. A., G. E. Hoffman, and J. G. Mezey, 2010 A varia-tional Bayes algorithm for fast and accurate multiple locus ge-nome-wide association analysis. BMC Bioinformatics 11: 58. MacKay, D. J. C., 1994 Bayesian nonlinear modeling for the
pre-diction competition. ASHRAE Trans. 100: 1053–1062. Mackay, I. J., P. Bansept-Basler, T. Barber, A. R. Bentley, J. Cockram
et al., 2014 An eight-parent multiparent advanced generation inter-cross population for winter-sown wheat: creation, proper-ties, and validation. G3 (Bethesda) 4: 1603–1610.
Mäki-Tanila, A., and W. G. Hill, 2014 Influence of gene interac-tion on complex trait variainterac-tion with multilocus models. Genetics 198: 355–367.
Martini, J. W., N. Gao, D. F. Cardoso, V. Wimmer, M. Erbeet al., 2017 Genomic prediction with epistasis models: on the marker-coding-dependent performance of the extended GBLUP and properties of the categorical epistasis model (CE). BMC Bioinformatics 18: 3.
Maurer, A., V. Draba, Y. Jiang, F. Schnaithmann, R. Sharmaet al., 2015 Modelling the genetic architecture of flowering time control in barley through nested association mapping. BMC Ge-nomics 16: 290.
Millar, A. A., and F. Gubler, 2005 The Arabidopsis GAMYB-like genes, MYB33 and MYB65, are microRNA-regulated genes that redundantly facilitate anther development. Plant Cell 17: 705– 721.
Moore, J. H., 2004 Computational analysis of gene-gene interac-tions using multifactor dimensionality reduction. Expert Rev. Mol. Diagn. 4: 795–803.
Murk, W., and A. T. DeWan, 2016 Exhaustive genome-wide search for SNP-SNP interactions across ten human diseases. G3 (Bethesda) 6: 2043–2050.
Neal, R. M., 2012 Bayesian Learning for Neural Networks. Springer-Verlag, New York.
Oravecz, A., A. Baumann, Z. Máté, A. Brzezinska, J. Molinieret al., 2006 CONSTITUTIVELY PHOTOMORPHOGENIC1 is re-quired for the UV-B response in Arabidopsis. Plant Cell 18: 1975–1990.
Paixão, T., and N. H. Barton, 2016 The effect of gene interactions on the long-term response to selection. Proc. Natl. Acad. Sci. USA 113: 4422–4427.
Pasanen, L., L. Holmström, and M. J. Sillanpää, 2015 Bayesian LASSO, scale space and decision making in association genetics. PLoS One 10: e0120017.
Purcell, S., B. Neale, K. Todd-Brown, L. Thomas, M. A. Ferreira
et al., 2007 PLINK: a tool set for whole-genome association and population-based linkage analyses. Am. J. Hum. Genet. 81: 559–575.
Ritchie, M. D., L. W. Hahn, N. Roodi, L. R. Bailey, W. D. Dupont
et al., 2001 Multifactor-dimensionality reduction reveals high-order interactions among estrogen-metabolism genes in spo-radic breast cancer. Am. J. Hum. Genet. 69: 138–147.
Sannemann, W., B. E. Huang, B. Mathew, and J. Léon, 2015 Multi-parent advanced generation inter-cross in barley: high-resolution quantitative trait locus mapping for flowering time as a proof of concept. Mol. Breed. 35: 86.
Shimomura, K., S. S. Low-Zeddies, D. P. King, T. D. Steeves, A. Whiteleyet al., 2001 Genome-wide epistatic interaction anal-ysis reveals complex genetic determinants of circadian behavior in mice. Genome Res. 11: 959–980.
Sillanpää, M. J., 2009 Detecting interactions in association stud-ies by using simple allele recoding. Hum. Hered. 67: 69–75. Sun, X. L., Q. Y. Yu, L. L. Tang, W. Ji, X. Baiet al., 2013 GsSRK, a
G-type lectin S-receptor-like serine/threonine protein kinase, is a positive regulator of plant tolerance to salt stress. J. Plant Physiol. 170: 505–515.
Turner, A., J. Beales, S. Faure, R. P. Dunford, and D. A. Laurie, 2005 The pseudo-response regulator Ppd-H1 provides adaptation to photoperiod in barley. Science 310: 1031– 1034.
Van Nocker, S., and P. Ludwig, 2003 The WD-repeat protein su-perfamily in Arabidopsis: conservation and divergence in struc-ture and function. BMC Genomics 4: 50.
von Zitzewitz, J., P. Szűcs, J. Dubcovsky, L. Yan, E. Franciaet al., 2005 Molecular and structural characterization of barley ver-nalization genes. Plant Mol. Biol. 59: 449–467.
Wang, G., I. Schmalenbach, M. von Korff, J. Léon, B. Kilianet al., 2010 Association of barley photoperiod and vernalization genes with QTLs forflowering time and agronomic traits in a BC2DH population and a set of wild barley introgression lines. Theor. Appl. Genet. 120: 1559–1574.
Wei, J., and S. Xu, 2016 A random-model approach to QTL map-ping in multiparent advanced generation intercross (MAGIC) populations. Genetics 202: 471–486.
Wei, W. H., G. Hemani, and C. S. Haley, 2014 Detecting epis-tasis in human complex traits. Nat. Rev. Genet. 15: 722–33. William, D. A., Y. Su, M. R. Smith, M. Lu, D. A. Baldwin et al., 2004 Genomic identification of direct target genes of LEAFY. Proc. Natl. Acad. Sci. USA 101: 1775–1780.
Winter, C. M., R. S. Austin, S. Blanvillain-Baufume, M. A. Reback, M. Monniaux et al., 2011 LEAFY target genes reveal floral regulatory logic, cis motifs, and a link to biotic stimulus re-sponse. Dev. Cell 20: 430–443.
Wood, A. R., M. A. Tuke, M. A. Nalls, D. G. Hernandez, S. Bandinelli
et al., 2014 Another explanation for apparent epistasis. Nature 514: E3–E5.
Xu, S., 2003 Estimating polygenic effects using markers of the entire genome. Genetics 163: 789–801.
Xu, S., 2007 An empirical Bayes method for estimating epistatic effects of quantitative trait loci. Biometrics 63: 513–521. Yan, L., D. Fu, C. Li, A. Blechl, G. Tranquilliet al., 2006 The wheat
and barley vernalization gene VRN3 is an orthologue of FT. Proc. Natl. Acad. Sci. USA 103: 19581–19586.
Yi, N., and S. Xu, 2008 Bayesian LASSO for quantitative trait loci mapping. Genetics 179: 1045–1055.
Yoshikawa, M., G. Yang, K. Kawaguchi, and S. Komatsu, 2003 Expression analyses of b-tubulin isotype genes in rice. Plant Cell Physiol. 44: 1202–1207.
Yuan, Z., and D. Zhang, 2015 Roles of jasmonate signalling in plant inflorescence andflower development. Curr. Opin. Plant Biol. 27: 44–51.
Zakhrabekova, S., S. P. Gough, I. Braumann, A. H. Müller, J. Lundqvist
et al., 2012 Induced mutations in circadian clock regulator Mat-a facilitated short-season adaptation and range extension in culti-vated barley. Proc. Natl. Acad. Sci. USA 109: 4326–4331. Zhao, Y., Z. Chan, J. Gao, L. Xing, M. Caoet al., 2016 ABA
re-ceptor PYL9 promotes drought resistance and leaf senescence. Proc. Natl. Acad. Sci. USA 113: 1949–1954.