ISSN(Online): 2319-8753 ISSN (Print) : 2347-6710
I
nternational
J
ournal of
I
nnovative
R
esearch in
S
cience,
E
ngineering and
T
echnology
(A High Impact Factor, Monthly, Peer Reviewed Journal)
Visit: www.ijirset.com
Vol. 7, Issue 12, December 2018
Changing Cropping Pattern and it’s
Determinant in Dry Subtropical and Cool
Temperate Zone
Benuta Chhetri, Dr.Tulsi Gurung, Jigme Thinley
Natural Resource Management, College of Natural Resources, Royal University of Bhutan, Lobesa, Punakha.
Associate Professor, Department of Agriculture, College of Natural Resources, Royal University of Bhutan,
Lobesa, Punakha.
Lecturer, Department of Sustainable Development, College of Natural Resources, Royal University of Bhutan,
Lobesa, Punakha.
ABSTRACT: The present study discussed the trends in crop pattern at two agro ecological zones (Wangduephodrang for Dry subtropical and Haa for cool temperate zone). Data such as area under production, yield, landholding size, population density, irrigation channel (km) and weather data were compiled for the periods of 16 years (2002-20017) from the RNRSTAT, NSB, agriculture statistic and online sources. The study used annual growth rate to analyse the extent of cropping pattern changes, Herfindal Hirschman index method to assess the crop diversification and multiple linear regression method to assess the determinants for changes. The result showed the cereal crop has decreased significantly. The share of vegetables in the total cropped area has increased significantly over the years, indicating there is lateral movement towards cropping pattern change, with a marked shift from the cultivation of food grains to commercial crops. Diversification was found higher for dry subtropical while more crop concentration in cool temperate zone. Employing simple regression model, in accordance with the changing weather pattern (rainfall and temperature), access to irrigation facilities, increasing landholding size, crop yield, population density were the important contributors to changes in cropping pattern towards high-valued crops and help in fetching good incomes by the cultivators.
KEYWORDS: Cropping pattern, Gross cropped area, Crop diversification, Herfindahl Hirschman Index.
I. INTRODUCTION
Cropping pattern is the proportion of area under different crop at a point of time and change over a period of time [1]. The continuous urbanization and infrastructure development causes demand for the farmland and adopt intensive cultivation. Cropping pattern in Southeast Asia and Latin America reveals that there is gradual shifting in favor of high value cash crops from cultivating traditional crops because of their high potential in generating income, employment and poverty alleviation [2]; [22]. In the Himalaya, cultivators are moving towards crop intensification through mixed cropping and by including high value crops as an adaptation strategy against climatic change [17];[3]; [15]; [16].
ISSN(Online): 2319-8753 ISSN (Print) : 2347-6710
I
nternational
J
ournal of
I
nnovative
R
esearch in
S
cience,
E
ngineering and
T
echnology
(A High Impact Factor, Monthly, Peer Reviewed Journal)
Visit: www.ijirset.com
Vol. 7, Issue 12, December 2018
zones. Thus intensification of crops through mixed cropping and integration of high-value crops are gaining prominence, especially in the hill regions as well as for future growth of agriculture [22];[4].
Changes in cropping pattern are an essential part of diversification, and for agriculture based economy [5]; [15[; [13]; [14]. In subsistence farming system, diversification provides an alternative means of livelihood, reduce susceptibility to climatic variability such as floods and drought which result in crop failure [6]. Changes of cropping pattern are influenced by economic, technological, and institutional factors [6]. Systematic understanding of changes in cropping pattern over the years is very important, for the farmers to get better returns, for the policy makers to check the over or under production, thus ensuring the required overall balance. It is essential to evaluate the agricultural land use for individual crop in order to understand the crop pattern which makes it possible to reduce vulnerability [7].Therefore the objectives of the study were to examine the extent and nature of cropping pattern changes and its determinants at district level from the year 2002-2017.
II. RELATED WORK
Agriculture
Agriculture is the global food security and is most critical issues of the 21st century which is inseparable from human well being. Crop productions are not increasing fast enough to keep up with demand. Global population is projected to reach 9.7 billion by 2050 [29] – about 32% higher than today’s 7.3 billion with an annual growth rate of 0.8% between 2015 and 2050 [31]. Over 98% of this addition will take place in less developed regions and emerging markets, in particular Africa and Asia.
Himalayas country has been found that a lot of prime agriculture land has lost to the process of urbanisation and infrastructure development [26];[27].The challenge of feeding the world is
attracting attention again.
Technological advances, improved variety of seeds and fertilizers, and better farming practices contribute to the enhancement of the crop production globally.
Cropping pattern
Cropping pattern is a dynamic concept as it changes over space and time. Cropping pattern indicates the proportion of area under different crop at a point of time, change in this distribution over a period of time and space [1]. The total crop area is represented by different crops in the season and the per cent area under different crops in a season signifies the cropping pattern. Cropping pattern change from one year to the other indicates the changes in the proportions of different crops. Some new crops may replace the existing crops. The crops which represent larger proportions are termed as major crops in the area. Cropping pattern of an area is largely determined by resources available such as rainfall, irrigation, soils, farm inputs and ultimately the preferences of farmers.
Changes of cropping pattern and its determinant
A change in cropping pattern thus implies a change in the proportion of area under different crops during two or more points of time. Changing technology, agro-infrastructure and farmers’ adaptability with changing climatic condition lead to the choice of desirable cropping pattern change in a region. Cropping pattern changes from time to time with the change in related factors determined mainly by market forces (price, profitability), technology, agro-climatic condition, development of infrastructure and institutional factors like government’s policy decision [28]. Within the same time frame and unrelated to climate change, yields increase due to technological innovation, and the market for crops grow significantly with growth in income and population (Howitt, et. al., 2010). Some regions are found to record concentration towards a few crops and some regions move towards a variety of crops. However, with rising cropping intensity crop diversification is found to take place significantly [25].
ISSN(Online): 2319-8753 ISSN (Print) : 2347-6710
I
nternational
J
ournal of
I
nnovative
R
esearch in
S
cience,
E
ngineering and
T
echnology
(A High Impact Factor, Monthly, Peer Reviewed Journal)
Visit: www.ijirset.com
Vol. 7, Issue 12, December 2018
subsistence farming system provides an alternative means of income generation for smallholder farmers, the majority of whom are vulnerable to climate change.
The cropping pattern in Bhutan has experienced a drastic change. The increasing demand for food as a result of growing population has pressurized the agricultural sector to increase its production. This has led to crop intensification and substitution of commercial crops with food crops. The area under cash crop has increased in the country. In all the districts across all agro-ecological zones in Bhutan, farmers have identified different cash crops that are displacing the traditional cereals. In the Dzongkhags representing the cool temperate and warm temperate agro-ecosystem potato, vegetables, apples and pasture grasses are the new crops that are displacing wheat, barley, buckwheat and millet. Maize is displaced by citrus only in Dagana Dzongkhag. In the dry-subtropical agro-ecology represented by Trashiyangtse Dzongkhag, wheat and buckwheat is displaced by potato and vegetables [34]. The National Biodiversity Center (NBC) is the agency of the country mandated to develop programs for the sustainable conservation, development and utilization of the agro-biodiversity resources for food security and poverty alleviation. The conservation and use of agro-biodiversity is fundamental for making the agricultural ecosystems sustainable, productive, and resilient and can contribute to better nutrition and livelihoods of poor farmers throughout the world [33].
III. MATERIAL AND METHODS
A. Study Sites
The study was focused in two different agro-ecological zones, Ha and Wangdue Phodrang district.
Dry Sub Tropical Zone- Wangdue Phodrang
Wangdue Phodrang is a dry sub-tropical zone occupies an area of approximately 4038 km2 with an elevation of 800 - 5800 meters above the sea level [8]. It is the largest district in Bhutan and consists of 15 provinces. Wangdue has about 65% of its total area under forest cover[8]. Both broadleaf as well as conifer forests are prevalent. Cultivation of rice is an important agricultural feature. Potato and wheat are important dry land crops.
Cool Temperate Zone - Haa
Haa Dzongkhag is situated at cool temperate zone characterized by a rugged and mountainous terrain, and communities are located in remote settlements[9]. Haa Dzongkhag, has a total area of 1899 km2 with a population of 13,499 in 2015. The altitude ranges from 1000-5600 meters above the sea level[9]. The vegetation ranges from broad leafed forest in the southern provinces to coniferous and sub alpine in the central, and pure alpine vegetation in the high lands of the northern Gewogs. About 78 percent of land is under forest cover and forestry plays an important part in local economy[10].
ISSN(Online): 2319-8753 ISSN (Print) : 2347-6710
I
nternational
J
ournal of
I
nnovative
R
esearch in
S
cience,
E
ngineering and
T
echnology
(A High Impact Factor, Monthly, Peer Reviewed Journal)
Visit: www.ijirset.com
Vol. 7, Issue 12, December 2018
A. Data collection
The study was based on time series data and relies on secondary data compiled from various published sources.Five major crops namely rice, maize, wheat, buckwheat and barley were selected for this study because these crops contribute more than 80% of the total grain production in study area [34]. Specifically, paddy, wheat and maize were selected for the dry subtropical zone whereas wheat, buckwheat and barley for cool temperate zone. These data were obtained from various sources such as RNRSTAT, NSB, and District Agriculture office. Some important vegetables were also included such as chilli, cabbage and tomato for dry subtropical zones and potatoes, cabbage and turnip for cool temperate zone. The study period was taken over for 16 years. To minimize the effect of annual fluctuations in area under different crops, the first six years of the average were calculated and rest quinquennial moving (five years) average of area and percentage of area under each crop to gross cropped area (GCA) were calculated
In order to assess the determinants of cropping patterns changes, data were collected from RNRSTAT, agriculture statistic, NSB and online sources. The data included population density, landholding size, irrigation channels (km), gross cropped area, net cropped area, irrigated area to GCA, crop yield and crop intensity. Cropping intensity was derived using the formula:
= ∗100
Crop intensity refers to growing numbers of crops from the same field in the same year. Higher cropping intensity means higher portion of the net area being cropped more than once in one agriculture year. This also implies higher productivity per unit of arable land.
To capture the effect of water availability on cropping pattern changes weather data such as daily maximum temperature, minimum temperature, and rainfall data were obtained from the National Centre of Hydro Metrology, Thimphu. These datasets were used from 2002 to 2017.
ISSN(Online): 2319-8753 ISSN (Print) : 2347-6710
I
nternational
J
ournal of
I
nnovative
R
esearch in
S
cience,
E
ngineering and
T
echnology
(A High Impact Factor, Monthly, Peer Reviewed Journal)
Visit: www.ijirset.com
Vol. 7, Issue 12, December 2018
A. Data Analysis
Annual Growth Rate Analysis of Cropped Area
The annual growth rate analysis finds out the crop area growth over a period of time. To calculate, the first average of six years was taken and rest quinquennial moving (five years) average of area and proportion of area under each crop to GCA. Thereafter, the percentage share of each crop to the total cropped area was used for the understanding the changes in cropping pattern whether increase or decrease of crop area has been due to expansion of GCA or due to substitution of area under other crops.
Crop Diversification
Crop diversification is defined as reallocation of resources, mainly cultivable land, at the disposal of farmers to accommodate a more diverse cropping pattern. The crop diversification can be studied through many statistical methods that can be measured through Index of Maximum Proportions, Simpson Index, Entropy Index, Modified Entropy Index, Composite Entropy Index, Ogive index and Herfindahl Hirschman Index (HHI). Kumar et al. (2012) and Benin et al. (2004) have used these indices in their studies. Each of these tools has its own advantages and limitations in terms of data requirement, ease of computation and interpretation. Further, the results obtained through these methods are more or less similar. Therefore, HHI method was used to access the crop diversification. This index is the sum of square of the proportion of individual crop in the GCA. With an increase in diversification, a sum of the square of the proportion of cropped area (HHI) decreases. This is the measure of concentration, alternatively, an inverse measure of diversification since HHI decreases with an increase in diversification [4].
The index was calculated by taking sum of square of percentage of cropped area of each crop in the GCA. The HHI value ranges from 0 to 1. It takes the value of one when there is a complete specialization and approaches 0 when ‘n’ gets larger, which indicates that diversification is perfect. Since HHI is a measure of concentration, it was transformed by subtracting it from 1, that is, 1 - HHI. The transformed value of HHI avoids confusion to compare with other indices. Thereafter, the differences in HHI value were compared to analyse the crop diversification [4]; [6].
Formula:
ℎ ℎ ( ) = 1−
Where:
n = is the total number of ith crop
pi = Acreage proportion of ith crop in the total cropped area
Determinants of Cropping Pattern Change
To identify the factors affecting cropping pattern change, multiple linear regression analysis was carried out using the time series data from 2002-2017. The average of explanatory variables was calculated for the first six years and rest for five years. Thereafter, HHI was specified as function of the following independent variables.
Y= a + b 1 X 1 + b 2 X 2 + b 3 X 3 + b n X n + U
The explanatory variables were as under: X1- Population density (Km2)
X2- Crop intensity
X3- Crops yield
X4- Annual rainfall (mm)
X5- Annual temperature (0C)
X6- Irrigated area to gross cropped area (GCA)
X7- Landholding size (ha)
ISSN(Online): 2319-8753 ISSN (Print) : 2347-6710
I
nternational
J
ournal of
I
nnovative
R
esearch in
S
cience,
E
ngineering and
T
echnology
(A High Impact Factor, Monthly, Peer Reviewed Journal)
Visit: www.ijirset.com
Vol. 7, Issue 12, December 2018
IV. RESULTS AND DISCUSSION
A. Nature and Extent of Cropping Pattern Changes Changes of cropping pattern in Dry Sub Tropical Zone
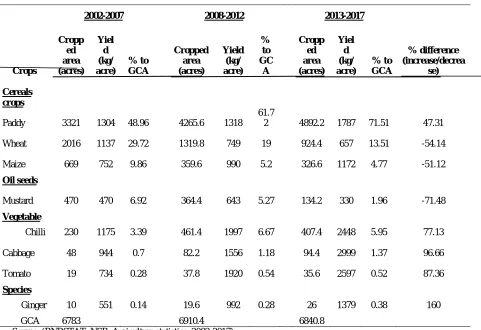
The cropping pattern in dry sub tropical zone has undergone considerably changes over time. As the cultivated area remains more or less constant, the increased demand for food because of increase in population and urbanization puts agricultural land under stress resulting in crop intensification and substitution of food crops with commercial crops. In fact, it is striking to observe that under cereals GCA declined by more than 50% mainly due to fall in area under maize, wheat and oil seeds crop by 54.12%, 51.12% and 71.21% respectively as shown in table 1. However, cereal crops still occupied the major share of the cropped area, indicating the farmers’ awareness about their value in food security besides livelihood security. Paddy has the highest share of nearly 50% in GCA followed by wheat, maize and mustard.The Bhutanese subsistence farmers meet 98% of their total cereals crops managed by themselves[11].
Table 1 below explains in detail that over the years, the percentage share of cereal crops in wheat and maize have decreased significantly from 29% to 13% between 2002-2007 to 2008-2012. It has further decreased from 9% to 4% in period 2013-2017. Except the share under paddy cultivation showed increasing trend. Similarly, the percentages of area share of oil seed have decreased significantly over the year. In contrast, under vegetable and species crops, chilli have increased from 3.39% to 6.67% during 2008-2013, but slightly reduced about 5.95% in 2013-2017. Similarly, the share of cabbage, tomato and ginger has constantly been increasing over the year.
The reason for increasing trend in vegetables might be because of increasing emphasis of the formal research and development programs for the promotion of improved high yielding crops as one of the key incitement for the loss of traditional crops and varieties [34]. Contrary, decline trend in cereal crops may be attributed to low income and profit due to risk of pest, diseases and damage by animals. Additionally, in all the districts across all agro-ecological zones, farmers have identified different cash crops that are displacing the traditional cereals. In the dry-subtropical agro-ecology paddy, maize and wheat are replaced by potato and vegetables that fetches a very high cash returns [34]. Although the shift from cereals crops to high value crops is likely to increase farm output and income to farmers, in dry land regions it will expose cultivators to serious weather borne risks because high value crops have a high water requirement [13]. This long-term growth analysis will help identify lagging crops and suggest suitable technology, policy, and institutional options for accelerating growth.
Area Growth of Important Crops in Dry Subtropical Zone
ISSN(Online): 2319-8753 ISSN (Print) : 2347-6710
I
nternational
J
ournal of
I
nnovative
R
esearch in
S
cience,
E
ngineering and
T
echnology
(A High Impact Factor, Monthly, Peer Reviewed Journal)
Visit: www.ijirset.com
Vol. 7, Issue 12, December 2018
Table 1.Cropping pattern in dry subtropical zone
Crops
2002-2007 2008-2012 2013-2017
Cropp ed area (acres) Yiel d (kg/ acre) % to GCA Cropped area (acres) Yield (kg/ acre) % to GC A Cropp ed area (acres) Yiel d (kg/ acre) % to GCA % difference (increase/decrea se) Cereals crops
Paddy 3321 1304 48.96 4265.6 1318
61.7
2 4892.2 1787 71.51 47.31
Wheat 2016 1137 29.72 1319.8 749 19 924.4 657 13.51 -54.14
Maize 669 752 9.86 359.6 990 5.2 326.6 1172 4.77 -51.12
Oil seeds
Mustard 470 470 6.92 364.4 643 5.27 134.2 330 1.96 -71.48
Vegetable
Chilli 230 1175 3.39 461.4 1997 6.67 407.4 2448 5.95 77.13
Cabbage 48 944 0.7 82.2 1556 1.18 94.4 2999 1.37 96.66
Tomato 19 734 0.28 37.8 1920 0.54 35.6 2597 0.52 87.36
Species
Ginger 10 551 0.14 19.6 992 0.28 26 1379 0.38 160
GCA 6783 6910.4 6840.8
Source: (RNRSTAT, NSB, Agriculture statistics, 2002-2017)
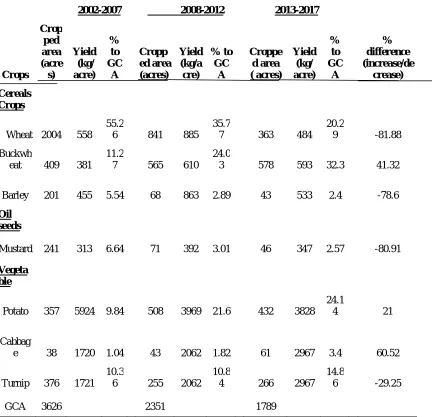
1. Changes in Cropping Pattern in Cool Temperate Zone
Table 2 below explains in detail that over the years, the area share of cereal crops decreased considerably from 55.26% - 20.29% in wheat and 5.54% - 2.4% in barley during 2002-2012. Except the share under buckwheat cultivation showed increasing trend. Similarly, the area share of oil seed crops, also have decreased over the year. In contrast, vegetable and species, their share to the total cropped area has increased. Similarly, the share of potatoes and cabbage has constantly been increasing over the year.This clearly reflects the role of high-value crops and the emphasis laid on this sector by the Department of Agriculture through implementation of its schemes like irrigation, high yielding seeds and other farm mechanization.
2. Area Growth of Important Crops in Cool Temperate Zone
Under cool temperate zone, the annual area growth rate depicts under cereal crops, both wheat and barley have gone negative about 81.88% and 78.6%, except in the buckwheat has shown positive growth about 41.32%. Similarly, area share under oilseed also showed negatively growth over the year. Nevertheless, areas under vegetable have grown positively except for the turnip which has declined by 29.25%. Based on the area growth rates of crops in both the agro climatic region, it is evident that crop pattern is increasingly inclined towards commercial crops due to shrinkage of area under cereals and oilseeds in both the zones. Changes in cropping pattern from the production of less productive crops to more productive varieties is an essential strategy that can increase income from agriculture, minimize risks due to crop failures and make earning sustainable.
ISSN(Online): 2319-8753 ISSN (Print) : 2347-6710
I
nternational
J
ournal of
I
nnovative
R
esearch in
S
cience,
E
ngineering and
T
echnology
(A High Impact Factor, Monthly, Peer Reviewed Journal)
Visit: www.ijirset.com
Vol. 7, Issue 12, December 2018
Table 2. Cropping pattern in cool temperate zone
Crops
2002-2007 2008-2012 2013-2017
Crop ped area (acre s) Yield (kg/ acre) % to GC A Cropp ed area (acres) Yield (kg/a cre) % to GC A Croppe d area ( acres) Yield (kg/ acre) % to GC A % difference (increase/de crease) Cereals Crops
Wheat 2004 558 55.2
6 841 885 35.7
7 363 484 20.2
9 -81.88
Buckwh
eat 409 381 11.2
7 565 610 24.0
3 578 593 32.3 41.32
Barley 201 455 5.54 68 863 2.89 43 533 2.4 -78.6
Oil seeds
Mustard 241 313 6.64 71 392 3.01 46 347 2.57 -80.91
Vegeta ble
Potato 357 5924 9.84 508 3969 21.6 432 3828 24.1
4 21
Cabbag
e 38 1720 1.04 43 2062 1.82 61 2967 3.4 60.52
Turnip 376 1721 10.3
6 255 2062 10.8
4 266 2967 14.8
6 -29.25
GCA 3626 2351 1789
Source: Source: (RNRSTAT, NSB, Agriculture statistics, 2002-2017).
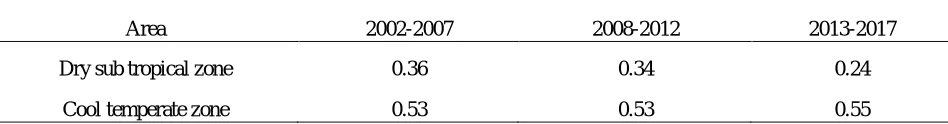
A. Changes in Level of Crop Diversification
ISSN(Online): 2319-8753 ISSN (Print) : 2347-6710
I
nternational
J
ournal of
I
nnovative
R
esearch in
S
cience,
E
ngineering and
T
echnology
(A High Impact Factor, Monthly, Peer Reviewed Journal)
Visit: www.ijirset.com
Vol. 7, Issue 12, December 2018
concentrated rather than crop diversification. Higher level of diversification in dry subtropical zone was due to dominant shares of vegetables and sharp decline in cereal crops. On the other hand considerable increase in buckwheat (41.32%), potato (21%) and cabbage (60.52%) have pushed the cool temperate zone to emerge as more crop concentrated during year 2002-2017.
Table 3: Difference in Crop diversification measured by HHI
Area 2002-2007 2008-2012 2013-2017
Dry sub tropical zone 0.36 0.34 0.24
Cool temperate zone 0.53 0.53 0.55
B. Determinant of Cropping Pattern Change, during 2002-2017
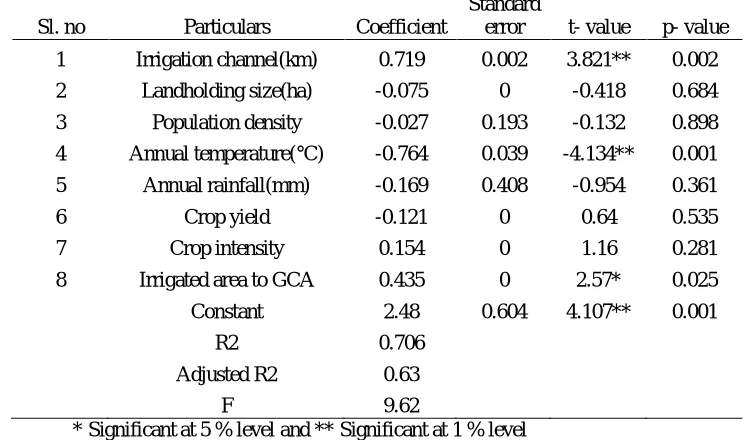
The table 4 and 5 shows the step wise regression analyzed result for the determinant of cropping pattern change under dry sub tropical zone and cool temperate zone.
The growth performance of the crop sector is influenced by several factors such as the farmers’ use of physical inputs, irrigation, weather conditions and government policy. Therefore, the next logical step was to probe into the cause’s variations in cropping pattern in two agro ecological zone. To test whether there is a direct relationship between crop pattern changes due to factors; a multi-linear regression analysis was performed. To identify such factors, we computed HHI of crops under area for the 16 years as a dependent variable, where the dependent variable HHI indicates that higher is the value less is the changes and diversification. The independent variables are crop intensity, irrigation channel (km), landholding size, population density, irrigated area to the GCA, rainfall, temperature and crop yield
In dry subtropical zone, the estimated Coefficient of Determination (R2) is 0.706, indicating that the variables (irrigated area, landholding size, population density, rainfall, temperature and crop yield) included in the study explain about 70 percent variation in dependent variables is explained by selected independent variables The F value found to be significant at 0.01 level. Where, F (3, 12) =9.62, p < 0.002. The remaining variation in dependent variable (crop pattern changes) is caused by variables which are not included in this model.
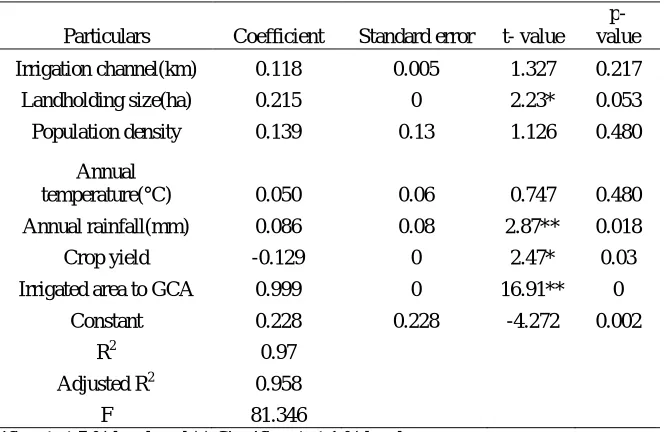
For the cool temperate zone, the coefficient of determination (R2) is 0.970, explains about 97 percent variation in dependent variable is explained by independent variables. The F value found to be significant at 1% level (p=.000), where F (4, 10) =81.346, p < 0.01.
Irrigation channel (km) provided from period 2002-2017 in dry sub tropical zone has emerged as positive coefficient correlation and also statistically significant at 0.01 level where, p = 0.002 resulting increase in crop pattern with increase in the factor. However increase of irrigation channel over the year in cool temperate zone was found not significant though exerted positive correlation, Development of irrigation channel is one of the indicators of agricultural development, hence the concerted effort is required for development of more irrigation facilities which facilitate more crop pattern change.
Rainfall in dry subtropical zone has no influence on changing cropping pattern due to statistically not significant and negative correlation. Rainfall in dry sub tropical region in Bhutan is high hence variation in rainfall is unlikely to affect the cropping pattern and moreover the areas have been benefited more as a result of high value crops by substituting the cereals crops (Joshi et al., 2003). Contrary, rainfall proved to be significant factor in cool temperate zone where p = 0.018, significant at 0.01 level.
ISSN(Online): 2319-8753 ISSN (Print) : 2347-6710
I
nternational
J
ournal of
I
nnovative
R
esearch in
S
cience,
E
ngineering and
T
echnology
(A High Impact Factor, Monthly, Peer Reviewed Journal)
Visit: www.ijirset.com
Vol. 7, Issue 12, December 2018
variables (average size of land holdings and crop area) are negative and also statistically not significant for dry subtropical zone. However, in cool temperate zone, landholding size exerted positive correlation and significant at 5% level (p = 0.053). Average size of land holdings and crop cultivated area has positive relationship because crop cultivated in large farm size is higher than small farm size (ICAR- RCER, 2015). It indicates that the increase of land size is likely to change the cropping pattern. Small farm size may not be able to spare land for cultivation of other crops other than staple food due to insufficient land. Besides, their per capita income is low and do not have surplus fund to make investment in cultivation of high value crops.
We hypothesis that increasing population density leads to increase in cultivation of various crops thus leads to change. However, population density exerted negative effect on crop pattern change and coefficient was not found significant in both the agro ecological zone. The increase in population in both the zone might have moved to better earning job rather than growing crops and stick in agricultural work. Moreover, dry subtropical zone is undergoing with hydro project where farmers might have opted for better earning work besides agriculture. Also as population grows, one would expect land to be divided into smaller size. Moreover, higher population density means lower per capita land and farmers became more conscious to their consumption need and hesitate to shift their food grain area to high value crops. Thus change is restricted.
hange in cropping pattern has influenced by net irrigated area in both agro ecological zone. It has a positive impact on cropping pattern change and is statistically significant at 0.01 level. Farmers increases crop cultivation with increase of irrigated area for both agro ecological zones. Similarly, annual temperature of dry subtropical zone has significant correlation to changes in cropping pattern but not significant for cool temperate zone. Overall, regression results indicate that better irrigation facilities, normal rainfall, increase temperature, increase of crop yield, crop intensity, landholding size and population density will increase the crop output growth and hence influence to change cropping pattern.
Table 4: Step-wise regression function for determinant of cropping pattern change in dry sub tropical zone
Sl. no Particulars Coefficient
Standard
error t- value p- value 1 Irrigation channel(km) 0.719 0.002 3.821** 0.002 2 Landholding size(ha) -0.075 0 -0.418 0.684 3 Population density -0.027 0.193 -0.132 0.898 4 Annual temperature(°C) -0.764 0.039 -4.134** 0.001 5 Annual rainfall(mm) -0.169 0.408 -0.954 0.361 6 Crop yield -0.121 0 0.64 0.535 7 Crop intensity 0.154 0 1.16 0.281 8 Irrigated area to GCA 0.435 0 2.57* 0.025 Constant 2.48 0.604 4.107** 0.001
R2 0.706 Adjusted R2 0.63
F 9.62
* Significant at 5 % level and ** Significant at 1 % level
ISSN(Online): 2319-8753 ISSN (Print) : 2347-6710
I
nternational
J
ournal of
I
nnovative
R
esearch in
S
cience,
E
ngineering and
T
echnology
(A High Impact Factor, Monthly, Peer Reviewed Journal)
Visit: www.ijirset.com
Vol. 7, Issue 12, December 2018
Table 5: Estimated regression function for determinant of cropping pattern change in cool temperate zone
Particulars Coefficient Standard error t- value p- value
Irrigation channel(km) 0.118 0.005 1.327 0.217 Landholding size(ha) 0.215 0 2.23* 0.053 Population density 0.139 0.13 1.126 0.480
Annual
temperature(°C) 0.050 0.06 0.747 0.480 Annual rainfall(mm) 0.086 0.08 2.87** 0.018 Crop yield -0.129 0 2.47* 0.03 Irrigated area to GCA 0.999 0 16.91** 0
Constant 0.228 0.228 -4.272 0.002 R2 0.97
Adjusted R2 0.958
F 81.346 * Significant at 5 % level and ** Significant at 1 % level
V. CONCLUSION AND RECOMMENDATION
A. Conclusion
It is concluded from the study that over the years, though share of cereal crop has decreased, it still occupies the major share of the cropped area reflecting farmers’ concern for food security. However, the share of vegetables in the GCA has increased significantly over the years which means both zones are inclined towards commercial crops that most cereal crops were replaced by vegetables that fetches a high cash in returns. It is also observed that higher diversification has occurred in dry subtropical zone which indicates that the region is moving towards change rather than crops specialization. Higher crop concentration was observed in cool temperate zone.
Climate change, land holding size, population density, crop intensity, crops yields, irrigation facilities are identified as determinants of cropping pattern change and diversification in cool temperate and dry sub tropical zone.
B. Recommendation
ISSN(Online): 2319-8753 ISSN (Print) : 2347-6710
I
nternational
J
ournal of
I
nnovative
R
esearch in
S
cience,
E
ngineering and
T
echnology
(A High Impact Factor, Monthly, Peer Reviewed Journal)
Visit: www.ijirset.com
Vol. 7, Issue 12, December 2018
REFERENCES
[1] S. Misra and V. Puri, "Indian Economy- Its Development And Experience," Himalaya publishing house Pvt. Ltd, 2011.
[2] A. Gupta and M. KD, "Food consumption pattern in rural India: a regional perspective.," J. Econ. Soc. Develop., no. 1, pp. 1-16, 2014.
[3] E. Kannan and S. Sundaram, "Analysis of trends in India’s agricultural growth. The Institute for Social and Economic Change, Bangalore;," p. 276, 2011. [4] U. De and M. Chattapadhyay, "Crop diversification by poor peasants and role of infrastructure: Evidence from West Bengal," J Develop and Agric Econ., vol. 2, p. 340—350., 2010.
[5] B. Ghosh, "Essence of Crop Diversification: A Study of West Bengal Agriculture.," Asian Journal of Agricultural Research, vol. 5, pp. 28-44, 2011. [6] S. Patil, Spatio Temporal Analysis of agricultural landuse Pattern, Pune, 2012.
[7] RNR, Bhutan RNR Statistics 2013., Thimphu:RGoB: MoAF, 2013.
[8] DDMC, Draft Dzongkhag Disaster Management and Contingency Plan, Dzongkhag Administration, Haa: RoB, 2017. [9] RGoB, "Uesu Gewog Ninth Plan," Haa Dzongkhag Royal Government of Bhutan.Retrieved June 9, 2018., Bhutan, 2007.
[10] NEC, National Adaptation Programme of Action; National Environment Commission, Thimphu, Bhutan : Royal Government of Bhutan, 2006.
[11] A. Anselm and A. Taofeeq, "Challenges of Agricultural Adaptation to Climate Change in Nigeria: A Synthesis from the Literature. The Creative Commons Attribution, Facts Reports," 2010.
[12] R. Onyeneke and D. Madukwe, "Adaptation Measures by Crop Farmers in the South-East Rainforest Zone of Nigeria to Climate Change.," Science World Journal, vol. 5, pp. 32-34, 2010.
[13] S. Goswami, H. Choudhary and A. Bisht., "Factors influencing crop diversification as Tool to two fold farmers’ earnings in Uttarakhand.," Indian Journal of Economics and Development, vol. 13, pp. 228-233., 2017.
[14] B. Bradshaw, H. Dolan and B. Smith, "Farm-level adaptation to climatic variability and change: crop diversification in the Canadian prairies.," Climatic Change, vol. 67, pp. 119-141, 2004.
[15] D. Sinha, A. Nasim and K. Singh, "Shrinking net sown area: An analysis of changing land use pattern in Bihar.," J Agric Search, vol. 3, p. 238—243, 2016.
[16] A. Nasim, D. Sinha, K. Singh and R. Mishra, "Growth performance and resource use efficiency of maize in Bihar," J Agric Search, vol. 4, p. 71—75., 2017.
[17] K. Singh, T. Shankar, A. Jha and A. Kumar, "Scope and Possibilities for cultivation of medicinal and aromatic plants in Bihar: Some evidences.," Environ Ecol., vol. 32, p. 1642—1646., 2014.
[18] S. Dagay, T. Tashi, S. Khandu, K. Tshering and T. Namgyel, Second National Communication from Bhutan to the UNFCCC, Thimphu: NEC, RGoB., 2011.
[19] R. Jigme, G. Nima, D. Tshering, T. Pema, D. Rinzin, D. Pema and T. Sangay, Review of Agriculture Policy by Natural Resources & Environment Committee (NREC), Natural Resources & Environment Committee (NREC), 2016.
[20] G. Malla, "Climate change and its impact on Nepalese agriculture.," J. Agric. Environ., vol. 9, p. 62–71., 2008.
[21] P. Krishnan, D. Swain and B. Bhaskar, "Impact of elevated co2 and temperature on rice yield and methos of adaptation as evaluated by crop stimulation studies," Agric Ecosyst Environ, vol. 122, pp. 233-242, 2007.
[22] P. Joshi, A. Gulati, S. Pratap, B. and L. Tewari, Agricultural Diversification in South Asia: Patterns, Detrminants and policy implication, MSSD Discussion paper No. 57., Washington, D.C., USA.: International Food Policy Research Institute., 2003.
[23] MoAF, National Action Plan Biodiversity Persistence and Climate Change. Ministry of Agriculture and Forestry, Thimphu: Royal Government of Bhutan, 2011b.
[24] MoAF, RNR SECTOR 11th Five Year Plan (2012-2108). Policy & Planning Division,Ministry of Agriculture & Forests., Thimphu.: Royal Government of Bhutan, 2014.
[25] Nayak, "Changing Cropping Pattern, Agricultural Diversification and Productivity in Odisha – A District-wise Study," Agricultural Economics Research Review, vol. 29 , no. 1, pp. 93-104. DOI: 10.5958/0974-0279.2016.00022.7, 2016.
[26] R. Regmi, S. Saha and M. Balla, Geospatial Analysis of Land Use Land Cover Change Modeling at Phewa Lake Watershed of Nepal by Using Cellular Automata Markov Model., 2014.
[27] B. Rimal, Dynamics of Land Cover Change in Kathmandu, Nepal, 2012.
[28] M. Ratheesh, "Making of a globalizes cropping pattern- A study of cropping pattern change in wandoor block, Kerala.," Research Forum: Intl. J. Soc. Sci., vol. 2, no. 2, pp. 19-26, 2014.
[29] UN, "The Least Developed Countries Report 2011," The Potential Role of South-South Cooperation for Inclusive and Sustainable Development, 2011. [30] National Statistic Bureau, Statistical Year Book of Bhutan for Year 2011, Bhutan: National Statistic Bureau, 2011, p. 252.
[31] M. Rosegrant, G. Nelson, A. Palazzo, I. Gray, C. Ingerstoll and R. Robertson, "Food security, farming, and climate change to 2050: scenarios, results, policy options.," Research Monograph.International Food Policy Research Institute, Washington, DC. doi:10:2499/9780896291867., 2010.
[32] V. Kakwagh, J. Aderonmu and A. Ikwuba, "Land fragmentation and agricultural development in tivland of benue state, Nigeria," Current Research Journal of Social Sciences, vol. 3, no. 2, pp. 54-58, 2011..