INVESTIGATION
Estimating the Distribution of Selection Coef
fi
cients
from Phylogenetic Data Using Sitewise
Mutation-Selection Models
Asif U. Tamuri,* Mario dos Reis,*,†and Richard A. Goldstein*,1
*Medical Research Council National Institute for Medical Research, London, NW7 1AA, United Kingdom, and†Department of
Genetics, Evolution, and Environment, University College London, London, WC1E 6BT, United Kingdom
ABSTRACT Estimation of the distribution of selection coefficients of mutations is a long-standing issue in molecular evolution. In addition to population-based methods, the distribution can be estimated from DNA sequence data by phylogenetic-based models. Previous models have generally found unimodal distributions where the probability mass is concentrated between mildly deleterious and nearly neutral mutations. Here we use a sitewise mutation–selection phylogenetic model to estimate the distribution of selection coefficients among novel andfixed mutations (substitutions) in a data set of 244 mammalian mitochondrial genomes and a set of 401 PB2 proteins from influenza. Wefind a bimodal distribution of selection coefficients for novel mutations in both the mitochondrial data set and for the influenza protein evolving in its natural reservoir, birds. Most of the mutations are strongly deleterious with the rest of the probability mass concentrated around mildly deleterious to neutral mutations. The distribution of the coefficients among sub-stitutions is unimodal and symmetrical around nearly neutral subsub-stitutions for both data sets at adaptive equilibrium. About 0.5% of the nonsynonymous mutations and 14% of the nonsynonymous substitutions in the mitochondrial proteins are advantageous, with 0.5% and 24% observed for the influenza protein. Following a host shift of influenza from birds to humans, however, wefind among novel mutations in PB2 a trimodal distribution with a small mode of advantageous mutations.
W
HEN a novel mutation appears in the genome of an organism, it may have three different effects on thefitness (w = 1 + s) of its carrier: The mutation may be deleterious (s,0), reducingfitness through reduced fertil-ity or survival rate. It may be neutral (s0), that is, having such a small effect on fitness that the fate of the mutant is mostly determined by random drift. Or the mutation may be advantageous (s.0), increasing thefitness of its carrier by increasing its fertility or survival in its environment. The frequency distribution of the different types of mutants and their associated selection coefficients (s, also known as
fitness effects) is a key issue in population genetics (Bustamante 2005; Eyre-Walker and Keightley 2007). The ultimate fate of a mutation, whether it will becomefixed or lost in a popula-tion, depends on the strength of selection and on the effect of random drift due tofinite population size. In fact, thefitness
effect s and the population numberNare so closely linked that normally the distribution is expressed in terms of the population scaled coefficientS= 2Ns.
Kimura (1968, 1983), in his neutral theory of molecular evolution, proposed that the dominant fraction (p2) of all novel mutations would be highly deleterious, with a minority fraction (p0 = 1 2 p2) being neutral. When organisms colonize a new habitat or are subject to environ-mental change, the opportunity for adaptive evolution would arise, and a fraction (p+ = 1 2p0 2p2) of novel mutations would be advantageous. The magnitudes of these fractions for a protein-coding gene would depend on the protein in question; functionally important or structurally constrained proteins (such as the histones) would be char-acterized by a very large fraction of deleterious mutations (p2 .. p0), while structurally less constrained proteins (such as the fibrinopeptides) would have a larger fraction of neutral mutations (p0.p2). Extensions to Kimura’s the-ory have been made, including considering the contribution of nearly neutral mutations to the evolutionary process (Ohta 1973, 1992; Kimura 1983). Under this latter exten-sion, there is a spectrum of nearly neutral mutations ranging Copyright © 2012 by the Genetics Society of America
doi: 10.1534/genetics.111.136432
Manuscript received November 3, 2011; accepted for publication December 18, 2011 Available freely online through the author-supported open access option. 1Corresponding author: Mathematical Biology, National Institute for Medical Research,
from slightly deleterious to slightly advantageous, with the neutrality of a given change dependent on the population size; evolutionary trajectories consist of a balance between slightly deleterious and slightly advantageous substitutions. Others have argued that, even under more typical condi-tions, adaptive substitutions would be frequent, the greater probability offixation compensating for their relative rarity among mutations (Gillespie 1994).
Akashi (1999) considered that under a neutral model the distribution ofSamong novel mutations could be bimodal, with the modes centered around highly deleterious and neu-tral mutations. During adaptive episodes, the distribution would have three modes, with a small additional mode cen-tered around advantageous mutations. Because deleterious mutations have a vanishingly small probability of becoming
fixed in a population, most substitutions (i.e., fixed muta-tions) would be neutral. In this case, the distribution of S
among substitutions would be unimodal and centered around neutral mutations. During an adaptive episode, natural selec-tion would drive many positively selected mutaselec-tions quickly tofixation. In this case, the distribution of substitutions would be bimodal, with modes centered around nearly neutral and advantageous substitutions.
While the effect of mutations can be studied experimen-tally, these studies are difficult to perform on higher organisms and too insensitive to observe any but the largest
fitness effects (Eyre-Walker and Keightley 2007). Due to these limitations, alternative approaches have been devel-oped that estimate the distribution of fitness effects from biological sequence data. Much of the work on estimation of the distribution of Sfrom DNA sequence data has been based at the population level (e.g., Sawyer and Hartl 1992; Bustamante et al.2002). These methods usually work with allele data from different individuals within a population, and the level of polymorphism within the population and the number offixed differences with an outgroup species are used to estimate the distribution. These methods look at the evolutionary process over relatively short periods of time and thus normally use approximate mutation models such as the infinite alleles model (Kimura 1969, 1983, p. 43). More recently, phylogenetic methods that look at the evolu-tionary process over longer periods of time have been used to estimate the distribution of selection coefficients (Nielsen and Yang 2003; Yang and Nielsen 2008; Rodrigue et al.
2010). Although these use more realistic mutation models than the population-based methods, they ignore polymor-phism and assume that all the observed differences among species arefixed. These two approaches sometimes result in different conclusions; population-based methods can yield an extremely large fraction of adaptive changes (Fayet al.
2001), especially inDrosophila(Sawyeret al.2003, 2007), while phylogenetic methods often result in more modest estimates of p+ (Nielsen and Yang 2003; Rodrigue et al. 2010). Similarly, population methods find the distribution of slightly deleterious mutations falling off leptokurtically, that is, more rapidly than exponentially (such as in a gamma
distribution with a ,1) (Eyre-Walker et al. 2006), while evolutionary models often yield a more rounded distribution (a.1) (Nielsen and Yang 2003; Rodrigueet al.2010). It is not clear whether these differences represent the different methodologies and the approximations that they make or the details of the particular organisms under study. Worry-ingly, the evolutionary models fail to yield a substantial amount of lethal mutations (Nielsen and Yang 2003; Rodrigueet al.2010) that would be expected on the basis of mutation experiments (Wlochet al. 2001; Sanjuanet al.
2004; Hietpas et al. 2011) and have been obtained by population-based studies (Piganeau and Eyre-Walker 2003; Yampolskyet al.2005; Eyre-Walkeret al.2006).
One of the difficulties in estimating the distribution of selection coefficients is the complex nature of the selective constraints, even within a single protein, representing a range of functional, structural, and physiological require-ments. Certain locations, such as those involved in protein functionality, may be invariant, while other locations may have a wide latitude in the amino acids compatible with that position. It is not only the magnitude of the selective constraints that vary from one location to another; one position may be constrained to hydrophobic residues, another constrained to residues that can take part in hydrogen bonding interactions, and a third requiring a certain degree offlexibility. The types of substitutions that can occur can be substantially different, even among locations that are changing at similar rates. Different approaches have addressed this issue to various degrees. For instance, Nielsen and Yang (2003) considered that the overall rate of substi-tutions could vary from one location to another, but con-sidered that this rate variation would affect all possible substitutions equally; that is, slowly varying locations were as unrestricted in the amino acids as rapidly varying loca-tions. Thorneet al.(2007) relaxed the standard assumption of independent sites, considering the selective constraints imposed by the need to maintain a stable well-defined struc-ture; this was estimated using protein structure prediction algorithms, despite their construction being motivated by a quite different problem. Rodrigue et al.(2010) adapted a mixture-model approach that grouped locations under similar selective constraints and developed more specific models for characterizing these different types of locations; each individual location was then represented by a mixture of these models (Koshi and Goldstein 1998). The available data determined the number of components in the mixture that could be justified.
resources than have previously been available. Here we ex-plore the use of this model in the estimation of the distribu-tion ofS. We are interested in assessing how the assumption of site-specificfitnesses may affect estimates of the shape of the distribution of Samong novel mutations and substitu-tions. We apply a modified version of their model to a data set of 12 mitochondrial proteins in 244 mammalian species. We also apply this model to a data set of a polymerase pro-tein from 401 influenza viruses isolated from avian and hu-man hosts. As the huhu-man viruses are the product of a host shift event from an avian host (Taubenberger et al.2005), this allows us to investigate the distribution of selection coefficients during a well-defined adaptive episode.
Methods
In the following discussion we assume a Wright–Fisher model of random genetic drift (e.g., Wright 1931). We work with idealized populations where the effective and the real population numbers are the same. Locations in a gene are assumed to evolve independently, and they do not interfere with each other. We assume the selection coefficients (s) involved in the model are small, so that simplifying approx-imations about relativefixation probabilities can be made. It is also assumed that mutation rates are sufficiently small in relation to the population size so that polymorphism is neg-ligible and locations remain fixed most of the time (Crow and Kimura 1970, pp. 442–445). The evolutionary process is viewed over long periods so the time from appearance to
fixation of a novel mutant is nearly instantaneous. These assumptions are necessary to simplify the mathematical treatment of the model as discussed below.
Basic model
We model the substitution rate of a codon location in a functional protein under the action of selection, mutation, and random drift as a time-continuous Markov process. We modify the model of Halpern and Bruno (1998), and we use the notation of Yang and Nielsen (2008). Let us write
I=i1i2i3andJ=j1j2j3for any two codons (I6¼J), whereik
is the nucleotide at the kth position of I. The Malthusian
fitness of codonI at location K of the gene is fI,K, so the
selection coefficient for a mutant that transforms IintoJis
sIJ,K=fJ,K2fI,K. We writeSIJ,K=FJ,K2FI,K= 2N(fJ,K2fI,K)
for the scaled selection coefficient, whereNis the effective chromosomal number andFI,Kis the scaledfitness. The
sub-stitution rate fromItoJ(I6¼J) at the location is
qIJ;K¼ (
mIJ
SIJ;K
12e2SIJ;K if SIJ;K6¼0 mIJ else;
(1)
where mIJis the neutral mutation rate, and S/(12e2s) is
the relativefixation probability of a selected mutation com-pared with a neutral one (Kimura 1983, Equation 3.14). If
the mutation is advantageous (SIJ.0), thenqIJ.mIJ, and if
the mutation is deleterious (SIJ,0), thenqIJ, mIJ. Thus
the effect of natural selection is to accelerate or reduce the rate of substitution compared to the neutral mutation rate. The qIJ,Kform the off-diagonal elements of a 64 ·64 rate
matrix (Q) whose diagonal elements areqII;K¼2 P
J6¼IqIJ;K.
The selection coefficients (SIJ,K) describe the effect of
selection on the amino acid at a given location K, due to the protein’s structure and function of the protein. This con-trasts with the model of Yang and Nielsen (2008), where the nonsynonymous to synonymous substitution rate ratio,v, is used to account for the effect of selection at the protein level. When modeling site-specific selection, the inclusion ofvis unnecessary.
The location-specific fitnesses (FI,K) can be modeled
at the amino acid or codon levels. We can write
FJ;K¼FJcoþFaaJ;K; where FJco is the fitness of J due to the
effect of selection on codon bias (e.g., Bulmer 1991) and
Faa
J;Kis thefitness of the particular amino acid at the location.
In this study, we assume that the selective constraints are dominated by selection on the amino acid and ignore the effect of selection on codon bias. Under this assumption
FJ;K¼FJaa;K.
Mutation at the nucleotide level: Consider a cycle of DNA replication occurring in a tiny time intervalt. The probabil-ity of observing a particular nucleotideimutating intoj(i6¼ j) during intervaltispij(t)≃gijt, wheregij($0) is the rate of
change i / j per time unit. The probability that i will remain unchanged is pii(t)≃ 1 +giit, where gii¼2
P igij:
Note that we are modeling the mutation of DNA before
natural selection takes place. The probability that a triplet
I of nucleotides will change into triplet J(I 6¼ J) is
pIJðtÞ ¼ Q
kpikjkðtÞ≃mIJt:Because the time interval tis very
small,pii(t)1, so we can ignore these probabilities in the product term and then solve for the mutation ratemIJto get
mIJ Q
k;ik6¼jkpikjkðtÞ
t ¼
Q
k;ik6¼jktgikjk
t ¼t
n21· Y
k;ik6¼jk gikjk;
(2)
wherenis the number of changing nucleotides.
The rate constantsgijcan be defined under any nucleotide
substitution model (e.g., Yang 1994). Here we use the HKY85 model (Hasegawa et al. 1985), wheregij¼nkp*j for
transi-tions and gij¼np*j for transversions, p*jð$0; P
jp*j ¼1Þ is
the equilibrium frequency of nucleotide j(achieved under no selection), kis the transition–transversion rate parame-ter, and nis a scaling constant. The mutation rateI /Jis thus
mIJ¼tn21nnknt Y
k;ik6¼jk
p*jk; (3)
wherentis the number of nucleotide transitions necessary to
transversion, then mIJ¼np*jk, while if they differ by two transitions at positions k and l, then mIJ ¼ntk2p*jkp
*
jl. We can now combine Equations 3 and 1 to get
qIJ;K¼ 0 @tn21
nnknt Y k;ik6¼jk
p*jk 1
A · SIJ;K
12e2SIJ;K: (4)
Parametertcontrols the rate at which multiple simulta-neous nucleotide substitutions are allowed to occur inI/J. For example, ift= 1021, then triple substitutions occur at a rate in the order of 1022compared to single substitutions. If t = 0, simultaneous substitutions are not allowed and Equation 4 reduces to a sitewise version of Equation 2 in Yang and Nielsen (2008). This multiple-substitutions model contrasts with that of Halpern and Bruno (1998), which is based on the probability of observing a random mutation in a nucleotide sequence at equilibrium.
We scale the substitution rates on the basis of the expected number of neutral mutations per site (Halpern and Bruno 1998). When there is no selection acting on the sequence, the neutral substitution rate is simply
q0
IJ¼mIJðI6¼JÞ;and the expected equilibrium frequency of J is p0
J ¼p*j1p *
j2p *
j3. We thus set n¼1= P64
I¼1 P64
J¼1
p0
ImIJðI6¼JÞso that the expected number of neutral
substi-tutions per codon location is one (i.e.,2PIp0Iq0II¼1).
Equation 4 describes a reversible process at the codon level. The proof of reversibility can be obtained by the same argument of Yang and Nielsen (2008) and it is not shown here. We note that the equilibrium frequency of codonJat locationKis
pJ;K¼
p*j1p * j2p
* j3e
FJ;K
z ; (5)
wherez¼P64J¼1p*j1p *
j2p *
j3e FJ;K.
Maximum-likelihood estimation: Equation 4 can be used to construct the transition probability matrix Pt =PIJ(t) = etQthat gives the probability of changeI /Jafter time t. This matrix can then be used to calculate the likelihood of a sequence alignment under a fixed tree topology, using established procedures (Felsenstein 1981; Yang 2006). The value of the model parameters that maximize the log-likelihood (ℓ) can then be found by numerical optimization.
Estimation of branch lengths:Estimation of branch lengths by maximum likelihood is computationally expensive. We estimate individual branch lengths using faster codon-based methods (e.g., Yang and Nielsen 2008), and the estimated tree withfixed topology is then used in the likelihood cal-culation of the model. During the calcal-culation, the branch lengths are multiplied by a constantcand the value of this constant is chosen to maximize the likelihood. Therefore, the final tree has branch lengths as the expected number ofneutralsubstitutions per site, that is, the number of sub-stitutions that would have accumulated if the sequence was
a pseudogene. We can convert the branch lengths to the expected number of substitutions per codon in the following manner: For location K, the expected substitution rate at equilibrium is lK¼
P
IpI;KqII;K. The average substitution
rate for the whole sequence is l¼PK P
IpI;KqII;K=Lc. For
a pseudogenel¼1, while a gene under purifying selection would havel,1. For a branch of lengthbneutral substitu-tions per site, l b represents the usual substitutions per codon.
Adjustable parameters:One of the mutational bias param-eters ðp*jÞ is redundant as the nucleotide equilibrium
fre-quencies obey the constraint P4j¼1p*j ¼1: Similarly, only
relative values of the fitness parameters (FI,K) matter, so
for each location, one of the fitness parameters can be set equal to zero. For a coding sequence with Lccodon loca-tions, the model has six mutation parameters (t,k,c, and 3 p*
j) and (20 2 1)Lc values of FI,K. Information from all
codon locations is used by the likelihood method to estimate the value of the six mutation parameters. The variance of these parameters decreases with increased sequence length. The amino acid fitnesses are location specific and can be reliably estimated only for alignments of many sequences under reasonable levels of divergence (see below).
Unobserved amino acids:Only a few amino acid types are usually seen within a given alignment location. For a codon
Jcoding for an unobserved amino acid, the maximum-likeli-hood estimate (MLE) ofFJ,Ktends to2N. (Exceptions may
exist when an unobserved amino acid may help facilitate substitutions between observed amino acids, such as pairs that cannot be connected by a single-base change.) Because
SIJ;K=ð12e2SIJ;KÞ/0 ifSIJ,K/2N, then the corresponding
columns of the rate matrix are zero. Rather than estimating
FJ,K for these unobserved amino acids, it is possible to fix
these values to2Nand collapse the rate matrix accordingly. For example, for a location where only two amino acids encoded by two codons each are observed, the correspond-ing rate matrix would be of size 4·4 and only 221 amino acid fitness parameters would be found by numerical opti-mization (Holder et al.2008). This approximation greatly reduces computing time.
Distribution of selection coefficients: We calculate the distribution of selection coefficients among novel mutations and among substitutions. At equilibrium, the proportion of expected mutations with a given value of S among all mutants at all locations is
m0ðSÞ ¼ P
K P
I6¼JpI;KmIJd
S2SIJ;K P
K P
I6¼JpI;KmIJ
; (6)
where d(S2SIJ,K) = 1 ifS 2SIJ,K¼0 and ¼0 otherwise.
The proportion among substitutions is
mðSÞ ¼ P
K P
I6¼JpI;KqIJ;Kd
S2SIJ;K P
K P
I6¼JpI;KqIJ;K :
Note that the scaled Malthusian fitness,F = 2Nf, is re-lated to the Darwinianfitness,w, byw=eF/2N(Crow and
Kimura 1970, p. 8). For the wild typew= 1 andF= 0, and for a lethal mutant,w= 0 andF=2N; this means that the distribution of selection coefficients ranges from2NtoN. In experimental studies Darwinian fitnesses are normally used, and the distribution of fitness effects ranges from
21 to N. For S ,, N, selection coefficients and fitness effects are nearly identical.
Following Li (1978) we define an I / J mutation (or substitution) as deleterious ifSIJ,K, 22, as nearly neutral
if 22 ,SIJ,K ,2, and as advantageous if 2 , SIJ,K. The
proportions of the three types of mutations arep2,p0, and
p+, respectively. For example, the proportion of advanta-geous mutations among all substitutions is
pþ¼ Z N
2
mðSÞdS: (8)
The uncertainty in the estimation of the distribution ofS
can be assessed by classical and parametric bootstrapping. In the classical bootstrap, we sample locations at random (with replacement) from the alignment and then we recal-culate the distribution using Equations 6 and 7 to generate confidence intervals. In the parametric bootstrap, synthetic data are generated using the ML estimates from the real data set, and then all parameters are reestimated for the synthetic data using exactly the same procedure as for the real data (including estimation of the tree topology, branch lengths, global mutation parameters, and fitnesses). When the parametric model offers an adequate description of the real data, both the classical and the parametric bootstrap lead to similar results (Felsenstein 2003, Chap. 20).
Software implementation
The software implementation of the model is available from http://mathbio.nimr.mrc.ac.uk/. The program is able to uti-lize multicore and distributed architectures, making the estimation of global and site-specific parameters computa-tionally tractable. Estimation of the parameters is done in three steps. As our program does not perform branch length estimation, we first optimize branch lengths under one of the codon substitution models available in other software. We use the FMutSel0 model in the program CODEML [PAML package (Yang 2007; Yang and Nielsen 2008)], us-ing the branch-by-branch optimization option and empirical codon frequencies (method = 1 and estFreq = 0 in the CODEML controlfile). Second, we use our program to esti-mate the global parameters (p*, k, t, and c), using the approximate method described above, where the substitu-tion rate matrix is collapsed by neglecting all unobserved residues. The MLEs of p* andkestimated by CODEML in the first step are used as starting values for the sitewise model in the second step. In the third step, the global parameters are fixed, but allfitnesses are reestimated, this
time relaxing the assumption that FI=2Nfor unobserved
amino acids. Likelihood calculation is thus performed using the full 64·64 substitution matrix. Thefitness parameter of the most common amino acid at each location isfixed toFI,L= 0,
while the otherfitness parameters are limited to220,F,
20. TheFvalues are estimated three times for each site, once with allF= 0, once withFof unobserved residues set to220, and once using random starting values (between23 and 3). We used the MLE with the highest likelihood.
Results and Discussion
Statistical properties of the model
Consistency and normality of fitness estimators: In the general case, the likelihood function L, the probability of observing datax= (xi) given parametersu= (ui), is given
by the joint densityL(x|u) =f(x1,x2, . . . ,xn|u). When the
data (xi) are independent (and under other regularity
con-ditions), the maximum-likelihood estimator ofu,^u, is shown to be consistent and asymptotically normally distributed (e.g., Stuartet al.1999, Chap. 18). When the data are not independent, consistency and asymptotic normality may not be guaranteed. Estimation of the fitnesses for a particular locationK, when the global parameters (t,k,c, andp*) are known, proceeds by maximizing a joint-likelihood function
L(x | u) = f(x1,x2, . . . ,xn| u), wherexi represents the
observed codon in species i for the given location. These data are not independent (they are correlated according to the underlying tree structure) and the asymptotic properties of thefitness estimators are unclear.
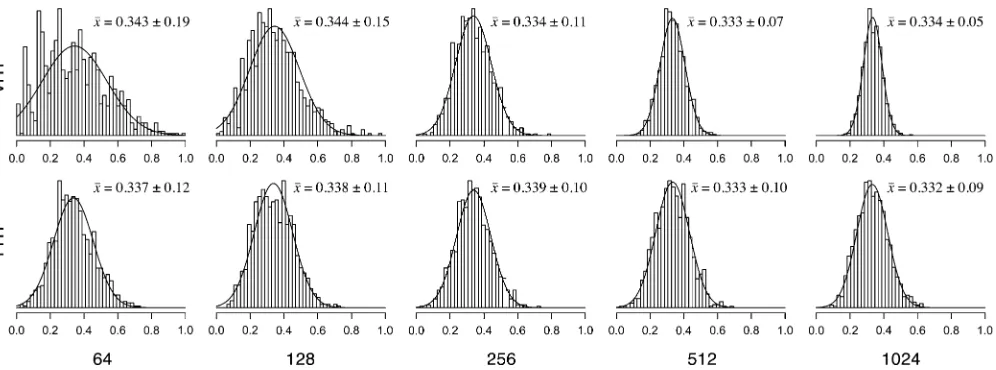
acids are set to zero. The global parameters are set tok= 2, p* = (0.25), and t = 0. For each setup 1000 sites are simulated, and p1 is then estimated by ML with global parametersfixed to their true values.
Figure 1 shows the results of the simulations for p1= 0.333 for both tree strategies and for 64–1024 taxa. In both cases, as the number of taxa is increased, the standard error ofp^1 decreases, and the sampling distribution increasingly resembles a normal distribution. The standard error decreases much faster for the VHT than for the FHT strategy. The VHT strategy resembles the case of a biologist who samples additional, more divergent outgroup taxa that root more deeply in the tree. The FHT strategy resembles the case of a biologist who samples additional, similar species from the same genera, thus adding a modest amount of extra information. Usingp1= 0.015 andp1= 0.5 and in-creasing the number of amino acids observed at the location (four, seven, or eight) yield the same trends (not shown). We note that under the invariance principle of ML,p^¼fð^FÞ
(Equation 5); therefore, estimatingp^ orF^leads to the same inference.
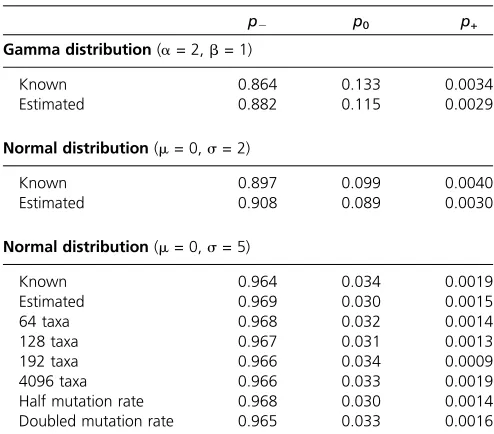
Distribution of selection coefficients for simulated data: As seen above, a large number of species of reasonable divergence are necessary to estimate the equilibrium fre-quencies (andfitnesses) for the codons within each location in a protein. A more important question is whether the distribution of selection coefficients can be estimated adequately for moderate data sets. We tested the robustness of estimates ofp2,p0, andp+by generating synthetic data sets that explore the breadth of the high-dimensional pa-rameter space of the model. Specifically, we studied how the estimates were affected by different distributions of site-specificfitnesses, varying the number of taxa and vary-ing mutation rates.
To ensure that the generated data sets were reasonably realistic, the set of observed residues at each site was
determined by randomly choosing a location from a mito-chondrial genome alignment (described below). One thou-sand sites were sampled and, for each site, those residues not observed in the sampled location had their fitnesses
fixed to2N. We then sampled the site-specific fitness for each residue from an underlying distribution. These are the “known”fitnesses. To explore the effect of different distri-butions of site-specific fitnesses (F), we considered three different distributions: (i) a gamma distribution with a= 2 andb= 1, (ii) a normal distribution withm= 0 ands= 2, and (iii) a normal distribution withm= 0 ands= 5. Each distribution of Fleads to a distinct distribution of S. Using these fitness values, we synthesized three data sets on the variable-height tree with 256 taxa.
To investigate the effect of varying sample sizes, we created data sets with 64, 128, and 192 taxa by sampling from the 256 sequences generated under the normal distribution (s= 5) in the previous step. For each sample, the tree topology and branch lengths were estimated. We also simulated data with the samefitnesses on a 4096-taxa tree to examine the benefit of having many more taxa.
To test the effect of increased or reduced mutation rate, two data sets were synthesized using the originalfitnesses drawn from the normal (s= 5) distribution. One set was generated with twice the mutation rate of the original 256-taxa tree, while the other had half the mutation rate of the original tree. The site-specificfitnesses for each of the nine generated sets of sequences were reestimated by ML using our model,
fixing the global parameters to their true values. As each synthesized data set was created with known global parameters [k= 2,p* = (0.25), andt= 0] and site-specific
fitnesses, the true proportion of deleterious, neutral, and advantageous mutations is also known. Table 1 shows the proportionsp2,p0, andp+of mutations calculated using the known fitnesses and compares them to the proportions obtained by estimating the fitnesses by ML. We found that in all cases the proportions of different types of mutations
can be readily estimated, as well as the general shape of the distribution ofS(not shown).
These tests demonstrated the difficulties of estimating thefitnesses for very deleterious mutations. For example, an amino acid with fitnessF=210 at a location has an equi-librium frequency ofp= 4.5·1025(see Equation 5). That is, we would expect to sample sequences from 22,000 species to see this amino acid once at the location. There-fore, it is not possible to distinguish between F=220 and
F =210, and we report the distribution ofSfrom210 to 10. However, our tests showed that with more taxa and more evolutionary time, we can recover more closely the shape of the curve for very deleterious mutations.
Analysis of real data
We use two real data sets to estimate the distribution of
fitness effects. Thefirst data set is an alignment of the 12 protein genes on the heavy strand of the mitochondrial genome of 244 placental mammal species. The alignment is constructed with PRANK (Loytynoja and Goldman 2008) and edited manually to removed small gappy regions at the end tails of some of the mitochondrial protein genes. The alignment is 3598 codons long. The tree topology is estimated by ML with RAxML, using the GTR+G model (Yang and Kumar 1996; Stamatakiset al.2005).
The second data set is an alignment of the PB2 gene of 401 influenza viruses isolated from 80 human and 321 avian hosts. The alignment is 759 codons long. The data set and the tree topology are described in Tamuriet al.(2009). The human viruses are monophyletic and they are thought to be the product of a shift from an avian (the natural reservoir) to a mammalian host sometime around 1882–1913, before the 1918 influenza pandemic (dos Reis et al.2009). The PB2 gene codes for a subunit of the virus polymerase complex. The polymerase genes seem to be involved in host adapta-tion, and there is evidence of several amino acid substitu-tions after the host shift (Taubenbergeret al.2005; dos Reis
et al.2011). Tamuriet al. (2009) identified 25 locations in PB2 where amino acid equilibrium frequencies are different between the viruses of the two hosts. To accommodate this observation, wefirst perform estimation of thefitnesses and global parameters for all residues in the protein. In a second step, a nonhomogeneous model that assumes different fi t-nesses for avian and human viruses isfitted to the 25 adap-tive locations. For example, consider a locationLthat is one of the 25 adaptive locations. The substitution rate between codonsIandJalong the branches linking the viruses found in the human host (H) is given by
qðIJH;LÞ¼ 8 > < > : mIJ
SðIJH;ÞL
12e2SðIJH;ÞL
forSðIJH;LÞ6¼0
mIJ else;
(9)
where SðIJH;LÞ¼Fð
HÞ
J;L2Fð
HÞ
I;L are the location- and host-specific
selection coefficients. Similarly, the substitution rate at the
adaptive locations and along the branches linking the avian viruses isqðIJA;ÞLand the avian-specificfitnesses areF
ðAÞ
J;L.
There-fore, for each adaptive location, 2 · 19 = 38 fitnesses parameters are estimated, 19 for each host. For a nonadap-tive location, qðIJH;ÞK¼qð
AÞ
IJ;K and Fð
HÞ
IJ;K¼Fð
AÞ
IJ;K. The distribution
of selection coefficients during evolution in the avian host is calculated using Equations 6 and 7, withpðIA;KÞ,qð
AÞ
IJ;K, andSð
AÞ
IJ;K.
For the distribution of selection coefficients following the host shift, we consider that, immediately after the host shift, the equilibrium frequencies ðpðIA;KÞÞ will reflect the
frequen-cies characteristic of avian viruses. At this point, however, the substitution ratesðqðIJH;KÞÞand the resultingfitnessesðF
ðHÞ
IJ;KÞ
will reflect the situation in the human host. Therefore, at this host shift instant we have
m0HSðSÞ ¼ P
K P
I6¼JpðAÞI;KmIJd
S2SðHÞIJ;K P
K P
I6¼JpAI;KmIJ
(10)
and
mHSðSÞ ¼ P
K P
I6¼JpðAÞI;Kq ðHÞ IJ;Kd
S2SH
IJ;K
P K
P
I6¼JpAI;KqHIJ;K
: (11)
Mammalian mitochondrial data: Figure 2 shows the dis-tribution offitness effects for novel mutations and substitutions for the mammalian mitochondria data set. The distribution of S among novel mutations clearly shows a multimodal distribution with one large peak around nearly neutral mutations (22 ,S , 22) and with another peak corre-sponding to highly deleterious mutations (S, 210). This second peak includes all mutations to amino acids that have not been observed at a given position and that therefore
Table 1 Monte Carlo simulation of the distribution of selection coefficients
p2 p0 p+
Gamma distribution(a= 2,b= 1)
Known 0.864 0.133 0.0034
Estimated 0.882 0.115 0.0029
Normal distribution(m= 0,s= 2)
Known 0.897 0.099 0.0040
Estimated 0.908 0.089 0.0030
Normal distribution(m= 0,s= 5)
Known 0.964 0.034 0.0019
Estimated 0.969 0.030 0.0015
64 taxa 0.968 0.032 0.0014
128 taxa 0.967 0.031 0.0013
192 taxa 0.966 0.034 0.0009
4096 taxa 0.966 0.033 0.0019
Half mutation rate 0.968 0.030 0.0014
have the minimum allowed value of FIJ,K = 220. Among
substitutions, a main peak centered at neutral mutations dominates, and no substantial fraction of highly deleterious or highly advantageous (10,S) substitutions is observed. We observe that66% of mutations are deleterious (S,
22), similar to the fraction of deleterious mutations esti-mated in humans (Fay et al. 2001; Eyre-Walker et al.
2002). Approximately 52% of the mutations are strongly deleterious (S , 210), comparable with that estimated for humans (Fay et al. 2001) as well as with the fraction of mutations observed to be lethal in experimental studies of vesicular stomatitis virus (Sanjuan et al. 2004) and yeast (Wlochet al.2001). We observe34% of mutations to be nearly neutral (22,S,2), again similar to the fraction estimated by population-based methods in other data sets (e.g., Eyre-Walker et al. 2002; Subramanian and Kumar 2006). Our estimates of the number of advantageous changes are modest, representing 0.5% of the nonsynony-mous mutations and 14% of the nonsynonynonsynony-mous substitu-tions. This is in rough agreement with a number of population-based studies of human evolution (e.g., Chim-panzee Sequencing and Analysis Consortium 2005), al-though some studies have estimated much larger fractions for humans (Fayet al.2001) andDrosophila(Sawyeret al.
2003, 2007). In general, our numbers correspond to what would be expected in a nearly neutral evolutionary model (Akashi 1999).
The estimated values for the global mutation parameters for the sitewise mutation selection model (swMutSel0)
fitted to the mammalian data are listed in Table 2. The
equilibrium base frequencies (p*) are similar but not iden-tical to those estimated with the FMutSel0 model by PAML, which neglects changes in base composition resulting from the selective constraints acting at the amino acid level. The value oft, representing the tendency for simultaneous multiple-base substitutions, indicates that the proportions of single, double, and triple changes are 99.4%, 0.58%, and 0.002% respectively. The optimization procedure is likely to result in an overestimation of the frequency of multiple mutations. Mutations between two amino acids that are not convertible by a single-base change (e.g., phenylalanine {TTT, TTC} to asparagine {AAT, AAC}) can result either through multiple-base changes or through a transient inter-mediate amino acid (such as tyrosine {TAT, TAC}). Our pro-cedure, as described above, estimates t while making the assumption that unobserved amino acids at any location, including possible intermediates, are incompatible with the selection constraints. This increases the requirement for multiple-base changes, increasing our estimate of t. Even with this bias, our estimation of the multiple-substitution rate is more modest than proportions derived from simpler codon models applied to a more comprehensive protein data set (Kosiolet al.2007) and may indicate either differences in the evolutionary process for mitochondrial DNA or biases that result when site-specific selective constraints are inad-equately modeled.
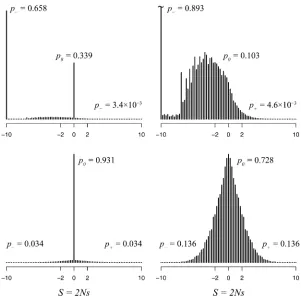
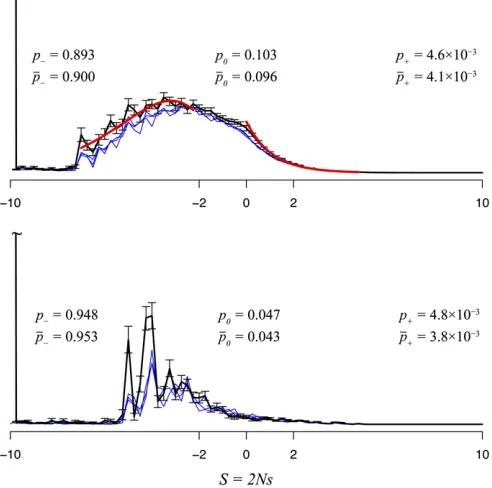
Influenza PB2 data: Figure 3 shows the distribution of
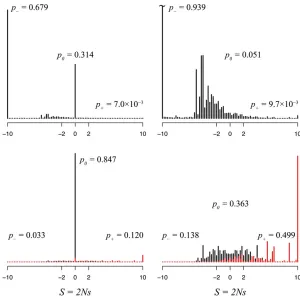
fitness effects for the influenza PB2 gene evolving in the avian host, and Figure 4 shows the distribution following
a well-defined adaptive event: the host shift to humans. As in the mitochondrial case, the distribution ofSamong mutations at adaptive equilibrium shows a multimodal distribution, with two main modes centered around nearly neutral (22,S,2)
and highly deleterious (S , 210) mutations. Among sub-stitutions, the distribution is dominated by a main peak cen-tered on neutral mutations. Interestingly, at the host shift event, wefind two well-defined peaks among substitutions,
Figure 3 Distribution of selection coefficients in the PB2 gene of influenza for avian viruses at adaptive equilibrium. Distributions are shown for all mutations (top left), non-synonymous mutations (top right), all substitutions (bot-tom left), and nonsynonymous substitutions (bot(bot-tom right).
one peak centered around neutral substitutions and another peak of highly advantageous substitutions (10 , S). We estimate that 12% of all substitutions and 50% of all non-synonymous substitutions are advantageous at the host shift event. These results are in agreement with an adaptive model as pointed out by Akashi (1999).
There has been much discussion in the literature about the relative contributions of nearly neutral and advanta-geous substitutions to the evolutionary process (i.e., Kimura 1983vs.Gillespie 1994). We suggest that the distribution of
Sis not constant in time but changes as organisms undergo adaptation through novel environments, with the relative contributions of nearly neutral and advantageous mutations dependent on the particular evolutionary scenario. It seems sensible to think that organisms go through phases of mostly neutral and mostly adaptive episodes.
Estimates for the influenza global mutation parameters are listed in Table 2. As for the mitochondrial data, the equilibrium base frequencies (p*) are similar but not iden-tical to those estimated with the FMulSel0 model. The value oft is of the same order of magnitude as that in the mito-chondrial case, indicating nearly the same proportions of single, double, and triple substitutions.
The parameteric form of the distribution of S: Extreme value theory has been used to show that, under a wide range of conditions, the distribution of selection coefficients for advantageous nonsynonymous mutations should be expo-nential (Gillespie 1984; Orr 2003). This prediction has been questioned on the basis of simulations of the evolution of RNA (Cowperthwaiteet al.2005), which yielded a distribu-tion with an overabundance of slightly adaptive mutadistribu-tions. As shown in Figure 5, we observe that the distribution of S
for advantageous mutations (S.0) matches an exponential distribution for both the mammalian and the influenza data; afit of the data between 0,S,5 tom0(S)exp(2bS) yields an exponent ofb= 0.924 (95% C.I.: 0.904–0.941) for mammals and b= 0.688 (95% C.I.: 0.630–0.733) for
in-fluenza, both in agreement with the results of extreme value theory.
Previous work analyzing intraspecies variation has sug-gested that the distribution of nonsynonymous deleterious mutations is leptokurtic, that is, having a faster initial fall-off followed by a longer tail, such as a gamma distribution with shape parameter a , 1. For example, Eyre-Walker et al.
(2006) analyzed human SNPs and fit the resulting nonsy-nonymous deleterious mutations to a gamma distribution witha= 0.23. In contrast, Nielsen and Yang (2003) carried out an interspecies study of primate mitochondrial proteins,
fitting a reflected gamma to the distribution of S. The reflected gamma distribution around zero is simply GR(S|
a,b) =G(2S|a,b) forS,0. They estimateda= 3.22, far from leptokurtic. Their model does not seem biologically realistic, as it suggests that different selective constraints at different locations in the protein act to reduce the overall substitution rate without affecting the resulting equilibrium distribution of amino acids at that location. Our distribution of selective coefficients with S , 0 clearly does not fit a reflected gamma distribution. We can, however, fit a reflected gamma distribution to the more limited range of moderately deleterious mutations (27 , S , 22) as shown in Figure 5. Over this range, our results more closely resemble the distribution obtained by Nielsen and Yang, with a = 3.601 (95% C.I.: 2.921–4.298) and b = 0.817 (95% C.I.: 0.643–0.987). The distribution of S for the
in-fluenza data is highly multimodal between27,S, 22, so we do not attempt tofit these data to a reflected gamma as in the mammalian case.
Although our results on nearly neutral and advantageous mutations and substitutions roughly correspond to previous results obtained with evolution-based methods, we observe a large fraction of highly deleterious mutations (S, 210), better matching the number of experimentally observed le-thal mutations. It is not surprising that previous analyses have had trouble estimating these highly deleterious muta-tions. Nielsen and Yang (2003) explicitly did not allow res-idues to be less or more favored at different locations, allowing changes only in the overall substitution rates; all substitutions are allowed at all but perfectly conserved loca-tions. Rodrigueet al.(2010) consider models of selection at each location that are mixtures of various components; this averaging effect reduces the ability to identify highly unfa-vorable amino acids at specific positions.
Uncertainties in the estimation of the distribution of S: We estimate the uncertainties and biases in our approach by using the classical and parametric bootstrap approaches. The classical bootstrap is used to generate error bars for the MLEs obtained from the real data, and the parametric bootstrap is used to generate simulated replicates of the
Table 2 Parameters in swMutSel0 and FMutSel0
swMutSel0 FMutSel0
Mammal data p^*ðT; C; A; GÞ 0.19, 0.27, 0.48, 0.06 0.17, 0.25, 0.52, 0.06
^
k 7.06 6.97
v — 0.05991
^
t 0.06257 —
Influenza data p^*ðT; C; A; GÞ 0.24, 0.20, 0.37, 0.20 0.23, 0.19, 0.37, 0.21
^
k 7.86 7.77
v — 0.062
^
distribution of S. The distributions of selective coefficients for nonsynonymous mutations for three parametric boot-strap data sets are compared with the results for the real data in Figure 5. As would be expected, the distributions are extremely similar for the neutral and advantageous substi-tutions. The general trends for the deleterious mutations are similar, although it appears that the calculations have a ten-dency to overestimate the magnitude ofSfor the deleterious mutations. This is not overly surprising, as this would result if thefitness of the extremely infrequent amino acids were underestimated and where their omission from the observed data reflects lack of evolutionary time rather than biological impossibility. This discrepancy may also be caused by our optimizing the tree branch lengths under the site-invariant FMutSel0 model rather than our sitewise model (Halpern and Bruno 1998). These differences have minimal effect on the fraction of mutations and substitutions that are delete-rious, neutral, and advantageous.
As might be expected given the close correspondence of the distributions for advantageous nonsynonymous muta-tions, the fit of the distribution of positive (0 , S , 5) selective coefficients for the three bootstrap data sets to an exponential yields values ðb¼0:953Þ similar to that obtained with the real mitochondrial data (b = 0.924).
Al-though there are differences in the reflected gamma distribu-tionfit for deleterious mutations for the mitochondrial data (a¼5:611 andb¼1:551 in contrast toa= 3.601 andb= 0.817), the results are still far from leptokurtic.
Comparison of the derived distribution of S with the results of parametric bootstrap simulations indicates that our phylogenetic analysis is able to successfully characterize the distribution of positive and near-neutral changes, al-though it overestimates the effect of deleterious mutations. The latter limitation is not unexpected: If an amino acid is rare or not observed at all at a given location, it is difficult to estimate how frequently it would be found at equilibrium. This is not an issue for representing substitutions, as these mutations would be extremely unlikely to occur.
Validations, assumptions, and limitations of the model
The model presumes that we know the true alignment for the selected data sets. Both the mammalian mitochondrial genes, which are well conserved, and influenza PB2 data sets produce good quality alignments. We also assume that the true phylogenetic tree is known. It has been shown, however, that small variations in tree topologies have minor impact on the parameters of phylogenetic models (Yang
et al. 1994), and we would not expect it to significantly affect our calculations of selection coefficients. Additionally, we tested the effect of tree topology uncertainty during our parametric bootstrap analysis by restimating the tree topol-ogy for each replicate. Although the trees estimated for the bootstrapped data sets were different, but similar, to that of the real data sets, they did not have a major impact on our estimated distribution ofS.
The analysis assumes that the various global and loca-tion-specific parameters are constants throughout the evo-lutionary process, with the exception of the host shift event explicitly included in the model for influenza PB2. The assumption that FIJ,K = 2NfIJ,K is a constant is based on
assumptions regarding both the population size Nand the
fitness parameters fIJ,K. Our analysis of the mitochondrial
data set and PB2 evolving in an avian host assumes that the amino acid distribution is at equilibrium with respect to fixed selective constraints, resulting in a distribution of selective effects for accepted mutations symmetric around zero. This assumption explicitly eliminates the role of changes in selection and population size in adaptive evolu-tion. Thefitness parameters could change because of a num-ber of effects. First, the structure, function, or physiological context of the protein could change. We have restricted these effects by considering mitochondrial proteins and PB2 from influenza. In neither case is there gene duplication that could lead to neofunctionalization that might result in changes in function or physiological context. We assume that the gene sequences are related by a single tree and recombination is absent, which is the consensus for both mammalian mitochondria (Lynch 2007) and influenza genes (Boniet al.2008). It is well recorded that structural change is extremely slow relative to sequence change
(Aronson and Royer 1994). This does not mean that local structures might not change; these changes are more likely to occur in the exposed loop sections of the proteins, where there is reduced selective constraint. These would, there-fore, likely result in small shifts in the neutral and near-neutral parts of the distribution of selection coefficients. Our analysis of the host shift effects on influenza PB2 dem-onstrates that changes in selective constraints can be explic-itly included in the modeling, especially if information about the shift can be obtained independently (as, for instance, when there is a change in the host of a pathogen at a specific branch of the phylogenetic tree). Models of selection that include changes in selective constraints in a more general manner (such as covarion models, see Galtier 2001; Penny
et al.2001) could be used, but would result in even greater computational complexity.
Second, the selection constraints at a location might change due to substitutions that occur in other regions of the protein, that is, through the invalidation of our assumption that different locations in the protein evolve independently. Significant effort has been made in looking for such correlations between the substitution processes at interacting sites. The difficulty of this problem, the rather few examples where such effects have been substantiated, and the overall success of the independent sites assump-tion compared with models where it is relaxed (Rodrigue
et al.2006; Kleinmanet al.2010; Lakneret al.2011) sug-gest that this effect is not likely to be large. This effect is even less likely to occur in the population-based models, as the timescales relevant to these studies are too short for many substitutions at other sites to occur. These popula-tion-based studies, however, are complicated by the inter-action between the population dynamics that occur at different locations, such as interference between fixations of different mutations (Hill and Robertson 1966; Stephan 1995; Kirby and Stephan 1996) and genetic hitchhiking (Maynard-Smith and Haigh 1974; Barton 2000). Simula-tions of these phenomena in computational models might allow further reconciliation of the results of these types of studies.
It must also be pointed out that codon locations in a protein are tightly linked, and this can have a sizeable effect on the estimation of selection coefficients (Bustamante 2005). Our condition of independence implicitly assumes free recombination among locations. This is certainly not true for either the influenza or the mammal data sets analyzed. In particular, selection coefficients involving highly advantageous mutations are expected to be underestimated (Bustamante 2005). It is not clear at present how phylogenetic models could incorporate the assumption of linkage, and most works that have attempted to estimate the distribution ofSfrom phylo-genetic data have worked with the assumption of indepen-dence (e.g., Nielsen and Yang 2003; Yang and Nielsen 2008; Rodrigue et al. 2010). Cartwright et al. (2011) studied the problem through simulation, but using a much simpler sub-stitution model.
The assumption thatFIJ,Kis a constant also assumes that
the effective population number has remained constant across lineages in the influenza and mammalian phylog-enies. Both humans and Drosophila have undergone recent increases in population and expansion into new evolutionary niches (Merriwetheret al.1991; Glinkaet al.2003), possibly explaining why some (e.g., Fay et al. 2001; Sawyer et al.
2003, 2007) but not all (Chimpanzee Sequencing and Anal-ysis Consortium 2005) population-based studies of these groups yield a higher degree of adaptive evolution than ob-served here. This assumption could be relieved at the expense of additional parameters in the model as suggested by Nielsen and Yang (2003). Influenza viruses evolving in humans pres-ent oscillating population numbers, with population bottle-necks of low genetic diversity at the beginning and end of epidemic seasons (Rambautet al.2008). Because our model currently does not incorporate these variations in effective population number in mammals and influenza, our estimated
fitnesses should be interpreted as averages over evolutionary timescales. We are currently exploring ways to incorporate variations in the effective population number in our model, but this is expected to be computationally challenging.
We also assume that the global mutation parameters (t,k, and thep*) do not vary across locations and across the tree. This assumption is unlikely to be strictly true; observed base compositions are known to be significantly different in different lineages. Differences in the equilibrium base com-position in influenza, in particular, have been documented by the authors (dos Reis et al.2009). Changes in the equi-librium base frequencies of, for instance, 10%, could result in similar changes in the estimate ofqIJ,K. However,qIJ,Kis
a steeply varying function ofFIJ,K, meaning that the changes
expected in the latter quantity would be small.
Although a likelihood-ratio test for the effect of selection on codon bias is significant in both data sets (P,,0.01) (for details of the test see Yang and Nielsen 2008), we estimate
fitnesses only at the amino acid level and explicitly ignore selection at the synonymous codon level, as estimation of the 60 global codon-level fitnesses would be a computa-tionally onerous task. In mammals, selection on codon usage is very weak (Yang and Nielsen 2008; dos Reis and Wernisch 2009); similarly, selection on codon bias is negligible in influenza viruses (Shackelton et al. 2006). For this reason, in these data sets, selection coefficients for codon bias are expected to be small and within the nearly neutral interval, with a negligible effect on the shape of the distribution of selection coefficients among novel mutations and substitutions.
Conclusion
specific advantages. Perhaps the biggest advantage is an ability to look at a different timescale, allowing us to explore the relationship between population variation and evolu-tionary change. Second, the range of different organisms that can be studied is greatly increased, compared with the relatively few species (e.g., humans,Drosophila, and yeast) where sufficient data exist to model population variation. Third, although both approaches involve making particular assumptions, the assumptions are different. Comparisons between results obtained with the different methods can provide insight into the nature and validity of these assump-tions. Fourth, the substitution model can be elaborated to include additional effects, such as changes in selective con-straints, population size, mutation rates at different points in evolution, or a relaxation of certain assumptions such as independence of sites. These extensions will become in-creasingly feasible as our sequence data, computational re-source, and biological understanding continue to increase. Fifth, it is not necessary to prespecify a functional form for the distribution of S. This means that it is possible to de-compose the evolutionary process and ask specific questions, such as the distribution of fitness effects involving changes to proline in helical regions of the protein.
This approach can be applied to any set of proteins with a sufficiently large and diverse set of homologs. The resulting distribution offitness effects constitutes a signature of the selective constraints and could provide interesting perspectives on individual proteins and their physiological context. The relative proportion of deleterious, neutral, and advantageous mutations could depend on the protein structure and function, reflecting such distinctions such as whether the protein is globular, membrane, or unstructured; cytosolic or excreted; signaling, enzymatic, or immunolog-ical; or solitary or a member of a larger gene family.
Finally, as has been pointed out by Thorneet al.(2007), the connection with population dynamics has the potential to reform our modeling of sequence evolution. Substitution models have predominantly been phenomenological, repre-senting the results of the evolutionary process (an accepted substitution) rather than the mechanics of how those results occurred. The opportunity to provide afirmer basis for these models by connecting it to population processes can result not only in better models, but also in ones that can be used to understand biological systems, populations, and evolu-tionary processes. The model presented here bridges the gap between population genetics and substitution models of sequence evolution. Since it was originally introduced by Halpern and Bruno (1998), this site-specific codon-based evolutionary model has seen limited use; the large number of adjustable parameters results in the need for a significant amount of sequence data as well as computational resour-ces. These two limitations are becoming less onerous. With the modifications described here, and with the availability of powerful parallel computing systems, it is now possible to obtain realistic estimates of the distribution of selection coefficients from phylogenetic data.
Acknowledgments
We thank Ziheng Yang and Simon Whelan for helpful discussions. A.U.T. is supported by a studentship grant from the Wellcome Trust, United Kingdom. M.d.R. is supported by a research grant awarded to Ziheng Yang by the Biotechnology and Biological Sciences Research Council, United Kingdom. R.A.G. is supported by the Medical Re-search Council, United Kingdom.
Literature Cited
Akashi, H., 1999 Within- and between-species DNA sequence var-iation and the‘footprint’of natural selection. Gene 238: 39–51. Aronson, H., and W. Royer, Jr., 1994 Quantification of tertiary structural conservation despite primary sequence drift in the globin fold. Protein Sci. 3: 1706–1711.
Barton, N. H., 2000 Genetic hitchhiking. Philos. Trans. R. Soc. Lond. B Biol. Sci. 355: 1553–1562.
Boni, M. F., Y. Zhou, J. K. Taubenberger, and E. C. Holmes, 2008 Homologous recombination is very rare or absent in hu-man influenza A virus. J. Virol. 82: 4807–4811.
Bulmer, M., 1991 The selection-mutation-drift theory of synony-mous codon usage. Genetics 129: 897–907.
Bustamante, C. D., 2005 Population genetics of molecular evolu-tion, pp. 63–99 in Statistical Methods in Molecular Evolution. Springer-Verlag, New York.
Bustamante, C. D., R. Nielsen, S. A. Sawyer, K. M. Olsen, M. D. Puruggananet al., 2002 The cost of inbreeding in Arabidopsis. Nature 416: 531–534.
Cartwright, R. A., N. Lartillot, and J. L. Thorne, 2011 History can matter: non-Markovian behavior of ancestral lineages. Syst. Biol. 60: 276–290.
Chimpanzee Sequencing and Analysis Consortium, 2005 Initial sequence of the chimpanzee genome and comparison with the human genome. Nature 437: 69–87.
Cowperthwaite, M. C., J. J. Bull, and L. A. Meyers, 2005 Distributions of beneficialfitness effects in RNA. Genet-ics 170: 1449–1457.
Crow, J. F., and M. Kimura, 1970 An Introduction to Population Genetics Theory. Harper & Row, New York.
dos Reis, M., and L. Wernisch, 2009 Estimating translational se-lection in eukaryotic genomes. Mol. Biol. Evol. 26: 451–461. dos Reis, M., A. J. Hay, and R. A. Goldstein, 2009 Using
non-homogeneous models of nucleotide substitution to identify host shift events: application to the origin of the 1918‘Spanish’ influenza pandemic virus. J. Mol. Evol. 69: 333–345.
dos Reis, M., A. Tamuri, A. J. Hay, and R. A. Goldstein, 2011 Charting the host adaptation of influenza viruses. Mol. Biol. Evol. 28: 1755–1767.
Eyre-Walker, A., and P. D. Keightley, 2007 The distribution of
fitness effects of new mutations. Nat. Rev. Genet. 8: 610–618. Eyre-Walker, A., P. D. Keightley, N. G. Smith, and D. Gaffney,
2002 Quantifying the slightly deleterious mutation model of molecular evolution. Mol. Biol. Evol. 19: 2142–2149.
Eyre-Walker, A., M. Woolfit, and T. Phelps, 2006 The distribution of fitness effects of new deleterious amino acid mutations in humans. Genetics 173: 891–900.
Fay, J. C., G. J. Wyckoff, and C. I. Wu, 2001 Positive and negative selection on the human genome. Genetics 158: 1227–1234. Felsenstein, J., 1981 Evolutionary trees from DNA sequences:
a maximum likelihood approach. J. Mol. Evol. 17: 368–376. Felsenstein, J., 2003 Inferring Phylogenies. Sinauer Associates,
Galtier, N., 2001 Maximum-likelihood phylogenetic analysis un-der a covarion-like model. Mol. Biol. Evol. 18: 866–873. Gillespie, J., 1984 Molecular evolution over the mutational
land-scape. Evolution 38: 1116–1129.
Gillespie, J., 1994 The Causes of Molecular Evolution. Oxford Uni-versity Press, London/New York/Oxford.
Glinka, S., L. Ometto, S. Mousset, W. Stephan, and D. De Lorenzo, 2003 Demography and natural selection have shaped genetic variation in Drosophila melanogaster: a multi-locus approach. Genetics 165: 1269–1278.
Halpern, A. L., and W. J. Bruno, 1998 Evolutionary distances for protein-coding sequences: modeling site-specific residue fre-quencies. Mol. Biol. Evol. 15: 910–917.
Hasegawa, M., H. Kishino, and T. Yano, 1985 Dating of the hu-man-ape splitting by a molecular clock of mitochondrial DNA. J. Mol. Evol. 22: 160–174.
Hietpas, R. T., J. D. Jensen, and D. N. Bolon, 2011 Experimental illumination of afitness landscape. Proc. Natl. Acad. Sci. USA 108: 7896–7901.
Hill, W. G., and A. Robertson, 1966 The effect of linkage on limits to artificial selection. Genet. Res. 8: 269–294.
Holder, M. T., D. J. Zwickl, and C. Dessimoz, 2008 Evaluating the robustness of phylogenetic methods to among-site variability in substitution processes. Philos. Trans. R. Soc. Lond. B Biol. Sci. 363: 4013–4021.
Kimura, M., 1968 Evolutionary rate at the molecular level. Nature 217: 624–626.
Kimura, M., 1969 The number of heterozygous nucleotide sites maintained in afinite population due to steady flux of muta-tions. Genetics 61: 893–903.
Kimura, M., 1983 The Neutral Theory of Molecular Evolution. Cam-bridge University Press, CamCam-bridge, UK/London/New York. Kirby, D. A., and W. Stephan, 1996 Multi-locus selection and the
structure of variation at the white gene of Drosophila mela-nogaster. Genetics 144: 635–645.
Kleinman, C. L., N. Rodrigue, N. Lartillot, and H. Philippe, 2010 Statistical potentials for improved structurally con-strained evolutionary models. Mol. Biol. Evol. 27: 1546–1560. Koshi, J. M., and R. A. Goldstein, 1998 Models of natural
muta-tions including site heterogeneity. Proteins 32: 289–295. Kosiol, C., I. Holmes, and N. Goldman, 2007 An empirical codon
model for protein sequence evolution. Mol. Biol. Evol. 24: 1464–1479.
Lakner, C., M. T. Holder, N. Goldman, and G. J. Naylor, 2011 What’s in a likelihood? Simple models of protein evolu-tion and the contribuevolu-tion of structurally viable reconstrucevolu-tions to the likelihood. Syst. Biol. 60: 161–174.
Li, W. H., 1978 Maintenance of genetic variability under the joint effect of mutation, selection and random drift. Genetics 90: 349–382.
Loytynoja, A., and N. Goldman, 2008 Phylogeny-aware gap place-ment prevents errors in sequence alignplace-ment and evolutionary analysis. Science 320: 1632–1635.
Lynch, M., 2007 The Origins of Genome Architecture. Sinauer Associates, Sunderland, MA.
Maynard-Smith, J., and G. Haigh, 1974 The hitch-hiking effect of a favourable gene. Genet. Res. 23: 23–35.
Merriwether, D. A., A. G. Clark, S. W. Ballinger, T. G. Schurr, H. Soodyall et al., 1991 The structure of human mitochondrial DNA variation. J. Mol. Evol. 33: 543–555.
Nielsen, R., and Z. Yang, 2003 Estimating the distribution of se-lection coefficients from phylogenetic data with applications to mitochondrial and viral DNA. Mol. Biol. Evol. 20: 1231–1239. Ohta, T., 1973 Slightly deleterious mutant substitutions in
evolu-tion. Nature 246: 96–98.
Ohta, T., 1992 The nearly neutral theory of molecular evolution. Annu. Rev. Ecol. Syst. 23: 263–286.
Orr, H. A., 2003 The distribution offitness effects among benefi -cial mutations. Genetics 163: 1519–1526.
Penny, D., B. J. McComish, M. A. Charleston, and M. D. Hendy, 2001 Mathematical elegance with biochemical realism: the co-varion model of molecular evolution. J. Mol. Evol. 53: 711–723. Piganeau, G., and A. Eyre-Walker, 2003 Estimating the distribu-tion of fitness effects from DNA sequence data: implications for the molecular clock. Proc. Natl. Acad. Sci. USA 100: 10335–10340.
Rambaut, A., O. G. Pybus, M. I. Nelson, C. Viboud, J. K. Tauben-bergeret al., 2008 The genomic and epidemiological dynamics of human influenza A virus. Nature 453: 615–619.
Rodrigue, N., H. Philippe, and N. Lartillot, 2006 Assessing site-interdependent phylogenetic models of sequence evolution. Mol. Biol. Evol. 23: 1762–1775.
Rodrigue, N., H. Philippe, and N. Lartillot, 2010 Mutation-selection models of coding sequence evolution with site-heterogeneous amino acid fitness profiles. Proc. Natl. Acad. Sci. USA 107: 4629–4634.
Sanjuan, R., A. Moya, and S. F. Elena, 2004 The distribution of
fitness effects caused by single-nucleotide substitutions in an RNA virus. Proc. Natl. Acad. Sci. USA 101: 8396–8401. Sawyer, S. A., and D. L. Hartl, 1992 Population genetics of
poly-morphism and divergence. Genetics 132: 1161–1176.
Sawyer, S. A., R. J. Kulathinal, C. D. Bustamante, and D. L. Hartl, 2003 Bayesian analysis suggests that most amino acid replace-ments in Drosophila are driven by positive selection. J. Mol. Evol. 57(Suppl. 1): S154–S164.
Sawyer, S. A., J. Parsch, Z. Zhang, and D. L. Hartl, 2007 Prevalence of positive selection among nearly neutral amino acid replacements in Drosophila. Proc. Natl. Acad. Sci. USA 104: 6504–6510.
Shackelton, L. A., C. R. Parrish, and E. C. Holmes, 2006 Evolutionary basis of codon usage and nucleotide composition bias in vertebrate DNA viruses. J. Mol. Evol. 62: 551–563.
Stamatakis, A., T. Ludwig, and H. Meier, 2005 Raxml-iii: a fast program for maximum likelihood-based inference of large phy-logenetic trees. Bioinformatics 21: 456–463.
Stephan, W., 1995 Perturbation analysis of a two-locus model with directional selection and recombination. J. Math. Biol. 34: 95–109.
Stuart, A., J. K. Ord, and S. Arnold, 1999 Advanced Theory of Statistics: Classical Inference and the Linear Model, Vol. 2A. Ar-nold, London.
Subramanian, S., and S. Kumar, 2006 Higher intensity of purifying selection on.90 mutation rates. Mol. Biol. Evol. 23: 2283–2287. Tamuri, A. U., M. dos Reis, A. J. Hay, and R. A. Goldstein, 2009 Identifying changes in selective constraints: host shifts in influenza. PLoS Comput. Biol. 5: e1000564.
Taubenberger, J. K., A. H. Reid, R. M. Lourens, R. Wang, G. Jin
et al., 2005 Characterization of the 1918 influenza virus poly-merase genes. Nature 437: 889–893.
Thorne, J. L., S. C. Choi, J. Yu, P. G. Higgs, and H. Kishino, 2007 Population genetics without intraspecific data. Mol. Biol. Evol. 24: 1667–1677.
Wloch, D. M., K. Szafraniec, R. H. Borts, and R. Korona, 2001 Direct estimate of the mutation rate and the distribution offitness effects in the yeastSaccharomyces cerevisiae. Genetics 159: 441–452.
Wright, S., 1931 Evolution in Mendelian populations. Genetics 16: 97–159.
Yampolsky, L. Y., F. A. Kondrashov, and A. S. Kondrashov, 2005 Distribution of the strength of selection against amino acid replacements in human proteins. Hum. Mol. Genet. 14: 3191–3201.
Yang, Z., 2006 Computational Molecular Evolution. Oxford Uni-versity Press, Oxford.
Yang, Z., 2007 PAML 4: phylogenetic analysis by maximum likeli-hood. Mol. Biol. Evol. 24: 1586–1591.
Yang, Z., and S. Kumar, 1996 Approximate methods for esti-mating the pattern of nucleotide substitution and the varia-tion of substituvaria-tion rates among sites. Mol. Biol. Evol. 13: 650–659.
Yang, Z., and R. Nielsen, 2008 Mutation-selection models of co-don substitution and their use to estimate selective strengths on codon usage. Mol. Biol. Evol. 25: 568–579.
Yang, Z., N. Goldman, and A. Friday, 1994 Comparison of models for nucleotide substitution used in maximum-likelihood phylo-genetic estimation. Mol. Biol. Evol. 11: 316–324.