R E S E A R C H A R T I C L E
Open Access
The Birth Satisfaction Scale-Revised
Indicator (BSS-RI)
Colin R. Martin
1, Caroline Hollins Martin
2and Maggie Redshaw
3*Abstract
Background:The current study sought to develop a short birth satisfaction indicator utilising items from the Birth Satisfaction Scale-Revised (BSS-R) for use as a brief measure of birth satisfaction and as a possible key performance indicator for perinatal service delivery evaluation.
Building on the recently developed BSS-R, the study aimed to develop a simplified version of the instrument to assess birth satisfaction easily that could work as a short evaluative measure of clinical service delivery for labour and birth that is consistent with policy documents, placing women at the centre of the birth experience. Methods:The six item Birth Satisfaction Scale-Revised Indicator (BSS-RI) was embedded within the 2014 National Maternity Survey for England. A random selection of mothers who had given birth in a two week period in England were surveyed three months after the birth. Using a two-stage design and split-half dataset, exploratory factor analysis, confirmatory factor analysis, internal consistency, convergent, divergent and known-groups discriminant validity evaluation were conducted in a secondary analysis of the survey data.
Results:Using this large population based survey of recent mothers the short revised measure was found to comprise two distinct domains of birth satisfaction,‘stress and emotional response to labour and birth’and‘quality of care’. The psychometric qualities of the tool were robust as were the indices of validity and reliability evaluated. Conclusion:The BSS-RI represents a short easily administered and scored measure of women’s satisfaction with care and the experience of labour and birth. The instrument is potentially useful for researchers, service evaluation and policy makers.
Keywords:Birth satisfaction, Birth satisfaction scale, Service evaluation
Background
Placing the childbearing woman at the forefront of care provision has been paramount to the development and evolution of maternity services since the landmark Changing Childbirth report [1]. Reinforcing this focus on woman-centred individualised care provision has been the National Service Framework for Children, Young People and Maternity Services[2] and“Maternity Matters: Choice, Access and the Continuity of Care in a Safe Service”[3]. Direct and broad based data collection on women’s experience of care has been evident over the intervening period in the UK, with, for example, national and trust-based surveys carried out and described in
‘Towards better births’ [4] and ‘Delivered with care’ [5], followed by more recent reports [6, 7]. National studies in North America have similarly focused on women’s views of their maternity care [8, 9].
Consistent with this focus on the perinatal health and well-being of childbearing women has been recognition of the need for the development of valid and reliable measures of factors which may impact both positively and negatively on women’s experience of maternity care. Validation of a perceptions checklist for care during labour and birth and of a worries scale about labour and birth indicated that these are useful measures [10, 11]. However, satisfaction has been recognised as a key spe-cific construct in this context [12]. The Birth Satisfaction Scale (BSS) [13] is a self-report questionnaire, targeting satisfaction with labour and birth. The original 30-item scale was developed from a thematic appraisal of the * Correspondence:[email protected]
3Policy Research Unit in Maternal Health and Care, National Perinatal
Epidemiology Unit, Nuffield Department of Population Health, University of Oxford, Oxford OX3 7LF, UK
Full list of author information is available at the end of the article
research literature, followed by the development of a 10-item short-form based on a psychometrically rigorous item-selection procedure [14]. Both forms are multi-dimensional and have been used in an international context, with validation for use in the USA [15], and translation and testing for use, for example, in a Greek population of women following childbirth [16, 17]. The BSS-R has recently been recommended as the instru-ment of choice for global use to assess maternal birth experience by inclusion in thePregnancy and Childbirth Standard Set[18].
The views of women as consumers of maternity care are key in improving services. While the BSS and BSS-R have been shown to measure psychological dimensions of satisfaction in a reliable way in both small [14–16, 19–21] and large populations [22, 23], the potential to refine and reduce the instrument further in order to function as an indicator of birth satisfaction has yet to be realised. The development of such an indicator presents a number of challenges, namely reducing the number of items and simplifying the approach to scoring, while maintaining validity and reliability.
Taking the 10-item BSS-R as a starting point, using a population based survey the present study sought to de-velop and then determine the factor structure, validity and reliability of the shorter BSS-R indicator (BSS-RI) in order to consider this adaptation of the scale for use more widely.
The following research questions were addressed:
(1) Is the BSS-RI a uni-dimensional or multidimensional measure?
(2) Is there concordance of the BSS-RI with the BSS-R in terms of a tri-dimensional factor structure? (3) Do the BSS-RI and sub-scales demonstrate
adequate internal consistency, divergent and convergent reliability?
(4) Does the BSS-RI and sub-scales demonstrate acceptable known groups discriminant validity?
Methods
Design and participants
Six items from the BSS-R were selected on the basis of a review of their content and higher factor loadings (2 from each domain) [14]. These were embedded within the 2014 National survey of women’s experience of ma-ternity care in England [7], the data set from which was used in the current study. The instrument was modified to a simplified 3-point (‘agree’,‘agree to some degree’,‘ dis-agree’) scoring system with higher scores representing greater birth satisfaction (range 0–2).
Women were selected randomly by the Office for National Statistics (ONS) from birth registration records
for births over a 2 week period (N= 10,002). Stratifica-tion of the sample was based on births in different geo-graphical areas (Government Office Regions). Women experiencing a perinatal loss and young mothers less than 16 years of age were excluded. The ONS mailed the questionnaire directly at 3 months postpartum using a tailored reminder system [24]. The study was approved by the National Research Ethics Service committee for Yorkshire and The Humber – Humber Bridge (REC reference 14/YH/0065.
A two-stage cross-sectional design was used. Accept-ing that selection of a small number of items from the BSS-R may influence the conceptual alignment of the measure, and in keeping with best practice in instrument development and evaluation [25–27], a random split-half data selection procedure was adopted. The first split-half dataset (dataset one) was used to determine underlying factor structure. The second split-half dataset (dataset two) was used to confirm factor structure veracity and conduct validity and reliability evaluation of the tool.
Statistical analysis
Exploratory factor analysis
Factor structure determination was accomplished using exploratory factor analysis (EFA). The multivariate and univariate characteristics of the dataset were evaluated prior to the EFA being conducted. Kline [28] advises that skew values >3 and kurtosis >10 are indicative of data non-normality. The Shapiro-Wilk’s test [29] offers a ro-bust method to evaluate item univariate normality. Multivariate normality was evaluated using the Mardia [30, 31] and the Henze-Zirkler [32] multivariate normal-ity tests. The principal axis factoring (PAF) factor extrac-tion procedure was selected in view of the ordered categorical characteristics of the scoring of BSS-R items [33] as recommended for non-normal data in factor ana-lysis [34]. The optimal number of factors was decided on the basis of parallel analysis [35] which is mathematically preferable to arbitrary determination by Eigenvalue threshold [36] and less ambiguous in interpretation compared to Cattell’s [37] scree plot. An oblimin factor rotation procedure was chosen, consistent with the like-lihood that underlying factors are likely to be correlated [33, 38]. A significant item-factor loading was set at a coefficient level of 0.30 to maximise identification of candidate factor items and a coefficient level of 0.50 set to indicate a significant item-factor loading, consistent with the method of Redshaw et al. [10]. Cross-loading items were rejected to pursue simple structure.
Confirmatory factor analysis
with dataset one, the multivariate and univariate nor-mality characteristics of dataset two were evaluated prior to the CFA [40, 41]. Model estimation proced-ure was predicated on the basis of data distributional characteristics [25, 26, 39]. Multiple goodness of fit tests [42] were used to evaluate the models: compara-tive fit index (CFI) values greater than 0.90 indicate an acceptable data fit and values of 0.95 and a good fit [43, 44]; root mean squared error of approximation (RMSEA) values of less than 0.05 indicate a good fit to the data [45]; the standardised root mean square residual (SRMR) values of less than 0.08 indicate accept-able model fit and 0.05 or less a good fit [25, 44, 46]. Model fit determination was considered almost exclusively on the basis of the indices outlined. Dataset two was simi-larly scrutinised regarding data distributional characteris-tics. Unweighted least squares (ULS) estimation would be used in the event of non-normal data and in view of the ordered-categorical scaling.
Divergent validity
Divergent validity was determined by correlating BSS-RI scale scores with the number of weeks pregnant at the time of antenatal booking appointment. It was predicted that there would be no significant relationship between BSS-RI scores and gestation at booking.
Convergent validity
Convergent validity was determined by correlating BSS-RI scale scores with a single overall question ask-ing women how satisfied they were with their mater-nity care during labour and birth. This question was scored on a 5-point scale with anchor points ranging from very satisfied to very dissatisfied. It was pre-dicted that there would be a significant correlation between BSS-RI scale scores and satisfaction question scores.
Known-groups discriminant validity
Consistent with the approach taken with the BSS-R [14], known groups discriminant validity was evaluated by examining score differences as a function of delivery type (normal vaginal delivery/interventional delivery). Interventional delivery was defined by either forceps, ventouse, planned or emergency caesarean section. BSS-RI scores were predicted to be significantly higher in the normal vaginal delivery group.
Internal consistency
An internal consistency analysis of the BSS-RI total and subscales was conducted to determine acceptabil-ity for clinical and research applications using Cronbach coefficient alpha with an alpha of 0.70 or greater being indicative of acceptable internal
reliability [26, 39]. Cronbach’s alpha has been criti-cised for underestimating scale reliability [47] and for limitations in intrinsic measurement properties to assess reliability [48]. Consequently, McDonald’s [49, 50] omega reliability statistic was also used to esti-mate the general factor saturation of the test. The omega hierarchical (ωh) test statistic [51] has been suggested to be preferable in assessing internal reli-ability by providing an estimate of total scale reliabil-ity. The calculation of hierarchical and total omega values are based on specified (number of factors found by EFA) factor models derived from a mini-mum residual factor analysis (MRFA) of the dataset. The Schmid-Leiman [52] transformation procedure is thereafter performed to generate general factor load-ings and from these, ωh and ωtare then estimated.
Equivalence of datasets
To determine the equivalence of the two datasets, a stat-istical comparison of Cronbach alpha between the EFA and CFA datasets was planned using the recognised method [53]. A statistical comparison of the correlations between BSS-RI total and associated sub-scales of EFA and CFA datasets are made using an approach which as-sumes data distributional normality, thus Pearson’sr ra-ther than Spearman’s rho correlations were used in the comparisons made [54]. The potential implications of non-normal data used with this approach are addressed in the discussion section.
Statistical analysis was conducted using the statistical software package R [55].
Results
Descriptive results
characteristics suggested each item to have a univariate normal distribution (skew <3, kurtosis <10), however, the Shapiro-Wilks (SW) test revealed statistically signifi-cant departure from univariate normality for all BSS-RI items (SW range = 0.53–0.81,p< 0.05).
Multivariate normality (dataset one)
The Henze-Zirkler multivariate normality test revealed a statistically significant departure from multivariate nor-mality (HZ = 63.64,p< 0.05) and the Mardia multivari-ate normality test confirmed evidence of significant multivariate skew and kurtosis, (Mardia skew = 8.28,
χ2
= 2894.05, p < 0.05, Mardia kurtosis = 60.77, Z = 29.85,p< 0.05).
Exploratory factor analysis
The Kaiser-Meyer-Olkin measure of sampling ad-equacy (0.74) and the Bartlett test of sphericity (χ2 = 3918.62, df = 15, p < 0.001) indicated the suitability of dataset one for EFA. Parallel analysis suggested two factors, an observation confirmed by examination of very simple structure (VSS) which revealed a complexity of 0.87 with two factors. Two correlated (r = 0.42) factors with Eigenvalues greater than 1. (2.84 & 1.27) accounted for 55% of the vari-ance in a common factor solution. Factor 1 loaded with the BSS-R stress experienced and women’s self-assessed attributes items and the second factor indi-cated by the two quality of care items. The item-factor loadings are shown in Table 2. The fit to data of the two-factor model was overall excellent (χ2(df=4) = 11.35, p = 0.02, CFI = 0.99, TLI = 0.99, RMSEA = 0.03 (0.01–0.05, 95% CI), RMSR = 0.01). Examination of the content of items loading on Fac-tor 1 suggested that this facFac-tor should be termed stress experienced.
Dataset two BSS-RI item characteristics
Examination of the means, standard deviations, skew and kurtosis of dataset one (Table 3). suggested each item to have a univariate normal distribution (skew <3, kurtosis <10), however, the SW test revealed
statistically significant departure from univariate nor-mality for all BSS-RI items (SW range = 0.52–0.80, p < 0.05).
Multivariate normality (dataset two)
The Henze-Zirkler multivariate normality test revealed a statistically significant departure from multivariate nor-mality (HZ = 66.13, p < 0.05). The Mardia multivariate normality test confirmed evidence of significant multi-variate skew and kurtosis, (Mardia skew = 7.82,
χ2
= 2743.20, p < 0.05, Mardia kurtosis = 60.78, Z = 28.51,p< 0.05).
Confirmatory factor analysis
CFA was conducted on dataset two specifying the two-factor model identified by EFA. A single-factor version of this model was also evaluated. The two-factor model was found to be an excellent fit to data across all fit statistics. The single-factor model, by contrast, offered a poorer fit to the data. The model fit characteristics of both models are shown in Table 4. A diagrammatic representation of the two-factor best-fit measurement model with standardised item-factor loadings is shown in Fig. 1.
Table 1Individual item distributional characteristics of the Birth Satisfaction Scale-Revised Indicator (BSS-RI) from split-half data set for exploratory factor analysis (N= 2096)
BSS-RI item BSS-RI Item content Domain Mean SD Skew Kurtosis
BSS-RI 1 I was not distressed at all during laboura Stress 1.00 0.77 −0.01 −1.31
BSS-RI 2 I felt very anxious during my labour and birthb Attributes 1.11 0.77 −0.20 −1.31
BSS-RI 3 I felt well supported by staff during my labour and birtha Quality 1.74 0.52 −1.91 2.77
BSS-RI 4 I found giving birth a distressing experiencea Stress 1.32 0.76 −0.62 −1.03
BSS-RI 5 I felt out of control during my birth experienceb Attributes 1.35 0.75 −0.66 −0.95
BSS-RI 6 The staff communicated well with me during labourb Quality 1.75 0.52 −1.95 2.94
Item scoring:a
items‘agree’= 2,‘agree to some degree’= 1,‘disagree’= 0;b
items‘agree’= 0,‘agree to some degree’= 1,‘disagree’= 2
Table 2Factor loadings of the Birth Satisfaction Scale-Revised Indicator (BSS-RI) following principal axis factoring (PAF) exploratory factor analysis (split-half dataset,N= 2096)
BSS-RI item BSS-RI item content Factor 1 Factor 2
BSS-RI 1 I was not distressed at all during labour 0.57 0.08
BSS-RI 2 I felt very anxious during my labour and birth
0.63 −0.03
BSS-RI 3 I felt well supported by staff during my labour and birth
0.02 0.85
BSS-RI 4 I found giving birth a distressing experience
0.79 −0.05
BSS-RI 5 I felt out of control during my birth experience
0.71 0.05
BSS-RI 6 The staff communicated well with me during labour
−0.02 0.83
Divergent validity
No significant correlation was observed between the BSS-RI total score and sub-scale scores and number of weeks pregnant at booking. The Spearman’s rho values are shown in Table 5.
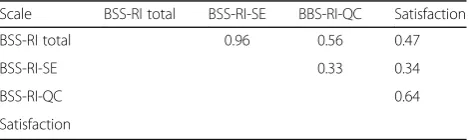
Convergent validity
Correlations between BSS-RI total and sub-scale scores and the overall satisfaction with labour and birth question were all found to be positively and sta-tistically significantly correlated and are summarised (Table 6), with significant positive Spearman’s rho correlations between BSS-RI total scale scores and BSS-RI sub-scales.
Known-groups discriminant validity
The mean BSS-RI total score and BSS-RI-SE and BSS-RI-QC sub-scale scores as a function of delivery type and accompanying effect sizes are shown in Table 7. The Mann-Whitney U test revealed highly statistically significant differences between groups in the direction predicted for the BSS-RI total score and the BSS-RI-SE sub-scale score. A statistically signifi-cant difference between groups was also observed in the BSS-RI-QC sub-scale score in the direction pre-dicted. Evaluation of Cohen’s d revealed a small-medium effect size for the BSS-RI total score and a medium effect size for the BSS-RI-SE sub-scale. The effect size of the BSS-RI-QC sub-scale was observed to be negligible.
Internal consistency
Calculated Cronbach’s alpha of the BSS-RI total scale, BSS-RI-SE and BSS-RI-QC sub-scales were 0.77, 0.78 and 0.82 respectively. Evaluation of item deletion ef-fects on Cronbach’s alpha at the BSS-RI total scale and BSS-RI-SE levels revealed no item redundancy (individual item removal reduced alpha). The BSS-RI-QC comprising just two items made item deletion evaluation inappropriate. The omega hierarchical stat-istic (ωh) was 0.61 and the omega total statistic (ωt) was 0.86.
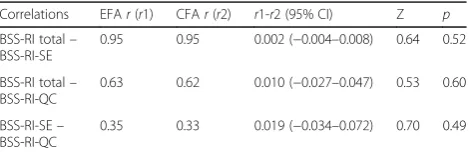
Equivalence of datasets
Comparisons between dataset one and dataset two in relation to Cronbach’s alpha for BSS-RI-Total and sub-scales are summarised in Table. 8. No statistically significant differences were revealed between the two datasets on Cronbach alpha estimations. Similarly, comparisons between datasets one and two BSS-RI-Total score and sub-scale correlations [54] are summarised (Table 9) and again reveal no evidence of statistically significant differences in the strength of associations between sub-scales and total scores. Table 3Individual item distributional characteristics and modified domain ascription of the Birth Satisfaction Scale-Revised Indicator (BSS-RI) from split-half data set for confirmatory factor analysis (N= 2105)
BSS-RI item BSS-RI item content Domain Mean SD Skew Kurtosis
BSS-RI 1 I was not distressed at all during labour Stress 0.97 0.79 0.05 −1.41
BSS-RI 2 I felt very anxious during my labour and birth Stress 1.15 0.78 −0.26 −1.30
BSS-RI 3 I felt well supported by staff during my labour and birth Quality 1.71 0.55 −1.76 2.14
BSS-RI 4 I found giving birth a distressing experience Stress 1.31 0.75 −0.59 −1.03
BSS-RI 5 I felt out of control during my birth experience Stress 1.31 0.76 −0.58 −1.05
BSS-RI 6 The staff communicated well with me during labour Quality 1.75 0.52 −2.00 3.11
Table 4Evaluation of the structure of the BSS-RI scale by CFA using the second split-half data set (N= 2105)
Model ULSχ2 d.f. CFI TLI RMSEA (90% CI) SRMR
1. Two-factor 16.11 8 0.99 0.99 0.02 (0.01–0.04) 0.04
2. Single factor 70.51 9 0.95 0.92 0.06 (0.04–0.07) 0.13
Note:Best model fit indices from confirmatory factor analysis indicated in bold. pvalues not calculated for ULS model
ULSunweighted least squares,RMSEAroot mean squared error of approximation, SRMRstandardised root mean square residual,CFIcomparative fit index, TLITucker–Lewis index
Discussion
The current study sought to develop a short, easily ad-ministered, valid and reliable birth satisfaction indicator selecting items from the BSS-R using the thematic framework supported by the original scale and the lit-erature [12–14, 56]. Multiple concepts underpin the construct of ‘satisfaction’with care, largely framed posi-tively in terms of having choice and control, being in-formed, taking part in decision-making and having good quality, kind and respectful care, with‘ dissatisfac-tion’being reflected in the negative, that is the absence of these characteristics [13, 57–59]. However, relatively few measures have been developed and appropriately tested with sufficiently large populations.
Benefitting from a large data set provided by a sam-ple of women drawn for a national maternity survey of women’s experience of maternity care, the study used an EFA-CFA two-stage instrument development process to evaluate a two-factor model comprising sub-scales of stress experienced during childbearing (BSS-RI-SE) and quality of care (BSS-RI-QC) from which a total score (BSS-RI-Total) can also be derived and used. The psychometric characteristics of the BSS-RI and associated sub-scales appear to be excellent based on known-groups, discriminant valid-ity, divergent validvalid-ity, convergent validity and internal consistency measurement characteristics. Both data-sets also appear to be equivalent in terms of key indi-ces of internal consistency (Cronbach’s alpha) and
correlations between sub-scales and total scores. Omega total (ωt) also revealed good total scale reli-ability characteristics. Thus the BSS-RI satisfies most established criteria for such a measure.
Notwithstanding the psychometric properties of the BSS-RI as described, there is a tension between the two-factor model arising from the BSS-RI, the three-factor model of the BSS-R and the three-dimensional thematic structure which underpinned the original scale. The implications in terms of the assessment of satisfaction need to be considered. Appraisal of the findings of the EFA and CFA and scrutiny of the 6-items which comprise the BSS-RI indicate an unam-biguous two-factor structure with no evidence of cross-loading items or a ‘third factor’ that might be identified. Thus from a psychometric perspective, there is a compelling rationale for the BSS-RI to be considered as comprising two sub-scales. The data driven simplification is credible and the short six item BSS-RI represents a reframing of the conceptual model, specific and exclusive to this short-form.
With a larger pool of items and a broader response range the longer BSS and BSS-R provide a more nu-anced assessment of women’s satisfaction with labour and birth care [14, 60], the BSS-R being the exem-plar in terms of psychometric measurement charac-teristics [17, 21, 23]. The shorter BSS-RI, with high face validity, tested on a large population of women who have recently given birth, while having a dis-tinct function as an indicator, clearly relates to the original conceptual content of the scale [13, 14, 56]. Our findings indicate that the BSS-RI is multidimen-sional, with the data demonstrating relatedness be-tween the scales, thus providing a rationale for the use of sub-scale and total scores in measuring birth satisfaction.
Strengths and limitations
A strength of the study was the relatively large sam-ple size and population based sampling which facili-tated the analyses conducted. This was the first study to conduct an EFA with BSS items to determine underlying factor structure. Previous insights were based on thematic content and CFA. Since the items of the BSS-RI comprised only 60% of the item pool of the BSS-R and 20% of the item pool of original scale, an EFA was essential to describe fundamental aspects of the instruments factor structure. While the brevity of the measure and ease of completion are a practical benefit in terms of response burden, the findings reveal the BSS-RI to exhibit marked devi-ation from univariate and multivariate normality, pos-sibly as a consequence of simplification of the response structure. We would thus recommend the Table 6Spearman’s rho correlations between Birth Satisfaction
Scale-Revised Indicator (BSS-RI) total score, sub-scale scores and single item satisfaction question
Scale BSS-RI total BSS-RI-SE BBS-RI-QC Satisfaction
BSS-RI total 0.96 0.56 0.47
BSS-RI-SE 0.33 0.34
BSS-RI-QC 0.64
Satisfaction
Key to sub-scales:quality of care provision(BSS-RI-QC), andstress experienced during labour(BSS-RI-SE). Note: Correlations with satisfaction question based onN= 2089 due to missing data (N= 16)
All correlations statistically significant atp< 0.01 (BSS-RIN= 2105)
Table 5Spearman’s rho correlations between Birth Satisfaction Scale-Revised Indicator (BSS-RI) total scores and sub-scale scores and number of weeks pregnant at booking (N= 2022)
Scale Weeks preg.Rho 95% CI p
BSS-RI total −0.01 −0.06 - 0.03 0.60
BSS-RI-SE −0.01 −0.05 - 0.04 0.71
BSS-RI-QC −0.02 −0.06 - 0.03 0.43
Key to sub-scales:quality of care provision(BSS-RI-QC), andstress experienced during labour(BSS-RI-SE)
use of non-parametric statistical approaches when analysing BSS-RI data.
A potential limitation of the study concerns the num-ber of items comprising the BSS-RI-QC sub-scale. It is suggested that a minimum number of items per factor should be three [28, 61], one rationale for this recom-mendation being estimation problems which may occur when sample size is small [28]. It was noted that not only was the two-factor model evaluated effectively with the large sample size used in the current study but also the appeal of a short measure such as the BSS-RI within the context of survey study designs where sample size is anticipated to be large. Additionally, sub-scales compris-ing two items are known to be acceptable where the items comprising the sub-scale are strongly related [14, 62] and the measure is multi-dimensional thus allowing identification with a two-item factor [61].
The response rate to the survey was modest, though similar to other surveys of women concerning their ma-ternity care [6]. However, confidence in the findings is supported by the psychometric properties shown by the BSS-RI and the lack of variation between the two data-sets, endorsing the view that women were responding to the instrument in characteristically similar fashion. A caveat in terms of the measurement aspects of the BSS-RI was that the survey design from which the data was derived did not provide an opportunity to evaluate test-retest reliability. Further evaluative work on the BSS-RI could involve assessing test-retest reli-ability, however, women’s views do change over time and the interval used may be critical [12, 59]. An additional strength of the current study compared to previous psychometric evaluations of the BSS and its derivatives is the availability of a convergent reliability metric against which to validate the BSS-RI. Previous
studies have highlighted issues in this regard and the current study is the first to report convergent validity characteristics with respect to a satisfaction-orientated measure which remains distinct in content from the items that comprise the BSS-RI.
The measure developed, focusing on labour and birth as it does, excludes women’s antenatal and post-natal experience of maternity care. Nor does it aim to address issues of choice, information, continuity and involvement in decision-making. More broadly based analyses have the potential to facilitate the develop-ment of a measure, of which the BSS-RI could be a component, to be used across the different phases of maternity care.
Conclusion
The current study aimed to develop a brief birth sat-isfaction indicator from the BSS-R and to establish the psychometric properties of the new measure in terms of factor structure, validity and reliability. The resulting instrument was found to have excellent psy-chometric qualities, with minimal burden to the women responding, while at the same time providing information that is psychologically meaningful and service delivery relevant.
This psychometrically robust indicator appears to be useful in assessing birth satisfaction, offering an evidence-based key performance indicator (KPI) for maternity services. It could be used in a range of study designs and situations, including local trust or board based surveys, serving as an effective way of monitoring women’s satisfaction with their intrapar-tum care, where brevity and ease of administration and scoring are key.
Table 8Internal consistency comparison of total and sub-scale items from EFA (N= 2096) and CFA (N= 2105) split-half datasets
Scale EFAα(95% CI) CFAα(95% CI) F p
BSS-RI total 0.77 (0.76–0.79) 0.77 (0.76–0.79) 1.00 0.92
BSS-RI-SE 0.78 (0.76–0.79) 0.78 (0.77–0.80) 1.03 0.47
BSS-RI-QC 0.82 (0.81–0.84) 0.82 (0.81–0.84) 1.00 1.00
Note:df1 = 2095, df2 = 2104. Confidence intervals calculation based onαto three decimals
Table 7Mean Birth Satisfaction Scale-Revised Indicator (BSS-RI) total scores and sub-scale scores as a function of delivery type (N= 1268, InterventionalN= 808)
Variable Normal Non-normal Mann-Whitney U p Cohen’sd d95% CI Effect
BSS-RI total 8.71 (2.75) 7.42 (2.93) 645,140 <0.001 0.46 0.37–0.55 Small
BSS-RI-SE 5.21 (2.29) 4.03 (2.40) 656,180 <0.001 0.50 0.42–0.59 Medium
BSS-RI-QC 3.50 (0.95) 3.39 (1.04) 538,220 0.01 0.11 0.02–0.20 Negligible
(Standard deviations in parentheses)
Table 9Comparison of Birth Satisfaction Scale-Revised Indicator (BSS-RI) total and sub-scale Pearson’srcorrelation coefficients from EFA (N= 2096) and CFA (N= 2105) split-half datasets
Correlations EFAr(r1) CFAr(r2) r1-r2 (95% CI) Z p
BSS-RI total– BSS-RI-SE
0.95 0.95 0.002 (−0.004–0.008) 0.64 0.52
BSS-RI total– BSS-RI-QC
0.63 0.62 0.010 (−0.027–0.047) 0.53 0.60
BSS-RI-SE– BSS-RI-QC
0.35 0.33 0.019 (−0.034–0.072) 0.70 0.49
Abbreviations
BSS:Birth Satisfaction Scale; R: Birth Satisfaction Scale Revised; BSS-RI: Birth Satisfaction Scale Revised Indicator; CFA: Confirmatory factor analysis; EFA: Exploratory factor analysis; HZ: Heinz Kirkler; MRFA: Minimum residual factor analysis; ONS: Office for National Statistics; RMSEA: Root mean squared error of approximation; SRMR: Standardised root mean square residual; SW: Shapiro Wilks; ULS: Unweighted least squares
Acknowledgements
Many thanks are due to the all women who responded and participated in the survey.
Staff at the Office for National Statistics drew the sample and managed the mailings. Jane Henderson prepared the original survey data.
Funding
The survey was funded by the UK Department of Health Policy Research Programme. The views expressed in this report are those of the authors and do not necessarily reflect the views of the Department of Health.
Availability of data and materials
The questionnaire used and datasets analysed during the current study are not publicly available due but are available from the corresponding author on reasonable request.
Authors’contributions
MR designed the national maternity survey. MR and CM selected the six items from the BSS-R. CHM co-designed the original BSS measure. CHM and CM developed the BSS-R. CM and MR planned the analysis, CM conducted the analysis of the data on the indicator measure and drafted the manuscript. All authors provided feedback on the analysis and the manuscript. All authors have read and approved the final manuscript.
Ethics approval and consent to participate
The study was approved by the National Research Ethics Service committee for Yorkshire and The Humber–Humber Bridge (REC reference 14/YH/0065. Consent was assumed on questionnaire completion and return.
Consent for publication
Not applicable.
Competing interests
All authors declare that there are no conflicts of interest.
Publisher’s Note
Springer Nature remains neutral with regard to jurisdictional claims in published maps and institutional affiliations.
Author details
1Faculty of Society and Health, Buckinghamshire New University, Uxbridge,
UK.2School of Nursing, Midwifery and Social Care, Edinburgh Napier University, Edinburgh, UK.3Policy Research Unit in Maternal Health and Care, National Perinatal Epidemiology Unit, Nuffield Department of Population Health, University of Oxford, Oxford OX3 7LF, UK.
Received: 8 March 2016 Accepted: 21 August 2017
References
1. Department of Health. Changing childbirth: report of the expert maternity group (Cumberlege report). London: HMSO; 1993.
2. Department of Health. The National Service Framework for children, young people and maternity services. London: Department of Health; 2004. 3. Department of Health. Maternity matters: choice, access and the continuity
of Care in a Safe Service. London: Department of Health; 2007. 4. The Care Quality Commission: Towards Better Births. London; 2008. 5. Redshaw M, Heikkila K. Delivered with care: a National Survey of Women’s
experience of maternity care. Oxford: National Perinatal Epidemiology Unit, University of Oxford; 2010.
6. The Care Quality Commission. National Findings from the 2013 Survey of Women’s experiences of maternity care. London: Care Quality Commission; 2013.
7. Redshaw M, Henderson J. Safely delivered: a National Survey of Women’s experience of maternity care. Oxford: National Perinatal Epidemiology Unit, University of Oxford; 2015.
8. Declercq ER, Sakala C, Corry MP, Applebaum S. Listening to Mothers II: Report of the Second National U.S. Survey of Women's Childbearing Experiences: Conducted January–February 2006 for Childbirth Connection by Harris Interactive(R) in partnership with Lamaze International. J Perinat Educ. 2007;16:9–17.
9. Dzakpasu S, Kaczorowski J, Chalmers B, Heaman M, Duggan J, Neusy E. The Canadian maternity experiences survey: design and methods. J Obstet Gynaecol Can. 2008;30:207–16.
10. Redshaw M, Martin CR. Validation of a perceptions of care adjective checklist. J Eval Clin Pract. 2009;15(2):281–8.
11. Redshaw M, Martin CR, Rowe R, Hockley C. The Oxford worries about labour scale: Women’s experience and measurement characteristics of a measure of maternal concern about labour and birth. Psychol Health Med. 2009;14:354–66.
12. Sawyer A, Ayers S, Abbott J, Gyte G, Rabe H, Duley L. Measures of satisfaction with care during labour and birth: a comparative review. BMC Pregnancy Childbirth. 2013;13:108.
13. Hollins Martin CJ, Fleming V. The birth satisfaction scale. Int J Health Care Qual Assur. 2011;24(2):124–35.
14. Hollins Martin CJ, Martin CR. Development and psychometric properties of the birth satisfaction scale-revised (BSS-R). Midwifery. 2014;30(6):610–9. 15. Barbosa-Leiker C, Fleming S, Hollins Martin CJ, Martin CR. Psychometric
properties of the birth satisfaction scale-revised (BSS-R) for US mothers. J Reprod Infant Psychol. 2015;33(5):504–11.
16. Vardavaki Z, Hollins Martin CJ, Martin CR. Construct and content validity of the Greek version of the birth satisfaction scale (G-BSS). J Reprod Infant Psychol. 2015;33(5):488–503.
17. Martin CR, Vardavaki Z, Hollins Martin CJ. Measurement equivalence of the birth satisfaction scale-revised (BSS-R): further evidence of construct validity. J Reprod Infant Psychol. 2016;34(4):394–402.
18. International Consortium for Health Outcomes Measurement. Pregnancy and Childbirth Standard Set and Reference Guide. 2016. http://www.ichom. org/medical-conditions/pregnancy-and-childbirth/.
19. Cetin FC, Sezer A, Merih YD. The birth satisfaction scale: Turkish adaptation, validation and reliability study. North Clin Istanb. 2015;2(2):142–50. 20. Hinic K. Predictors of breastfeeding confidence in the early postpartum
period. J Obstet Gynecol Neonatal Nurs. 2016;45(5):649–60.
21. Burduli E, Barbosa-Leiker C, Fleming S, Hollins Martin CJ, Martin CR. Cross-cultural invariance of the birth satisfaction scale-revised (BSS-R): comparing UK and US samples. J Reprod Infant Psychol. 2017;35(3):248–60. 22. Fleming SE, Donovan-Batson C, Burduli E, Barbosa-Leiker C, Hollins Martin
CJ, Martin CR. Birth satisfaction scale/birth satisfaction scale-revised (BSS/ BSS-R): a large scale United States planned home birth and birth centre survey. Midwifery. 2016;41:9–15.
23. Martin CR, Hollins Martin CJ, Burduli E, Barbosa-Leiker C, Donovan-Batson C, Fleming SE. Measurement and structural invariance of the US version of the birth satisfaction scale-revised (BSS-R) in a large sample. Women and Birth. 2016. https://doi.org/10.1016/j.wombi.2016.11.006.
24. Dillman DA. Mail and internet surveys: the tailored design method. 2nd ed. New York: Wiley; 2007.
25. Byrne BM. Structural equation modeling with AMOS: basic concepts, applications and programming. 2nd ed. New York: Routledge/Taylor and Francis Group; 2010.
26. Kline P. A psychometrics primer. London: Free Association Books; 2000. 27. Martin CR, Savage-McGlynn E. A‘good practice’guide for the reporting of
design and analysis for psychometric evaluation. Journal of Reproductive and Infant Psychology. 2013;31(5):449–55.
28. Kline RB. Principles and practice of structural equation modeling. 2nd ed. New York: Guilford Press; 2005.
29. Shapiro SS, Wilk MB. An analysis of variance test for normality (complete samples). Biometrika. 1965;52(3–4):591–611.
30. Mardia KV. Measures of multivariate skewness and kurtosis with applications. Biometrika. 1970;57:519–30.
31. Mardia KV. Applications of some measures of multivariate skewness and kurtosis in testing normality and robustness studies. Sankhyā: The Indian Journal of Statistics, Series B. 1974;36(2):115–28.
33. Costello AB, Osborne J. Best practices in exploratory factor analysis: Four recommendations for getting the most from your analysis. Pract Assess Res Eval. 2005;10(7):1–9.
34. Fabrigar LR, Wegener DT, MacCallum RC, Strahan EJ. Evaluating the use of exploratory factor analysis in psychological research. Psychol Methods. 1999;4(3):272–99.
35. Horn JL. A rationale and test for the number of factors in factor analysis. Psychometrika. 1965;30:179–85.
36. Kaiser HF. The application of electronic computers to factor analysis. Educational and Psychological Measurement. 1960;20:141–51. 37. Cattell RB. The scree test for the number of factors. Multivar Behav Res.
1966;1:245–76.
38. West R. Computing for psychologists. Chur: Harwood; 1991.
39. Kline P. The handbook of psychological testing. London: Routledge; 1993. 40. Flora DB, Curran PJ. An empirical evaluation of alternative methods of
estimation for confirmatory factor analysis with ordinal data. Psychol Methods. 2004;9(4):466–91.
41. Lubke GH, Muthén BO. Applying multigroup confirmatory factor models for continuous outcomes to Likert scale data complicates meaningful group comparisons. Struct Equ Model. 2004;11(4):514–34.
42. Bentler PM, Bonett DG. Significance tests and goodness of fit in the evaluation of covariance structures. Psychol Bull. 1980;88:588–606. 43. Hu LT, Bentler PM. Evaluating model fit. In: Structural Equation Modelling:
Concepts, Issues and Applications. Edn. Edited by Hoyle RH. Thousand Oaks, CA: Sage; 1995.
44. Hu LT, Bentler PM. Cutoff criteria for fit indexes in covariance structure analysis: conventional criteria versus new alternatives. Struct Equ Model. 1999;6:1–55. 45. Schumacker RE, Lomax RG. A Beginner's guide to structural equation
Modelling. 3rd ed. New York: Routledge/Taylor and Francis Group; 2010. 46. Bentler PM. Comparative fit indexes in structural models. Psychol Bull.
1990;107(2):238–46.
47. Graham JM. Congeneric and (essentially) tau-equivalent estimates of score reliability: what they are and how to use them. Educ Psychol Meas. 2006;66:930–44.
48. Sijtsma K. On the use, the misuse, and the very limited usefulness of Cronbach's alpha. Psychometrika. 2009;74(1):107–20.
49. McDonald RP. The theoretical foundations of principal factor analysis, canonical factor analysis and alpha factor analysis. Br J Math Psychol. 1970; 23(1):1–21.
50. McDonald RP. Test theory: a unified treatment. Mahwah: Erlbaum; 1999. 51. Zinbarg RE, Revelle W, Yovel I, Li W. Cronbach’sα, Revelle’sβ, and
McDonald’sωh : their relations with each other and two alternative conceptualizations of reliability. Psychometrika. 2005;70:123–33. 52. Schmid J, Leiman JM. The development of hierarchical factor solutions.
Psychometrika. 1957;22:53–62.
53. Feldt LS, Woodruff DJ, Salih FA. Statistical inference for coefficient alpha. Appl Psychol Meas. 1987;11:93–103.
54. Diedenhofen B, Musch J. Cocor: a comprehensive solution for the statistical comparison of correlations. PLoS One. 2015;10(4):e0121945.
55. R Core Team. R: A Language and Environment for Statistical Computing. Vienna: Foundation for Statistical Computing; 2013.
56. Hollins Martin CJ, Snowden A, Martin CR. Concurrent analysis: validation of the domains within the birth satisfaction scale. J Reprod Infant Psychol. 2012;30:247–60.
57. Hodnett ED. Pain and women's satisfaction with the experience of childbirth: a systematic review. Am J Obstet Gynecol. 2002;186(5 Suppl Nature):S160–72. 58. Redshaw M. Women as consumers of maternity care: measuring
"satisfaction" or "dissatisfaction"? Birth. 2008;35(1):73–6.
59. Waldenström U. Why do some women change their opinion about childbirth over time? Birth. 2004;31(2):102–7.
60. Hollins Martin CJ. The birth satisfaction scale (BSS). Midwifery Matters. 2014;141:3–5.
61. Raubenheimer J. An item selection procedure to maximise scale reliability and validity. SA J Ind Psychol. 2004;30(4):59–64.
62. Worthington RL, Whittaker TA. Scale development research: a content analysis and recommendations for best practices. Couns Psychol. 2006;34(6):806–38.
• We accept pre-submission inquiries
• Our selector tool helps you to find the most relevant journal
• We provide round the clock customer support
• Convenient online submission
• Thorough peer review
• Inclusion in PubMed and all major indexing services
• Maximum visibility for your research
Submit your manuscript at www.biomedcentral.com/submit