FULL PAPER
Triangulation scale error caused
by the 1894 Shonai earthquake: a possible
cause of erroneous interpretation of seismic
potential along the Japan Trench
Takeshi Sagiya
1*, Nobuhisa Matta
2and Yusaku Ohta
3Abstract
Horizontal crustal strain in the Tohoku area during the twentieth century based on triangulation showed N–S exten-sion and E–W contraction was not significant. This feature was one of the reasons why the 2011 Tohoku-oki earth-quake was unexpected for many scientists. The first triangulation conducted in the late nineteenth century used a length scale defined by baseline surveys, direct measurements of short (2–10 km) baselines with steel rods. The Shionohara baseline in the Yamagata prefecture was measured in May–July 1894 and the 1894 Shonai (M7.0) earth-quake occurred in its western neighbor 3 months after the measurement. The earthearth-quake possibly elongated the baseline by as large as 5 cm or 10 ppm. However, the original length measured before the earthquake was used for the network adjustment of the entire triangulation network, causing extensive underestimation of the length scale of the network as large as 5–10 ppm in northeast Japan. The scale error effect was comparable to tectonic deformation signal over 100 years. The baseline length was re-surveyed in 2012, 1 year after the Tohoku-oki earthquake, and the result is consistent with the hypothesis of scale bias considering interseismic deformation.
Keywords: Triangulation, Crustal strain, GPS, The 2011 Tohoku-oki earthquake, The 1894 Shonai earthquake, Shionohara baseline, Baseline survey
© The Author(s) 2018. This article is distributed under the terms of the Creative Commons Attribution 4.0 International License (http://creat iveco mmons .org/licen ses/by/4.0/), which permits unrestricted use, distribution, and reproduction in any medium, provided you give appropriate credit to the original author(s) and the source, provide a link to the Creative Commons license, and indicate if changes were made.
Introduction
The 2011 Mw9.0 Tohoku-oki earthquake was an unex-pected giant earthquake for most seismologists. Matsu-zawa (2011) summarized five reasons why seismologists believed that there would be no potential for a giant M9 earthquake along the Japan Trench: (1) The subducting Pacific plate is old and cold. Based on comparative sub-ductology (Uyeda and Kanamori 1979), interplate cou-pling was considered small; (2) triangulation data for the last 100 years showed no E–W contraction; (3) there existed a high activity of small to middle sized earth-quakes that were supposed to release tectonic strain at weakly coupled plate interface; (4) major earthquakes along the Japan trench were followed by large afterslip
(e.g. Kawasaki et al. 2001), which suggested interplate coupling was not strong; (5) many small repeating earth-quakes have been occurring along the Japan Trench (Iga-rashi et al. 2003), which indicates fault creep on the plate interface. Among these reasons, the lack of E–W con-traction during the last 100 years was the most important since an E–W contraction is direct evidence of tectonic stress build-up associated with the subduction of the Pacific plate and interplate coupling. In this paper, we argue this understanding was probably inaccurate and try to explain why such misunderstanding occurred.
The Japanese triangulation network was established in the late nineteenth century to provide a reference for precise surveying and mapping of the whole country. Since Japan is located in a tectonically active region, conspicuous crustal deformation occurs associated with large earthquakes and volcanic activities. In addi-tion, significant crustal deformation also occurs during
Open Access
*Correspondence: [email protected]
interseismic periods, reflecting tectonic stress build-up due to plate motions. Resurveying of the triangulation network has provided us with important knowledge about crustal movements, and many studies have been conducted by utilizing those data (e.g. Muto 1932; Ando 1971; Harada and Kassai 1971; Nakane 1973a, b; Sato 1973; Fujii et al. 1986; Tada 1986; Hashimoto 1990; Hashimoto and Jackson 1993; Ishikawa and Hashimoto
1999).
In northeastern Honshu, the main island of Japan, con-tinuous GPS observation has revealed accumulation of E–W contraction in the late 1990′s (Fig. 1b) (Sagiya et al.
2000) and numerous studies had pointed out accumu-lation of interplate slip deficit (Ito et al. 2000; Mazzotti et al. 2000; Nishimura et al. 2004; Hashimoto et al. 2009). On the other hand, crustal strain obtained from the com-parison between triangulation results over a century was dominated by N–S extension and E–W contraction due to subduction of the Pacific plate was not apparent (Fig. 1c) (Fujii et al. 1986; Tada 1986; Hashimoto 1990; Ishikawa et al. 1998; Ishikawa and Hashimoto 1999). These results were considered as important evidence to hypothesize that crustal strain caused by interplate cou-pling was released in some way and had not been accu-mulated in a long term (Matsuzawa 2011). Along the Japan Trench, afterslips of several major earthquakes were reported to be even larger than the main shocks (Heki et al. 1997; Kawasaki et al. 2001). Thus, these after-slips were considered to play an important role to keep the seismic moment budget along the Japan Trench and
seismologists believed there was virtually no long-term slip deficit.
The occurrence of the 2011 Tohoku-oki earthquake revealed that our evaluation about the seismic moment budget was wrong, implying a possible defect in the interpretation of the triangulation records. However, there has been no explanation why such misunderstand-ing occurred. In the followmisunderstand-ing, we demonstrate that an unintentional error in the original triangulation in the l890′s has brought a significant bias in the reference sys-tem over a wide area in northeast Japan and caused mis-interpretation of the crustal deformation which led to the underestimation of accumulated slip deficit along the Japan Trench.
Strain rate of northeast Japan
Figure 1 compares the strain rate distribution in north-east Japan based on GPS data during 1996–2000 and that based on triangulation for 100 years (Ishikawa et al.
1998). E–W contraction is evident all over the Tohoku area in the GPS result. On the other hand, E–W contrac-tion is not evident in the triangulacontrac-tion result over the twentieth century and significant N–S extension is iden-tified. Similar pattern was reported by Hashimoto (1990) and Ishikawa and Hashimoto (1999) who corrected coseismic offsets due to major earthquakes to estimate interseismic crustal strain rate.
Discrepancies between the two results need some explanation. One possible explanation is that E–W con-traction was a short-term feature that would be released
138 140 142
38 40
20mm/yr GPS Velocity
1996 2000
138 140 142
CONT. EXT. 0.2ppm/yr 1996 2000 GPS Strain Rate
138 140 142
38 40 CONT.
EXT. 20ppm
1883/1901 1977/94 Triangulation
a b c
by aseismic fault slips either as afterslips following large earthquakes or as unknown slow slip events during inter-seismic periods. Kawasaki et al. (2001) demonstrated that aseismic fault slips following M7 class earthquakes along the Japan trench contribute equally to or even larger than the coseismic slips. Plate boundary slips can release inter-seismic E–W contraction. But this interpretation cannot explain how to reproduce N–S extension identified in the triangulation.
Another possibility to be considered is a scale bias in the triangulation data. The strain distribution shown in Fig. 1c is obtained from two surveys, one during the 1890′s by a triangulation survey, and the other during the 1980′s by a trilateration survey. In the latter survey,
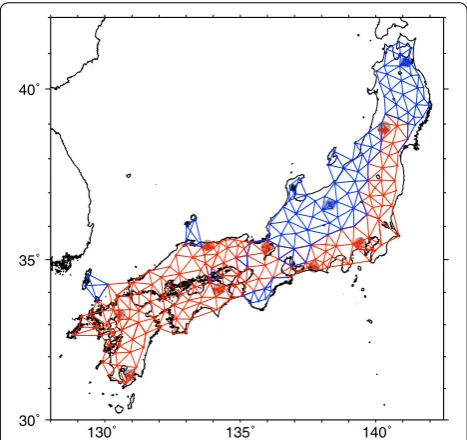
each baseline length was directly measured using elec-tromagnetic distance measurement (EDM). On the other hand, the first survey was conducted mainly by measurements of angles between the triangulation control points. The distance scale of the triangulation network was defined by baseline surveys, direct meas-urements of short baselines using 4-m-long steel rods called Hilgard baseline rods. In case of the Japanese tri-angulation network, there were 15 baselines all over the Japan islands (7 in Honshu, 1 in Shikoku, 2 in Kyushu, 4 in Hokkaido, 1 in Okinawa) with a baseline length of 2–10 km (Fig. 2). If a baseline length measurement has an error that will affect the size of the surround-ing triangulation network. As is schematically shown in Fig. 3, if the original triangulation network had a sys-tematic bias due to a scale error originating from an erroneous baseline length, the scale error not only sup-presses the E–W contraction signal but also generates N–S extension at the same time. Thus, the N–S exten-sion found in the triangulation data may suggest an existence of a scale bias on the order of ~ 10 ppm. Fujii et al. (1986) pointed out a possibility of a scale error of ~ 3 ppm in the crustal strain in the Tohoku area since that was the accuracy of the triangulation survey in the nineteenth century. But no more investigation was con-ducted after that.
Such a significant discrepancy between crustal strain patterns is found only in the Tohoku area. This indi-cates, if the baseline survey caused this discrepancy, the baseline in the Tohoku area should be responsible for the error. As is shown in Fig. 2, there are only two base-lines in the Tohoku area, one is the Shionohara baseline in the Yamagata Prefecture in middle Tohoku, and the other is the Tsurunokotai baseline in the Aomori Pre-fecture. Since the discrepancy between the GPS and triangulation strain rate pattern is significant in mid-dle-southern Tohoku, we considered the measurement of the Shionohara baseline might have a problem. 30
35 40
130 135 140
Fig. 2 First-order triangulation network in Japan except for Hokkaido. Dense networks with gray circular background indicate the locations of baselines. The network shown by red color was measured until October 1894 while the blue network was measured after October 1894
Table
ed length of each seg
The Shionohara baseline
The Shionohara baseline (5129.5872 m) is composed of the two first-order triangulation control points at its eastern and western ends. This is the only original base-line in Japan whose both control points still exist at their original locations today, connected by a straight road for surveying. The baseline was constructed and meas-ured from May to July in 1894. Then, surveys of a dense triangulation network around the Shionohara baseline was conducted from August to October in 1894. To the south of the Shionohara baseline, the Pacific coastal side was surveyed before 1894, while the Japan Sea coastal side was surveyed later. The whole network to the north was surveyed afterward (Fig. 2). The original survey as well as calculation records of the Shionohara baseline is preserved in the archives of the Geospatial Information Authority of Japan (former Geographical Survey Insti-tute, the successor of the Military Land Survey that con-ducted the original triangulation survey). We checked the original calculation log for the Shionohara baseline. Detailed survey record is shown in Table 1. The overview of the baseline survey is summarized as follows.
The 5.1-km-long baseline was divided into 12 seg-ments whose lengths were 390–491 m. Each segment was measured 4 times on different days, twice in the morn-ing (5–9 a.m.) and the rest in the evenmorn-ing (3–7 p.m.), and the measurement of each segment took a half day. The measurement was conducted from May 31 to July 5, 1894. Based on the four measurements of each seg-ment, the standard deviation ranges 0.2–1.1 mm, cor-responding to a relative precision of 0.4–2.8 ppm. The final baseline length and its error were evaluated based on those four independent measurements. Obtained baseline lengths for each measurement was 5129.5870, 5129.5808, 5129.5943, and 5129.5867 m. The final value of the baseline length was obtained as the average of the four independent measurements, 5129.5872 ± 0.0055 m. The formal error (single standard deviation) was 1.1 ppm. It is concluded that the measurement was conducted very precisely and the baseline measurement error is not feasible to explain the possible scale error of ~ 10 ppm in the triangulation. On the other hand, as we already men-tioned, we noticed that the baseline measurement was conducted during May to July of 1894, which implies a possibility that the baseline was heavily affected by a large inland earthquake that occurred near the baseline, the 1894 Shonai earthquake (M7.0) on October 22 of the same year.
The 1894 M7.0 Shonai earthquake
The 1894 Shonai earthquake was one of the most dev-astating earthquake in the Yamagata Prefecture of the western Tohoku area in its recent history. The earth-quake is supposed to have occurred along the Eastern Shonai Plain fault zone, an eastward dipping reverse fault located at the eastern edge of the Shonai plain (Headquarters for the Earthquake Research Promo-tion 2009). Based on seismic intensity data, the magni-tude of this earthquake was estimated as M7.0 (Usami
2003). As is shown in Fig. 4, the distance between the surface trace of the Eastern Shonai Plain fault zone and the Shionohara baseline is only about 30 km. It is highly possible that the baseline length was significantly altered by the coseismic as well as postseismic defor-mation of the 1894 Shonai earthquake.
Although there exist no instrumental observation data of the 1894 Shonai earthquake, we estimate its possi-ble effect on the Shionohara baseline. We assume a sin-gle rectangular fault plane and use elastic dislocation model (Okada 1985) to calculate length change of the Shionohara baseline due to the faulting of the 1894 Sho-nai earthquake. Since there is a large uncertainty in fault parameters, we test a range of fault parameters as sum-marized in Table 2. We conduct a Monte Carlo simula-tion for 1 million runs for different moment magnitude cases (Mw 6.8–7.2), and the results are shown in Fig. 5 as probability distribution for the length change of the Shionohara baseline. The simulation result clearly shows that 5 cm (~ 10 ppm) elongation is feasible for an earth-quake with moment magnitude 6.9–7.0. On the con-trary, if the moment magnitude was smaller than 6.9 or larger than 7.0, the expected baseline length change will become shorter. It is reasonable that a smaller event causes less effect. On the other hand, as long as we assume a shallow-dipping uniform rectangular fault, coseismic displacement of larger earthquakes extends to a larger distance and the spatial gradient of the displace-ment becomes smaller near the source fault. It should be noted that actual earthquake sources are much more complex and the resultant displacements or baseline length changes can be different.
There can be a significant deformation due to post-seismic deformation of the Shonai earthquake. Such a postseismic deformation was observed, for example, fol-lowing the 2008 Iwate-Miyagi earthquake (Ohzono et al.
effect on the Shionohara baseline by an order of magni-tude than the postseismic deformation.
In summary, we conclude that it is highly possible that the 1894 Shonai earthquake elongated the Shionohara baseline by as large as 5 cm or 10 ppm.
Scale bias effects in the triangulation
We hypothesize that the Shionohara baseline was elon-gated by about 5 cm due to the 1894 Shonai earthquake shortly after its measurement. We first confirmed that the original baseline length (5129.5872 m) was used for the network adjustment for the nationwide triangulation network. Then the question is how this wrong baseline
length affected the network adjustment. As is shown in Fig. 2, observation before (red color in Fig. 2) and after (blue color in Fig. 2) the 1894 Shonai earthquake is mixed in the dataset of the first survey. Thus, it is not straight-forward to extract the effects of coseismic deformation. In this study, we conduct a network adjustment calcula-tion simply by changing the Shionohara baseline length and compared the result with the original one to cal-culate differential strain between those solutions. This approach is supposed to demonstrate the scale bias effect at its maximum possible level for a specific value of the baseline length error. We use a triangulation network adjustment code PLATEAU (Program for Large-scale Geodetic Network Adjustment) developed by Komaki (1993) for our analysis. We conduct network adjustment calculation for three cases. In the first case, the origi-nal length (5129.5872 m) for the Shionohara baseline is assumed. Considering the coseismic displacement of the 1894 Shonai earthquake, this result has a bias of − 5 cm (− 9.7 ppm) for the Shionohara baseline to calculate coor-dinates after 1894. In the second case, the Shionohara baseline length is assumed to be 5129.6372 m, that is, a presumably correct value after the Shonai earthquake. As a third case, we also conduct a network adjustment with the Shionohara baseline length of 5129.6872 m, + 10 cm (+ 19.5 ppm) change from the original value. We confirm that the strain bias over the whole network is simply pro-portional to the assumed baseline length correction. So we mainly discuss the comparison of the first two cases. We calculate the coordinate differences (the + 5 cm case minus the original case) between these two network adjusted solutions and convert them into a 2-dimensional strain tensor for each triangle composed of the first-order control points (Fig. 6). As is shown in Fig. 6, the baseline bias has a significant as well as extensive effect on the scale of the triangulation network. Dilatational strain is biased more than 6 ppm over the whole Tohoku region and a smaller effect over 2 ppm is recognized even in the Kanto and northern Chubu regions. Such an exten-sive effect is reasonable considering the location of the Shionohara baseline. As was previously mentioned, there were only two baselines in the Tohoku area and one of them is located at the northern end. Since the triangula-tion survey in the nineteenth century was conducted to provide the first geodetic reference for the Japanese ter-ritory, there was no reference for the absolute position beforehand. Under such a condition, the biased baseline length of the Shionohara baseline downscaled the trian-gulation network mainly in the Tohoku area as large as 5–10 ppm.
We also show distribution of the maximum shear strain change in Fig. 6b. The effect of the baseline bias is neg-ligible (less than 1 ppm) for the maximum shear strain.
139 38 30' 39 00'
0 50
km
MOGA SB Sakata
Tsuruoka
Shinjo
TACH SHIN
Fig. 4 Local map of the source region of the 1894 Shonai
earthquake. The red lines denote the Eastern Shonai Plain fault zone. The pink ellipse denotes the area of severe damage (seismic intensity 5+ or larger). SB denotes the location of the Shionohara baseline. MOGA, SHIN, TACH are the GEONET stations
Table 2 Fault parameters of the 1894 Shonai earthquake and its tested ranges and assumed sampling in the Monte Carlo simulations
Model parameter Range Sampling
Magnitude (Mw) 6.8, 6.9, 7.0, 7.1, 7.2
Fault center 38.85ºN–38.95ºN, 139.95ºE–140.00ºE Gaussian
Fault depth (D) 0.0–5.0 km Random
Fault length (L) Scaling from Mw (Takemura 2005) Gaussian
Fault width (W) W= 0.5 L Gaussian
Strike (φ) N10°W–N10°E Random
Dip (δ) 20º–50º Random
Rake (λ) 70º–110º Random
Slip Determined from Mw, L and W
Rigidity 30 GPa Fixed
The result is consistent with the fact that shear strain can be obtained only from angle measurements (e.g. Frank 1966). Fukushima et al. (2012) compared the shear strain distribution based on both triangulation data and GPS results before 2011 and concluded that E–W con-traction has been continued over the twentieth century
although the shortening might be enhanced in the south-ern Tohoku area. Our calculation result supports their conclusion.
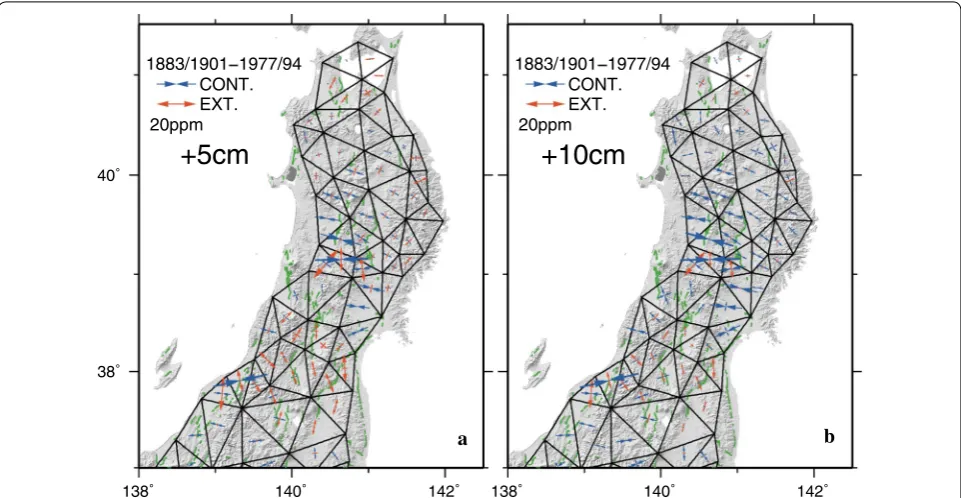
Figure 7 shows the horizontal crustal strain over 100 years after a correction of the scale bias. Since the scale bias effect appears only in the dilatational strain but not in the shear strain component, we simply subtract a half of the dilatational bias (Fig. 6a) from the principal strain axes (Fig. 1c). Figure 7a shows the scale correction result for the case of + 5 cm. N–S extension in the central Tohoku area has disappeared and the strain pattern looks closer to the GPS-based strain rate distribution (Fig. 1b). On the other hand, N–S extension is still evident in the southern Tohoku area around 38ºN. Crustal strain in this area may be heavily affected by the 1938 Shioya-oki earthquakes (Abe 1977) and the 1964 Niigata earth-quake (e.g. Abe 1975). There can be some other unknown sources of error or bias in the triangulation network. We just point out that 10 cm correction of the Shiono-hara baseline improves the situation better as shown in Fig. 7b.
We also tested correction of the possible 1894 Shonai earthquake in the original triangulation. For this pur-pose, we hypothesize two fault models of the 1894 Sho-nai earthquake (source parameters are shown in Table 4), corresponding to 5 and 10 cm of the Shionohara baseline elongation. Then we calculate coseismic displacement at benchmarks using the elastic dislocation code by Okada (1985) and corrected the triangulation angles measured before the 1894 earthquake. We conducted network adjustments using these corrected angles and baseline 0
10 20 30
Probability(%)
0.1 0.0 0.1 0.2
Length change (m)
M6.8
M6.9
M7.0 M7.1
M7.2
Fig. 5 Monte Carlo simulation results for the length change of the Shionohara baseline due to the 1894 Shonai earthquake. Each curve shows a probability distribution of expected baseline length change for different moment magnitude obtained from 1 million test cases
130° 135° 140°
30° 35° 40°
−10−8 −6 −4 −2 0 2 4 6 8 10
dilatation(ppm)
5ppm
130° 135° 140
30° 35° 40°
0 2 4 6 8 10
max. shear(ppm)
length for two cases and evaluate the expected crustal strain distribution (Additional file 1: Figure S1). These corrected crustal strain distributions show some notable changes from those in Fig. 7, for example, in the degree of the N–S extension due to the scale bias. However, the overall strain patterns do not change from those in Fig. 7
and the effect of coseismic angle changes is not serious. Since the hypothetical fault model contains large uncer-tainties, we prefer to present Fig. 7 to demonstrate the scale bias effects on the triangulation result.
Re‑survey of the Shionohara baseline
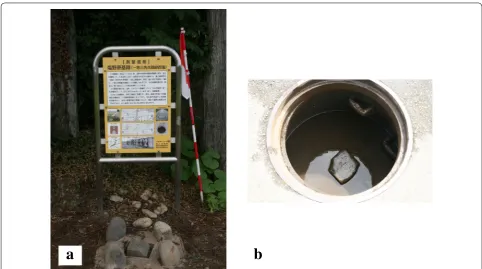
As is already mentioned, the control points at both ends of the Shionohara baseline still exist at their original posi-tions. The current length of the baseline may provide an additional constraint on the coseismic disturbance of the 1894 Shonai earthquake. Therefore, we conducted the baseline length survey in August 2012.
We measure the baseline length by using GPS. Cur-rently, the eastern control point is located beneath a roadway and the western control point is located at the edge of a cedar grove, and both locations are not suita-ble for GPS measurement (Fig. 8). Thus, we established temporary benchmarks to conduct static GPS meas-urements and obtain the correction vectors between the temporary benchmarks and the baseline control points by using a total station. GPS observation was done for two 6-h sessions. We analyze GPS data by using Bernese GNSS software version 5.2 with the final
satellite orbit and earth rotation parameters provided by the International GNSS Service (IGS). The obser-vation result was summarized in Table 3. Since the original baseline length was calculated on the Bessel ellipsoid referring to the old Japanese geodetic datum, we convert the coordinates of the both control points from the GRS80 ellipsoid to the Bessel ellipsoid using the TKY2JGD software provided by the Geospatial Information Authority of Japan (http://vldb.gsi.go.jp/ sokuc hi/surve ycalc /tky2j gd/main.html). Finally, we obtain a baseline length in 2012 as 5129.6526 m (Bes-sel ellipsoid), which is longer than the original value (May–July 1894) by 0.0654 m (12.7 ppm). The total measurement error in our 2012 survey is estimated to be about 5 mm.
In order to compare the baseline length in 2012 with that in 1894, we need to consider effects of various earthquakes in the surrounding areas and interseismic deformation during last 100 years. Among them, the 2011 Tohoku-oki earthquake contributed to the larg-est baseline change. Two GEONET baselines, Mogami (MOGA)-Shinjo (SHIN) (15.6 km) and Shinjo (SHIN)-Tachikawa (TACH) (31.4 km) aligned in the E–W direction nearly parallel to the Shionohara baseline (see Fig. 4 for locations), had length changes of ~ 0.25 m (+ 16.0 ppm) and ~ 0.50 m (+ 15.9 ppm), respectively, including coseismic as well as postseismic changes until August 2012. Thus, the total effects of the 2011 Tohoku-oki earthquake on the Shionohara baseline are
138 140 142
38 40
CONT. EXT. 20ppm
1883/1901 1977/94
+5cm
138 140 142
CONT. EXT. 20ppm
1883/1901 1977/94
+10cm
a b
evaluated as an elongation of around + 16 ppm (8 cm). Based on the GPS data before 2011, baseline length change rate for Mogami-Shinjo was nearly 0 and that of the Shinjo-Tachikawa was − 3 mm/year (− 0.1 ppm/ year). It is reasonable to assume the interseismic short-ening ratio of the Shionohara baseline as 0–0.1 ppm/ year.
Table 4 and Additional file 2: Figure S2 summarizes major earthquakes between 1894 and 2011 in and around the Tohoku area and coseismic baseline length change based on an elastic dislocation model using the Oka-da’s (1985) code. The 1964 Niigata earthquake (M7.5, + 8.0 mm) and the 2008 Iwate-Miyagi Nairiku earth-quake (Mw7.2, + 11.3 mm) are considered to have the largest effects on the Shionohara baseline. The total effect of these earthquakes is expected to be around + 20 mm. We also evaluate postseismic viscoelastic relaxation effects of these earthquakes using PSGRN/PSCMP software (Wang et al. 2006) assuming the lithospheric thickness of 50 km and the asthenospheric viscosity of 1.0 × 10¹⁹ Pa s. Large postseismic effects until 2012 are expected for the 1896 Rikuu (− 5.2 mm), the 1933 San-riku (− 3.0 mm), and the 1964 Niigata (+ 3.0 mm) earth-quakes. We also expect the 1894 Shonai earthquake might cause a 5 mm of postseismic contraction though the source fault model has a larger uncertainty. In total, the postseismic effects are expected to be contraction of several millimeters. Based on this consideration, we sum-marize two simple scenarios of the Shionohara baseline length change in Fig. 9. In both scenarios, we assume the original baseline length in July 1894 (5129.5872 m) and the one in August 2012 (5129.6526 m). In addition, steady interseismic shortening and stepwise coseismic
a
b
Fig. 8 Photographs of the first-order triangulation control points of the Shionohara baseline (photographs taken by T. Sagiya). a Western end. b Eastern end
Table 3 Measured coordinates and length of the Shionohara baseline
*Calculated with TKY2JGD software
**Coordinates are calculated through network adjustment with PLATEAU software. Length was measured by baseline survey
***Measured with GPS
East West Length (m)
1894 GRS80* 38º50′1.19570″N 38º49′50.42285″N 5129.6096 140º 21′35.39900″E 140º18′3.17182″E
Bessel** 38º49′50.7913″N 38º49′40.0249″N 5129.5872 140º21′47.6756″E 140º18′15.4319″E
2012 GRS80*** 38º50′1.16550″N 38º49′50.39528″N 5129.6767 140º21′35.48986″E 140º18′3.25970″E
offsets listed in Table 4 are included. Other effects such as postseismic transients or interseismic velocity change are not considered in these scenarios. Case 1 assumes the coseismic elongation of 50 mm (~ 10 ppm). In order to fit the baseline length in 2012, we need a slightly higher
shortening ratio of − 0.15 ppm/year. On the other hand, if we assume a shortening ratio consistent with GPS observation (− 0.10 ppm/year), baseline change due to the 1894 Shonai earthquake reduces to about − 19 mm (− 3.7 ppm). From GPS observation, the interseismic
Table 4 Major earthquakes around the Shionohara baseline and calculated baseline changes
Postseismic changes are cumulative viscoelastic effects until 2012
*Fault parameters for the 1894 Shonai earthquake are assumed as 38.75ºN, 139.95ºE, D= 0 km, L= 30 km, W= 15 km, φ = 0º, δ = 30º, λ = 90º, Δu= 1.5 or 3.0 m Earthquake Magnitude (Mw) Coseismic (mm) Postseismic (mm) References
1894/10/22 Shonai * 6.8 + 50.3 − 2.5
7.0 + 100.5 − 4.9
1896/6/15 Sanriku 8.5 + 3.0 + 1.1 Tanioka and Satake (1996)
1896/8/31 Rikuu 7.2 + 3.2 − 5.2 Thatcher et al. (1980)
1897/8/5 Miyagi-oki 7.7 + 1.4 + 0.6 Aida (1977)
1900/5/12 Northern Miyagi 6.2 + 0.1 + 0.1 Takemura (2005)
1933/3/3 Sanriku 8.4 − 3.5 − 3.0 Abe (1978)
1936/11/3 Miyagi-oki 7.2 + 0.6 + 0.1 Yamanaka and Kikuchi (2004)
1937/7/27 Miyagi-oki 7.1 + 0.1 0.0 Yamanaka and Kikuchi (2004)
1938/5/23–1938/11/7 Shioyazaki-oki 7.0, 7.5, 7.3,7.4, 6.9 − 0.6 − 0.4 Abe (1977)
1962/4/30 Northern Miyagi 6.2 + 0.5 + 0.6 Sato (1989)
1964/6/16 Niigata 7.6 + 8.0 + 3.0 Abe (1975)
1968/5/16 Tokachi-oki 8.2 − 0.4 − 0.5 Aida (1978)
1970/10/16 SE Akita 6.2 − 0.2 0.0 Mikumo (1974)
1978/6/12 Miyagi-oki 7.5 + 1.5 − 0.5 Seno et al. (1980)
1983/5/26 Japan Sea 7.7 − 1.1 − 0.4 Sato (1985)
2003/7/26 Northern Miyagi 6.1 + 0.1 0.0 Nishimura et al. (2003)
2005/8/16 Miyagi-oki 7.2 + 0.6 0.0 GSI (2005)
2008 Iwate-Miyagi 7.2 + 11.3 0.0 Takada et al. (2009)
shortening ratio can be as small as 0 based on GPS obser-vation before 2011. However, if we assume no interseis-mic deformation, coseisinterseis-mic length change of the 1894 Shonai earthquake is estimated to be negative, which we consider unlikely. Considering a large degree of uncer-tainty about interseismic deformation rate and coseismic as well as other aseismic changes, we conclude that our observation of the Shionohara baseline in 2012 is con-sistent with our hypothesis that the baseline length was significantly changed by the 1894 Shonai earthquake. It should be also noted that the apparent baseline change between 1894 and 2012 is roughly attributed to the coseismic change of the 2011 earthquake. Thus, if we had compared the baseline length just before the 2011 with the 1894 result, we would have detected no significant change, which is consistent with the actual situation of no apparent E–W contraction over 100 years described in the introduction. However, as was demonstrated in the GPS observation before 2011, it is highly probable that the baseline was shortened over 117 years and the base-line length extrapolated backward to 1894 significantly exceeds the original value.
Discussion
We first summarize our hypothesis about the Shiono-hara baseline and related consequences. The ShionoShiono-hara baseline was measured during May–July 1894, and the value of 5129.5872 m was obtained with an expected pre-cision of ~ 1 ppm. On October 22 of the same year, the Shonai earthquake happened and the baseline length was increased by about 10 ppm. However, the baseline was never re-surveyed after the earthquake and the original value was used for network adjustment. As a result, the triangulation network in northeast Japan was defined with a negative isotropic scale bias of 5–10 ppm, or the network was defined 5–10 ppm smaller than its actual size. After the first survey, tectonic plate motion and interplate coupling at the Japan trench accumulated E–W contraction roughly at 0.1 ppm/year as a regional aver-age. After 100 years from the first survey, the cumulative contraction reaches about 10 ppm in E–W direction. In the comparison of triangulation data, the E–W contrac-tion signal was not identified since the original network was defined smaller by almost the equal amount to the cumulative contraction during 100 years. Instead, the comparison of triangulation surveys revealed extensive N–S extension because the original network size was underestimated in N–S direction, too. This hypothesis explains why we did not identify geodetic signals showing tectonic strain accumulation in the Tohoku area.
The N–S extension in the Tohoku area was pointed out as early as in 1971 by Harada and Kassai (1971) who compared the re-survey of the triangulation network
in the Showa era (1948–1968) with the original solu-tion in the nineteenth century. By using Frank’s (1966) method, Sato (1973) and Nakane (1973a, b) evaluate shear strain rate of Japan Islands. They also estimated the maximum contraction in the Tohoku area was in the E–W direction, but this estimate was consistent with the N–S extension since the applied method could not resolve the dilatation. Later, Hashimoto (1990) and Ishikawa and Hashimoto (1999) estimated horizon-tal crushorizon-tal strain rates using multiple survey results and reached a similar conclusion to Harada and Kas-sai (1971). Hashimoto and Jackson (1993) discussed interseismic deformation using angle change rate and concluded interseismic coupling at the Japan Trench was weak. Though there have been so many studies using triangulation data, no reasonable interpretation has been given about the observed N–S extension sig-nal before. The observatiosig-nal error of the origisig-nal tri-angulation in the nineteenth century was considered as large as 10 ppm based on the internal consistency of the network adjustment (Komaki 1985). But all the previous authors considered that the observation error was random and they did not consider a possibility of the scale bias as pointed out in this study. Hashimoto (1990) and Ishikawa and Hashimoto (1999) calculated strain rates from baseline length change rates using network adjustment results of all the available surveys. In the calculation of baseline length change rate, even with a large formal error, data from the first survey are highly influential since they are the only data in the first half of the analysis period.
The measurement of the Shionohara baseline finished in early July of 1894. However, according to the record, angle measurements of the first-order benchmarks con-tinued until October of the same year. We speculate that the survey team should know that the Shonai earthquake occurred just after their survey. Only 3 years before the Shonai earthquake, there occurred the 1891 Nobi earth-quake, which heavily affected the nearby triangulation network and the first recovery survey took place. Thus, there remains a question why a similar recovery sur-vey was not conducted around the Shionohara baseline. While the town of Sakata to the west of the source fault was heavily damaged, almost no damage was reported in Shinjo close to the survey area (Omori 1895). Probably the survey team did not expect such a significant defor-mation to occur at the baseline.
residuals. It is a fatal fault that we have overlooked the possibility of such a scale error. Since everybody knows that triangulation survey has a weakness in its scale, we should have investigated the unbiased observables such as angles or shear strains. Also, those who discuss seis-mic potential using geodetic data should understand how those data were obtained and what kind of errors could be contained.
In spite of such annoying data errors, conventional geodetic data such as triangulation and leveling still keep their scientific value. Our observation history with pre-cise instruments such as GPS is still only 25–30 years long. Many geological phenomena such as earthquakes and volcanic eruptions are all unique, and we still lack of experience to make forecast or prediction on what hap-pens in the future. In order to fully utilize the legacy of old observations, we should pay the most careful atten-tion to data quality and various errors contained in the observation data.
On the other hand, it was nothing but an unfortunate coincidence that such a bias sneaked in the triangula-tion data. If the baseline had been constructed in a dif-ferent place, if the baseline had been designed in the N–S direction, if the earthquake had occurred several months earlier, if the earthquake had been a little smaller or even larger, if one of us had been careful enough to investigate such a possibility, we could have avoided such an errone-ous interpretation. This example provides a very impor-tant lesson that we can never be too careful in preparing for future natural hazard.
Conclusion
We revisited the original record of the Shionohara base-line survey conducted in 1894 and confirmed that the survey was conducted normally with a good precision. But we also found a possibility that the baseline length was significantly affected by the Shonai earthquake that occurred only 30 km to the west of the baseline. We numerically investigated a possible effect of the Shonai earthquake to the Shionohara baseline length and found that an earthquake with magnitude 6.9–7.0 could effec-tively elongate the baseline length as much as 5 cm or 10 ppm. Network adjustment calculations demonstrate that an error of 10 ppm at the Shionohara baseline causes significant as well as extensive scale bias in the strain cal-culation. A bias of 10 ppm was large enough to conceal tectonic strain accumulation over 100 years and to cre-ate apparent N–S extension signal over the entire Tohoku area. The re-survey of the Shionohara baseline was done in August 2012, after the 2011 Tohoku-oki earth-quake. In spite of a large uncertainty in the interseismic
deformation rate, the result is consistent with the hypoth-esis of the baseline scale bias. Thus, our understanding of no significant elastic strain accumulation in the Tohoku area before the 2011 Tohoku earthquake was caused by the isotropic scale bias of ~ 10 ppm in the original tri-angulation network adjustment result, for which coseis-mic deformation of the 1894 Shonai earthquake was responsible.
Author’s contributions
TS planned the whole research, conducted data analysis and field survey, and wrote the manuscript. NM and YO cooperated in the field survey. All members read the manuscript and agreed on the content.
Author details
1 Disaster Mitigation Research Center, Nagoya University, Nagoya, Japan. 2 Graduate School of Education, Okayama University, 3-1-1 Tsushima-naka, Kita-ku, Okayama, Japan. 3 Research Center for Prediction of Earthquakes and Volcanic Eruptions, Graduate School of Science, Tohoku University, Sendai, Japan.
Acknowledgements
Critical comments by Paul Segall, an anonymous reviewer, and an associate editor Tomokazu Kobayashi were helpful to improve the manuscript. Angela Meneses-Gutierrez, Shinichi Nomura and Syota Suzuki are acknowledged for their support in the field survey. Takuya Nishimura and Hiroshi Yarai are acknowledged for their support in gathering triangulation data and reading original field/calculation logs in the archives. We also thank the Geospatial Information Authority of Japan for the use of GEONET data.
Competing interests
The authors have no competing interest.
Availability of data and materials
All the data used in this manuscript can be provided on request.
Consent for publication
Not applicable.
Ethics approval and consent to participate
Not applicable.
Funding
This study was supported by JSPS KAKENHI Grant Numbers JP25282111 and JP26109003, and “Intensified Observation and Research on Strain Concentra-tion Zone” project by the Ministry of EducaConcentra-tion, Culture, Sport, Science and Technology.
Publisher’s Note
Springer Nature remains neutral with regard to jurisdictional claims in pub-lished maps and institutional affiliations.
Received: 3 April 2018 Accepted: 5 July 2018 Additional files
Additional file 1. Crustal strain during the 100 years after correction of coseismic changes of angles and the baseline length based on a hypoth-esized fault model for the 1894 Shonai earthquake. (a) Case of + 5 cm of the Shionohara baseline. (b) Case of + 10 cm.
References
Abe K (1975) Re-examination of the fault model for the Niigata earthquake of 1964. J Phys Earth 23:349–366
Abe K (1977) Tectonic implications of the large Shioya-oki earthquakes of 1938. Tectonophys 41:269–289
Abe K (1978) A dislocation model of the 1933 Sanriku earthquake consistent with the tsunami waves. J Phys Earth 26:381–396
Aida I (1977) Simulations of large tsunamis occurring in the past off the coast of the Sanriku district. Bull Earthq Res Inst 52:71–101 (in Japanese with English abstract)
Aida I (1978) Reliability of a tsunami source model derived from fault param-eters. J Phys Earth 26:57–73
Ando M (1971) A fault-origin model of the great Kanto earthquake of 1923 as deduced from geodetic data. Bull Earthq Res Inst 49:19–32
Frank FC (1966) Deduction of earth strains from survey data. Bull Seism Soc Am 56:35–42
Fujii Y, Sugita K, Nakane K (1986) Earth’s horizontal strain in the north-east Japan (II). J Geod Soc Jpn 32:43–55
Fukushima Y, Hashimoto M, Segall P (2012) Comparison of strain rates during the historical (1880–1990s) and GPS periods over northeastern Honshu before the 2011 Tohoku-oki earthquake, Program and Abstracts, Seismol. Soc. Japan 2012 Fall Meeting, C21–09
Geospatial Information Authority of Japan (2005) Crustal deformation associ-ated with the 2005 Miyagi-oki earthquake (in Japanese). http://www.gsi. go.jp/cais/HENDO U-hendo u25.html
Harada T, Kassai A (1971) Horizontal strain of the crust in Japan for the last 60 years. J Geod Soc Jpn 17:4–7 (in Japanese with English abstract)
Hashimoto M (1990) Horizontal strain rates in the Japanese islands during interseismic period deduced from geodetic surveys (Part 1): honshu, Shikoku and Kyushu. Zisin 43:19–26 (in Japanese with English abstract)
Hashimoto M, Jackson DD (1993) Plate tectonics and crustal deformation around the Japanese Islands. J Geophys Res 98:16149–16166 Hashimoto C, Noda A, Sagiya T, Matsu’ura M (2009) Interplate seismogenic
zones along the Kuril-Japan trench inferred from GPS data inversion. Nat Geosci 2:141–144
Headquarters for the Earthquake Research Promotion (2009) Evaluation of the eastern Shonai plain fault zone (in Japanese). https ://www.jishi n.go.jp/ main/chous a/katsu danso u_pdf/19_shona i-heiya _2.pdf
Heki K, Miyazaki S, Tsuji H (1997) Silent fault slip following an interplate thrust earthquake at the Japan Trench. Nature 386:595–598
Igarashi T, Matsuzawa T, Hasegawa A (2003) Repeating earthquakes and inter-plate aseismic slip in the northeastern Japan subduction zone. J Geophys Res. https ://doi.org/10.1029/2002J B0019 20
Ishikawa N, Hashimoto M (1999) Average horizontal strain rates in Japan during interseismic period deduced from geodetic surveys (Part 2). Zisin 52:299–315 (in Japanese with English abstract)
Ishikawa N, Tada T, Hashimoto M (1998) Horizontal strain in Japanese islands. Rep Geogr Surv Inst 89:18–26
Ito T, Yoshioka S, Miyazaki S (2000) Interplate coupling in northeast Japan deduced from inversion analysis of GPS data. Earth Planet Sci Lett 176:117–130
Kawasaki I, Asai Y, Tamura Y (2001) Space-time distribution of interplate moment release including slow earthquakes and the seismo-geodetic coupling in the Sanriku-oki region along the Japan trench. Tectonophys 330:267–283
Komaki K (1985) The readjustment of the Meiji first order triangulation net-work by the projection method. Bull Geogr Surv Inst 29:1–45 Komaki K (1993) Horizontal crustal movements revealed by geodetic
meas-urements–Applications of a new method for estimating displacement vectors. J Geod Soc Jpn 39:387–410
Matsuzawa T (2011) Why could the M9 earthquake occur in the northeastern Japan subduction zone? Why did we believe it would not occur there? Kagaku 81:1020–1026 (in Japanese)
Mazzotti S, Le Pichon X, Henry P, Miyazaki S (2000) Full interseismic locking of the Nankai and Japan-west Kurile subduction zones: an analysis of
uniform elastic strain accumulation in Japan constrained by permanent GPS. J Geophys Res 105:13159–13177
Mikumo T (1974) Some considerations on the fault mechanism of the south-eastern Akita earthquake of October 16, 1970. J Phys Earth 22:87–108 Muto K (1932) A study of displacements of triangulation points. Bull Earthq Res
Inst 10:384–392
Nakane K (1973a) Horizontal tectonic strain in Japan (I). J Geod Soc Jpn 19:190–199
Nakane K (1973b) Horizontal tectonic strain in Japan (II). J Geod Soc Jpn 19:200–208
Nishimura T, Imakiire T, Yarai H, Ozawa T, Murakami M, Kaidzu M (2003) A preliminary fault model of the 2003 July 26, M6.4 northern Miyagi earthquake, northeastern Japan, estimated from joint inversion of GPS, leveling, and InSAR data. Earth Planets Space 55:751–757. https ://doi. org/10.1186/BF033 52484
Nishimura T, Hirasawa T, Miyazaki S, Sagiya T, Miura S, Tanaka K (2004) Temporal change of interplate coupling in northeastern Japan during 1995-2002 estimated from continuous GPS observations. Geophys J Int 157:901–916 Ohzono M, Ohta Y, Iinuma T, Miura S, Muto J (2012) Geodetic evidence of
vis-coelastic relaxation after the 2008 Iwate-Miyagi Nairiku earthquake. Earth Planets Space 64:759–764. https ://doi.org/10.5047/eps.2012.04.001 Okada Y (1985) Surface deformation due to shear and tensile faults in a
half-space. Bull Seism Soc Am 75:1135–1154
Omori F (1895) Report of the Shonai earthquake on October 22 in Meiji 27. Shinsai Yobo Chousakaiho 28:79–95
Sagiya T, Miyazaki S, Tada T (2000) Continuous GPS array and present-day crustal deformation of Japan. PAGEOPH 157:2303–2322
Sato H (1973) A study of horizontal movement of the Earth crust associated with destructive earthquakes in Japan. Bull Geogr Surv Inst 19:89–137 Sato T (1985) Rupture characteristics of the 1983 Nihonkai-Chubu (Japan Sea)
earthquake as inferred from strong motion accelerograms. J Phys Earth 33:525–557
Sato R (1989) Handbook of earthquake fault parameters in Japan. Kajima Publishing, Minato-ku
Seno T, Shimazaki K, Somerville P, Sudo K, Eguchi T (1980) Rupture process of the Miyagi-oki, Japan, earthquake of June 12, 1978. Phys Earth Planet Inter 23:39–61
Tada T (1986) Horizontal crustal strain in the northeastern Japan arc and its relation to the Tectonics. Zisin 39:257–265
Takada Y, Kobayashi T, Furuya M, Murakami M (2009) Coseismic displacement due to the 2008 Iwate-Miyagi Nairiku earthquake detected by ALOS/ PALSAR: preliminary results. Earth Planets Space 61:e9–e12. https ://doi. org/10.1186/BF033 53153
Takemura M (2005) Re-evaluation of magnitude and focal region of the 1900 Northern Miyagi Prefecture earthquake in Japan–Comparison with the 1962 and the 2003 events. Zisin 58:41–53
Tanioka Y, Satake K (1996) Fault parameters of the 1896 Sanriku tsunami earthquake estimated from tsunami numerical modeling. Geophys Res Lett 23:1549–1552
Thatcher W, Matsuda T, Kato T, Rundle JB (1980) Lithospheric loading by the 1896 Riku-u earthquake, northern Japan: implications for plate flexure and asthenospheric rheology. J Geophys Res 85:6429–9435
Usami T (2003) Latest version Japan earthquake damage overview 416-2001. University of Tokyo Press, Tokyo
Uyeda S, Kanamori H (1979) Back-arc opening and the mode of subduction. J Geophys Res 84:1049–1060
Wang R, Lorenzo-Martin F, Roth F (2006) PSGRN/PSCMP—a new code for calculation co- and post-seismic deformation, geoid and gravity changes based on viscoelastic-gravitational dislocation theory. Comput Geosci 32:527–541