P R O C E E D I N G S
Open Access
An adaptive gene-based test for
methylation data
Chong Wu, Jun Young Park, Weihua Guan and Wei Pan
*FromGenetic Analysis Workshop 20 San Diego, CA, USA. 4 - 8 March 2017
Abstract
DNA methylation plays an important role in normal human development and disease. In epigenome-wide association studies (EWAS), a univariate test for association between a phenotype and each cytosine-phosphate-guanine (CpG) site has been widely used. Given the number of CpG sites tested in EWAS, a stringent significance cutoff is required to adjust for multiple testing; in addition, multiple nearby CpG sites may be associated with the phenotype, which is ignored by a univariate test. These two factors may contribute to the power loss of a univariate test. As an alternative, we propose applying an adaptive gene-based test that is powerful in genome-wide association studies (GWAS), called aSPUw, to EWAS for simultaneous testing on multiple CpG sites within or near a gene. We show its application to the GAW20 methylation data set.
Background
DNA methylation of cytosine residues at cytosine-pho-sphate-guanine (CpG) dinucleotides is of particular interest because it has a central role in the normal hu-man development and disease [1]. Epigenome-wide as-sociation studies (EWAS), analogous to genome-wide association studies (GWAS), are becoming increasingly popular to interrogate methylation changes associated with a disease or related environmental factors [2]. The common statistical analysis in EWAS uses a single marker test for association between a phenotype and each of the CpG sites. Given the number of CpG sites tested in EWAS, a univariate test must meet a stringent threshold for statistical significance (for example, p
value < 1 × 10⁻⁷ often used for the Illumina 450 K array); in addition, a univariate test does not take ad-vantage of possible existence of multiple associated CpG sites within a gene. Hence, a univariate test many be underpowered in EWAS. In this paper, we consider statistical methods that test for the association between multiple CpG sites in a gene and a phenotype simultaneously.
This work was motivated by analysis of the methylation data provided by GAW20. The data set was taken from the Genetics of Lipid Lowering Drugs and Diet Network (GOLDN) study. With GOLDN data, Irvin et al. found 4 CpG sites in intron 1 ofCPT1Athat were strongly associ-ated with both very-low-density lipoprotein cholesterol (VLDL-C) and triglyceride (TG) [3]. A question of major interest is to study whether other genes are associated with VLDL-C and TG. In other words, we are interested in examining the association between methylation within each gene and a phenotype.
Some methods have been developed to detect differen-tially methylated regions (DMRs) [4, 5]. For example, Jaffe et al. [4] proposed a method called bump hunting
to detect DMRs associated with a continuous trait in a well-characterized population of newborns. Butcher and Beck [5] proposed a flexible window-based approach to discover DMRs. Many methods detecting DMRs assume that nearby CpG sites are methylated/unmethylated in the same direction, however, to the best of our know-ledge, few gene-based analysis for methylation data con-sider the scenario that the change of methylation status can be in different directions within a gene. Importantly, because it is reasonable to assume that not all the CpG sites in a gene are related to the phenotype, it is challen-ging and important to adaptively aggregate information * Correspondence:[email protected]
Division of Biostatistics, University of Minnesota, 420 Delaware St SE, Minneapolis, MN 55455, USA
over multiple associated CpG sites while eliminating or minimizing the effects of nonassociated CpG sites. To solve this problem, we apply a highly adaptive test called
adaptive sum of powered score (aSPU) test [6] and its weighted version called aSPUw test [7], which have promising performance in GWAS, to methylation data for the first time. The main idea of the aSPU or aSPUw test is that, because we do not know which and how many CpG sites in the given gene are associated with the phenotype, we construct a class of sum of powered score–weighted (SPUw) tests. The aSPUw test then selects the CpG site with the most significant result with a proper adjustment for multiple testing.
In application to the GAW20 data set, to account for familial structures, we apply a linear mixed-effects model and use an estimated genetic relationship matrix (GRM) (estimating the kinship coefficients among the individ-uals) as the correlation matrix of a random effect. Then we construct the aSPUw test based on the score function from the linear mixed-effects model. We find that methylation levels in gene CPT1A are associated with the pretreatment fasting TGs at the genome-wide signifi-cance level, whereas methylation levels in gene APOA5
are possibly associated at a suggestive significance level.
Methods
In this section, we briefly introduce the aSPUw test for family-based methylation data.
Suppose for ni related family members in the family
i (i= 1, 2,…,F), we have an ni-vector yi¼ ðyi1;…;yiniÞ 0
for a phenotype, for example, log pretreatment fasting TG levels, an ni×p matrix Gi= (Gi1,…,Gip)′ for for p CpG
sites, and anni×qmatrixXi= (Xi1,…,Xiq)′for q fixed
co-variates, including intercepts. For all the methylation levels atpCpG sites, we use the methylation beta-values, which roughly represents the fractions of methylated cyto-sine molecules in the given sample at specific CpG sites. In total, we have data onnindividuals withn¼PiF¼1ni:
To derive the test statistic, we first briefly describe how to calculate the score function in a generalized linear mixed model (GLMM), then we describe how to construct the test statistics based on the score vector. A GLMM is an exten-sion of a generalized linear model (GLM) with the addition of 1 or more random effects that are used to account for correlations among the subjects (e.g., members from the same family). Here we use the following model with a random intercept: prespecifiedn×npositive-definite correlation matrix (e.g., GRM); and Tk is the corresponding variance component parameter. We estimate the GRM (Ψ1) as the empirical
correlation matrix based on 20,000 randomly selected single-nucleotide polymorphisms (SNPs). Furthermore, we consider a within-family (shared environmental) effect by adding a block diagonal matrix (Ψ2), where each block
consists of 1 s for each family. Chen et al. developed R
packageGMMATto fit the above GLMM, from which we
extract the score vector U= (U1,…,Up)′ and its
corre-sponding covariance matrixVforpCpG sites [8].
In GWAS, many existing association tests either directly use the score vector U or its asymptotically equivalent counterparts, suggesting that most information is already contained inU[6]. As demonstrated in many simulations in the GWAS context [6], depending on the unknown association patterns to be tested, different tests may or may not be powerful. Here, we apply the aSPU test [6] idea and useUto construct weights to up-weight the ef-fect of more informative signals. As both SNPs in GWAS and methylation levels in EWAS are treated as predictors in a GLM or GLMM, the extension of the aSPU test from GWAS to EWAS is straightforward with barely any changes; however, the variation of methylation levels changes a lot across the CpG sites. If we treat all CpG sites equally and put a constant weight on the CpG sites, the signal may be masked by some CpG sites with the larger variance. To put more weights on the CpG sites with the smaller variances, we propose using the inverse standard deviation SPUw [7] tests indexed by a positive integerγ:
TSPUwð Þγ ¼ and the SPUw test reduces to the usual sum of powered score (SPU) test ifωJ= 1 for allj. Various values ofγlead to different SPUw tests that are more powerful under different situations. Hence, for a given scenario with unknown association patterns, we use various SPUw tests to increase the chance of having at least one of them to be powerful. The SPUw tests cover the (weighted) Sum test and sum of squared score (SSU) test as 2 special cases with the corresponding γ= 1 and γ=2, respectively. As γ→∞, the SPUw test would converge to the minimump
value (UminP) test [6]. Even though aSPU and aSPUw are originally proposed to analyze GWAS data, as shown in the above formula, once we get the score vectors U and its covariance matrix V from the GLMM, we can apply both aSPU and aSPUw tests directly.
the value of γfor the SPUw tests adaptively. As in Pan et al. [6], an adaptive SPUw test simply combines the results of multiple SPUw tests by taking the minimump
values for some candidate values of γin Γ; for example,
Γ= {1, 2, 3,..., 6,∞}:
TaSPUwð Þγ ¼ minγ∈Γ PSPUwð Þγ:
For the choice ofΓset, we recommend including both smallγvalues such as 1, 2, and mediumγvalues such as 3,..., 6 inΓto maintain high power when the signals are either dense or relatively sparse; in addition, we also rec-ommend including ∞ in Γ to cover the case when the signals are highly sparse.
Note that TaSPUw is no longer a genuine p value,
however, we can use a single layer of Monte Carlo simulations [6] to calculate the p values for SPUw(γ) and aSPUw simultaneously. Specially, first, we simu-late B copies of the null score vectors independently,
U(b) ~ N(0,V) for b = 1,…, B, then calculate the null statistics TSPUw(γ) based on each null score vector U(b)
accordingly. Next, the p value of SPUw(γ) is PSPUwðγÞ
We analyzed the GOLDN study data provided by GAW20. The GOLDN study was designed to identify
the genetic impact on the lipid response to interven-tions [3]. Here we tested the association between the log pretreatment fasting TGs and the methylation levels of the CpG sites within each gene’s coding re-gion (without any upstream or downstream exten-sion); we used the identity function as the link function in GLMM (leading to a linear mixed model [LMM]). Furthermore, we adjusted for age, sex, and study center to eliminate potential confounding ef-fects. We included K= 2 variance components: first, instead of using the kinship matrix, we used a ran-dom set of 20,000 SNPs from the GOLDN GWAS data to estimate the GRM; second, we created a within-family correlation matrix with elements all 1 s for all the members in the same family, and 0 other-wise. We tested 15,731 genes with a conservative Bonferroni adjustment with a genome-wide signifi-cance level at 0.05/15731 ≅3 × 10⁻⁶.
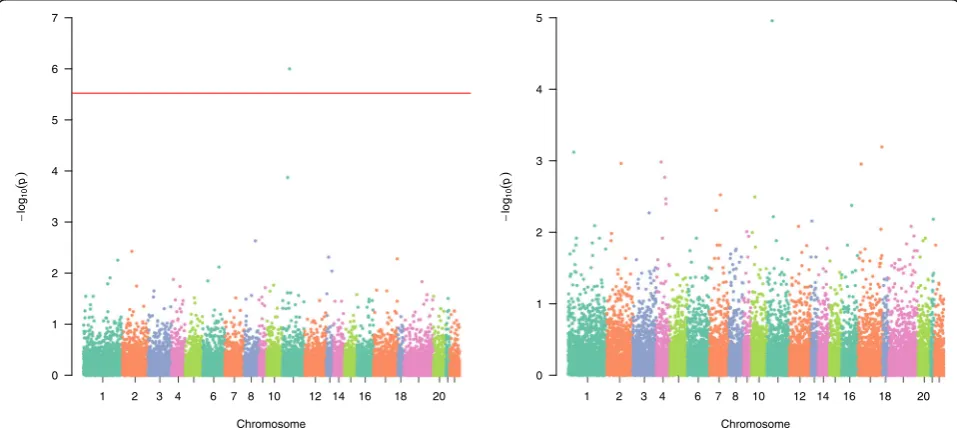
Figure1shows the Manhattan for aSPUw with inverse standard deviations weight ωj¼1=
ffiffiffiffiffiffiffiffiffiffiffiffiffiffiffiffiffiffi varðGijÞ p
, and aSPUw (ie, aSPU) with a constant weightωj= 1.
Perhaps because of treating all CpG sites equally, aSPUw (ie, aSPU) with a constant weight does not find any significant genes after the Bonferroni correc-tion. In contrast, aSPUw with inverse standard devia-tions weight identifies one significant gene, CPT1A, which is also identified by Irvin et al. [3].
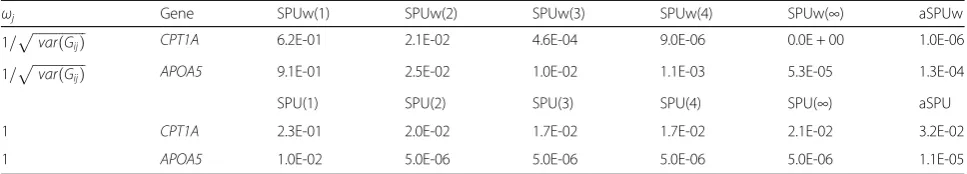
The quantile–quantile (Q-Q) plots (not shown) in-dicate that all tests yield slightly conservative results (genomic control lambda < 1). Table 1 shows the indi-vidual p values for 2 genes, CPT1A and APOA5, with
different weights. For fasting TGs,APOA5is known to be associated with several significant SNPs, such as rs964184 (p value = 7 × 10−240 [9]). Although aSPU, aSPUw, and other individual SPU or SPUw tests are unable to detect
APOA5at the genome-wide significance level, thepvalues are usually small (<0.05). Perhaps as a consequence of the highly sparse signals in APOA5, the SPUw or the SPU with a larger γ gives a more significant p value. The aSPUw test can detectCPT1Aat the genome-wide signifi-cance level, whereas the aSPU (with a constant weight) fails to do so. However, forAPOA5, aSPU with a constant weight yields a smaller pvalue than aSPUw with the in-verse of standard deviation weight. Note that the SPU(2) test is equivalent to the sequence kernel association test (SKAT) with a linear kernel [10]; SPU(2) fails to identify
CPT1AandAPOA5at the genome-wide significance level.
Discussion and conclusions
In this paper, we applied an adaptive test, aSPU [6], and its weighted version, aSPUw [7], to the GOLDN study data and found 1 significant gene,CPT1A, with its methy-lation levels associated with the log pretreatment fasting TGs. Under different scenarios with differing signal spars-ity levels, different tests may be more powerful. Using adaptive testing may achieve overall good performance as we do not know the underlying truth. To alleviate the ef-fects of varying variability of the methylation levels across the CpG sites when conducting a gene-based test, we pro-posed using the aSPUw test, putting more weights on the CpG sites with smaller variances. Compared to the un-weighted aSPU test or other SPU tests (including SKAT), the aSPUw test would be more powerful if CpG sites with smaller variances are more likely to be truly associated with the trait, but may lose power otherwise. More gener-ally, following the idea of the aSPU test in combining mul-tiple SPU tests, it is straightforward and potentially productive to combine various weighted and unweighted aSPUw and aSPU tests, which may maintain higher power across different situations.
There are several limitations in the current study. First, normalization is needed but remains challenging for methylation data. Among others, normalization helps re-duce the impact of batch effects, leading to more reliable subsequent analyses. In our current study, we used the
given methylation data without any further normalization. Second, because of the page limit, we did not conduct simulation studies to evaluate the performance of aSPU and aSPUw with methylation data, although their promis-ing performance has been shown with extensive simula-tions and real data analyses in the context of GWAS [6].
Acknowledgements
We thank the reviewers for many helpful and constructive comments and the organizers of Genetic Analysis Workshop 20 providing GAW20 data sets.
Funding
Publication of this article was supported by NIH R01 GM031575. This research was supported by (NIH) grants R01GM113250, R01HL105397, and R01HL116720 and by the Minnesota Supercomputing Institute. CW is supported by a University of Minnesota Doctoral Dissertation Fellowship.
Availability of data and materials
The data that support the findings of this study are available from the Genetic Analysis Workshop (GAW) but restrictions apply to the availability of these data, which were used under license for the current study. Qualified researchers may request these data directly from GAW.
About this supplement
This article has been published as part of BMC Proceedings Volume 12 Supplement 9, 2018: Genetic Analysis Workshop 20: envisioning the future of statistical genetics by exploring methods for epigenetic and pharmacogenomic data.
Authors’contributions
CW and WP designed the overall study. CW, JYP conducted statistical analyses. CW and WP participated in the workshop. WG provided some useful suggestions. All authors read and approved the final manuscript.
Ethics approval and consent to participate Not applicable.
Consent for publication Not applicable.
Competing interests
The authors declare that they have no competing interests.
Publisher’s Note
Springer Nature remains neutral with regard to jurisdictional claims in published maps and institutional affiliations.
Published: 17 September 2018
References
1. Baylin SB, Jones PA. A decade of exploring the cancer epigenome-biological and translational implications. Nat Rev Cancer. 2011;11(10):726–34. 2. Liu Y, Aryee MJ, Padyukov L, Fallin MD, Hesselberg E, Runarsson A, Reinius L,
Acevedo N, Taub M, Ronninger M, et al. Epigenome-wide association data implicate DNA methylation as an intermediary of genetic risk in rheumatoid arthritis. Nat Biotechnol. 2013;31(2):142–7.
Table 1Thepvalues of the SPUw and aSPUw tests with different sets of weights
ωj Gene SPUw(1) SPUw(2) SPUw(3) SPUw(4) SPUw(∞) aSPUw
1=pffiffiffiffiffiffiffiffiffiffiffiffiffiffiffiffivarðGijÞ CPT1A 6.2E-01 2.1E-02 4.6E-04 9.0E-06 0.0E + 00 1.0E-06
1=pffiffiffiffiffiffiffiffiffiffiffiffiffiffiffiffivarðGijÞ APOA5 9.1E-01 2.5E-02 1.0E-02 1.1E-03 5.3E-05 1.3E-04
SPU(1) SPU(2) SPU(3) SPU(4) SPU(∞) aSPU
1 CPT1A 2.3E-01 2.0E-02 1.7E-02 1.7E-02 2.1E-02 3.2E-02
3. Irvin MR, Zhi D, Joehanes R, Mendelson M, Aslibekyan S, Claas SA, Thibeault KS, Patel N, Day K, Jones LW, et al. Epigenome-wide association study of fasting blood lipids in the genetics of lipid-lowering drugs and diet network study. Circulation. 2014;130(7):565–72.
4. Jaffe AE, Murakami P, Lee H, Leek JT, Fallin MD, Feinberg AP, Irizarry RA. Bump hunting to identify differentially methylated regions in epigenetic epidemiology studies. Int J Epidemiol. 2012;41(1):200–9.
5. Butcher LM, Beck S. Probe lasso: a novel method to rope in differentially methylated regions with 450K DNA methylation data. Methods. 2015;72:21–8. 6. Pan W, Kim J, Zhang Y, Shen X, Wei P. A powerful and adaptive association
test for rare variants. Genetics. 2014;197(4):1081–95.
7. Zhang Y, Xu Z, Shen X, Pan W, Alzheimer’s Disease Neuroimaging Initiative. Testing for association with multiple traits in generalized estimation equations, with application to neuroimaging data. Neuroimage. 2014;96:309–25. 8. Chen H, Wang C, Conomos MP, Stilp AM, Li Z, Sofer T, Szpiro AA, Chen W,
Brehm JM, Celedón JC, et al. Control for population structure and relatedness for binary traits in genetic association studies via logistic mixed models. Am J Hum Genet. 2016;98(4):653–66.