Croatian Error-Annotated Corpus of Non-Professional Written Language
Vanja ˇStefanec
∗, Nikola Ljubeˇsi´c
†, Jelena Kuvaˇc Kraljevi´c
‡∗Center for Postgraduate Studies, University of Zagreb
Zvonimirova 8, HR-10000 Zagreb, Croatia [email protected]
†Dept. of Information and Communication Sciences, University of Zagreb
Ivana Luˇci´ca 3, HR-10000 Zagreb, Croatia [email protected]
‡Laboratory for Psycholinguistic Research, Department of Speech and Language Pathology, University of Zagreb
Zvonimirova 8, HR-10000 Zagreb, Croatia [email protected]
Abstract
In the paper authors present the Croatian corpus of non-professional written language. Consisting of two subcorpora, i.e. the clinical subcorpus, consisting of written texts produced by speakers with various types of language disorders, and the healthy speakers subcorpus, as well as by the levels of its annotation, it offers an opportunity for different lines of research. The authors present the corpus structure, describe the sampling methodology, explain the levels of annotation, and give some very basic statistics. On the basis of data from the corpus, existing language technologies for Croatian are adapted in order to be implemented in a platform facilitating text production to speakers with language disorders. In this respect, several analyses of the corpus data and a basic evaluation of the developed technologies are presented.
Keywords:error corpus, language disorders, Croatian language
1.
Introduction
In this paper we describe the Croatian corpus of non-professional written language (Kuvaˇc Kraljevi´c et al., in press) that is based on written language production of two groups of participants: healthy speakers and speakers with various types of language disorders (LDs). This resource, created in an interdisciplinary environment, offers valuable data for research in different fields of science. It provides data about language production which can be of interest to speech and language pathologists working in clinical set-tings, but also to linguists and neuroscientists studying guage processing in general. Besides that, it is a unique lan-guage resource that can be used for improving existing or building new and specialized language technologies (LTs). Roughly containing 0.5M tokens, it is, as to our best knowl-edge, the biggest corpus of this type in general.
It is needless to say that resources of this type are scarce. Moreover, this is not the case only in linguistically under-resourced languages like Croatian. Specialized corpora which contain samples of written language produced by speakers with developmental or acquired language disor-ders, i.e. error corpora, are generally rare (with the ex-ception of the learner corpora, which, we believe, capture different types of errors than those targeted here), and es-pecially those entirely composed of samples produced by the speakers with language disorders. But, nevertheless, besides for scientific research of the underlying phenom-ena, such corpora are irreplaceable for developing various language tools, such as contextually-aware spelling correc-tors. In the absence of a better resource, needed corpora are sometimes artificially created by introducing errors into correct text (Pedler, 2007, p. 43). Other commonly used resources (and often wrongly referred to as ‘corpora’) are simply lists of commonly misspelled words, extracted from every context, paired with their correctly written
equiva-lents. These are, for example, the Birkbeck Error Cor-pus (Mitton, 1985) or the Wikipedia list of common mis-spellings (Wikipedia, 2015). One of the rare examples of a resource that keeps the spelling errors in their context is more of a document collection than a corpus (Pedler, 2007). Although remarkable by its size of 12,000 tokens, it is composed of various available materials collected from various sources without a defined sampling methodology. Among the examples of full-fledged (yet very small by its size of 1k tokens) corpora, we could mention the work of Rello et al. (2012) who approached the problem of col-lecting the corpus of texts produced by adolescents with dyslexia with a solid methodology. Worth mentioning are also the attempts of automated building of error corpora by Miłkowski (2007), and those by Rodrigues and Rytting (2012), using crowdsourcing principles.
Our corpus has already served as the base for different streams of research. Kuvaˇc Kraljevi´c et al. (2016) have tackled the methodological questions concerning collecting and sampling of specialized oral and written adult speak-ers corpora. In the framework of cognitive model of writ-ing Kuvaˇc Kraljevi´c and Kolograni´c Beli´c (2015) have ana-lyzed the grammatical and orthographic features in written language production of adolescents with specific language impairment (SLI). Recent study based on this corpus was oriented towards text quality measured by various discourse elements, such as coherence and cohesion, in subjects with developmental language disorders only (Kuvaˇc Kraljevi´c et al., under revison). Our focus in this paper is put on the use of the data in developing specialized language technolo-gies, primarily predictors of following words and context-aware spelling correctors.
statis-tical significance of the measured differences. These mea-surements provide us with data crucial for developing ef-ficient or adapting existing language technologies that can be useful for both beneficiaries, healthy speakers and those with language disorders.
2.
Resource Development
The corpus was collected during the period of 8 months by the speech and language pathologists who were dealing pri-marily with language disorders in medical and educational institutions. In order to cover multiple genres of written language, various text genres were elicited. The text collec-tion procedure, as well as the eliciting material adapted for different age groups of the participants, were prescribed in advance. Accordingly, participants were asked to write sev-eral different kinds of texts (e.g. essay, narrative, dictation, official letter). Every item in the material was designed to elicit a written response of a roughly predictable length and a certain formal complexity. Except for data collected in the clinical setting from the participants with language dis-orders, which constitute our clinical subcorpus, the same group of interrogators collected roughly the same amount of data from the healthy participants in a non-clinical set-ting using the same material and methodology. The primary purpose of the collected data was to tune existing language technologies to characteristics of language disorders. The optimized language technologies (i.e. a predictor of fol-lowing words and a context-aware spelling corrector) were then to be used in a platform designed for facilitating text production to speakers with language disorders. Although the platform will, of course, facilitate text production in a digital form (i.e. text input), most of the responses collected from the participants were produced in a handwritten form and subsequently transcribed by the interrogators. Reasons for that are twofold. First, the age of participants ranged from 10 years to 80 years which leads to significant dif-ferences in their computer skills. And second, only those patients with traumatic brain injury or stroke who were in lesion phase (period from several weeks up to 5 months af-ter onset) or late phase (period afaf-ter 5 months, i.e. the rest of the patient’s life) were encouraged to participate in writ-ten texts collection, still some of them were unable to type, and for some of them this kind of participation was very demanding. There were, however, several items in the ma-terial for which interrogators could, by their own discretion, give the participant the opportunity to produce his/hers re-sponse in a digital form. Text samples produced in a digital form can be identified in the corpus as they are marked as such and can be analyzed separately.
3.
Resource Description
The corpus consists of 500 thousand tokens, out of which roughly 55% were produced by participants with language disorders. More than 36% of the tokens in this clinical sub-corpus were produced by participants with dyslexia who are, along with participants with aphasia, the target popu-lation for the platform implementing LTs enhanced on the basis of the corpus.
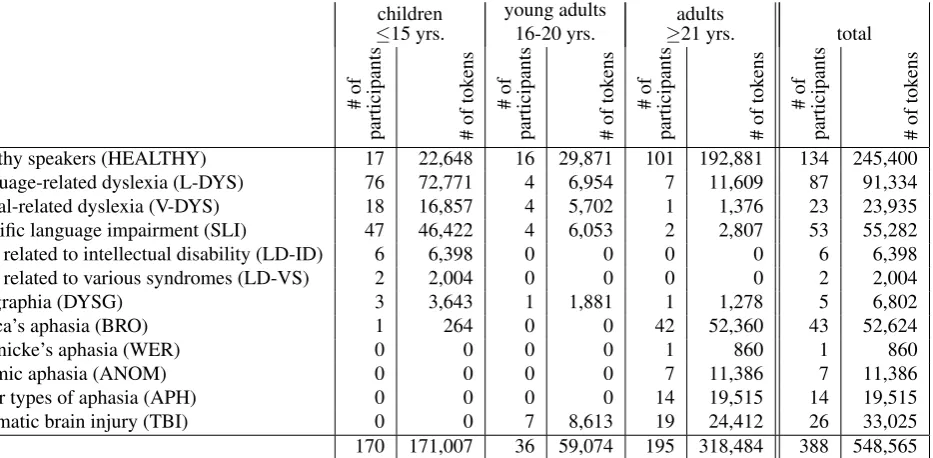
Basic statistics about the entire corpus are given in Table 1.
4.
Resource Annotation
The corpus was manually annotated by trained linguists on several linguistic levels. The first annotation layer consists of corrections of surface forms. Except for the corrections on the token level, annotators could merge multiple tokens into one and vice versa in case the participant incorrectly placed word boundaries or left out some syntactically non-optional element, e.g. a mandatory preposition. The second annotation layer contains error classifications into one or more of the 12 classes describing the scope of the errors. The scope of the errors could range from simple typos to semantic-related mistakes. Table 2 lists all the error classes used in the corpus.
The third and the fourth annotation layer consist of mor-phosyntactic annotations of both the original and the cor-rected surface forms. The reason we decided to perform this double annotation was to capture and explore possible systematic morphological and syntactical errors that could be related to some type of language disorder.
The morphosyntactic annotations used follow the revised Version 4 of the MULTEXT-East Morphosyntactic Specifi-cations for Croatian (Ljubeˇsi´c, 2013).
Annotators were instructed to intervene in the text as little as needed, and to correct only unintentional language and purely orthographic errors, while the use of non-standard language, regionalism or slang should be left as is. The purpose of such token normalization was to make the cor-pus as much as possible useful for the future development of text correction technologies. However, the decision on whether certain form should be corrected and classified as error was not always easy to make. For example, token (∗)nebicould be regarded both as a regional non-standard variant, or as an orthographically incorrect form of standard ne bi[⇒“would not”], especially if compared with the re-gional formnemremof standardne mogu[⇒“I can not”]. So, the guidelines given to the annotators were to normalize to standard only those forms which share the same phono-logical content with their standard equivalents.
Every text sample was annotated by only one annotator and no inter-annotator agreement was measured.
Table 3 gives the distribution of errors across language dis-order statuses.
5.
Statistical Analysis of the Resource
In this section we present a series of statistical analyses of the presented resource. We primarily focus on statisti-cal descriptions that can help in developing LTs, concretely predictors of following words and spelling correctors. Al-though we are not aware of any relevant research that could back up this claim, our intuition tells us that there are cer-tain non-negligible differences between different text input modalities, i.e. handwriting and typing, so we decided to analyze data that was collected through typing only. Also, since the text production-facilitating platform implement-ing these technologies will be offered to people with var-ious types of language disorders, we treat developmental1
children
healthy speakers (HEALTHY) 17 22,648 16 29,871 101 192,881 134 245,400
language-related dyslexia (L-DYS) 76 72,771 4 6,954 7 11,609 87 91,334
visual-related dyslexia (V-DYS) 18 16,857 4 5,702 1 1,376 23 23,935
specific language impairment (SLI) 47 46,422 4 6,053 2 2,807 53 55,282
LDs related to intellectual disability (LD-ID) 6 6,398 0 0 0 0 6 6,398
LDs related to various syndromes (LD-VS) 2 2,004 0 0 0 0 2 2,004
dysgraphia (DYSG) 3 3,643 1 1,881 1 1,278 5 6,802
Broca’s aphasia (BRO) 1 264 0 0 42 52,360 43 52,624
Wernicke’s aphasia (WER) 0 0 0 0 1 860 1 860
anomic aphasia (ANOM) 0 0 0 0 7 11,386 7 11,386
other types of aphasia (APH) 0 0 0 0 14 19,515 14 19,515
traumatic brain injury (TBI) 0 0 7 8,613 19 24,412 26 33,025
total 170 171,007 36 59,074 195 318,484 388 548,565
Table 1: Basic corpus statistics
error class example
typo ∗popodme→popodne orthography-related ∗osije´cam→osje´cam phonological (segment) ∗Maia→Marija
phonological (syllable) ∗poˇstoni→poˇstovani morphological ∗prijato→prijatelje wrong inflection ∗laveˇzem→laveˇzom
non-standard ∗neda→ne da neologism ∗nordini→moˇzdani inflected neologism ∗remu [∗rema-ACC.sg]→remen
redundant je je→je
syntactic razliˇcitih→razliˇcitog semantic njezina→njegova
Table 2: Error classes
and acquired disorders as a unique clinical group. The pre-sented corpus consists of 1891 such sentences produced by healthy subjects and 1034 sentences produced by subjects with language disorders.
The main questions we tackle in this section are:
1. do individuals with language disorders produce more spelling errors than healthy individuals?
2. do individuals with language disorders produce more spelling errors with a Damerau-Levenshtein distance (Damerau, 1964) higher than 2, i.e. spelling errors that would be very hard to correct with the traditional ap-proach of identifying spelling corrections?
3. do individuals with language disorders introduce spelling errors earlier in a word, making thereby word predictors less useful?
In Table 4 we present the size of the two samples together with the number of misspellings. The results answer our first research question: subjects with language disorders do make almost 5 times more spelling errors than subjects with
typical language processing. Given that our samples are not particularly big, we perform a chi-square test with the following null hypothesis: the number of correctly and in-correctly spelled tokens, and the clinical status of the sub-ject are independent. As expected, the p-value of the test is 3∗ 10−157, which enables us to safely reject our null hypothesis and conclude that individuals with various lan-guage disorders produce significantly (p < .001) more mis-takes than healthy individuals.
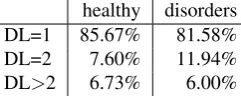
Next, we investigate the distribution of the Damerau-Levenshtein distance among subjects of our two groups. The obtained results are presented in Table 5. Here we obtain the answer to our second question: do individuals with language disorders produce more spelling errors with a Damerau-Levenshtein distance higher than 2, which would make finding spelling corrections with the traditional ap-proach almost impossible?2 From the presented numbers it seems that this is not the case as the percentage of such misspellings is even slightly higher in the group of healthy subjects. Performing the chi-square test on the null hy-pothesis that the number of spelling errors with a Damerau-Levenshtein distance up to 2 and over two, and the clinical status of a subject are independent, we receive a p-value of 0.8783, because of which we can not reject the null hypoth-esis.
On the other hand, there is a visible difference between the percentage of spelling errors of distance 1 and 2. There-fore, we perform another chi-square test with the following null hypothesis: the number of spelling errors with distance 1 and distance 2, and the clinical status of subjects are in-dependent. The test gives a p-value of0.0324which does enable us to reject the null hypothesis. Therefore we can conclude that participants with language disorders do make statistically significantly (p < .05) more spelling errors of
2
# of
annota-ted
tokens1 typo orthograph
y
phon.
(se
g.)
phon.
(syl.)
morphology inflection non-standard neologism neolog.
(infl.)
redundant syntactic semantic ∗10−3
HEALTHY 203,711 1.84 3.15 3.01 0.23 0.38 0.72 2.59 0.15 0.02 0.42 0.65 0.27
L-DYS 75,451 4.64 21.17 36.57 2.49 2.65 3.41 8.91 1.29 0.15 1.27 4.48 1.64
V-DYS 18,775 5.11 18.22 26.90 1.92 2.13 3.25 7.94 1.44 0.11 0.59 2.72 1.49
SLI 45,858 2.46 13.80 23.66 1.40 2.27 2.88 5.34 0.52 0.09 0.89 3.45 1.18
LD-ID 5,155 3.30 15.32 22.70 3.10 2.52 6.40 6.60 0.58 0 1.16 4.46 0.97
LD-VS 1,632 0.61 44.73 64.95 4.90 12.25 12.25 23.28 0.61 0 0 11.64 4.29
DYSG 4,870 3.90 14.17 130.80 9.24 4.93 4.52 10.27 5.95 0.82 0.82 6.16 2.67
BRO 39,315 4.53 13.40 30.70 4.48 5.44 5.39 6.56 2.21 0.10 2.34 10.63 3.87
WER 623 1.61 22.47 17.66 3.21 1.61 1.61 3.21 0 0 1.61 3.21 1.61
ANOM 8,312 2.41 8.90 25.14 5.17 2.77 5.29 6.98 0.96 0.12 1.68 4.09 1.56
APH 14,170 3.74 14.82 23.36 4.94 4.16 4.16 7.55 0.92 0 1.27 6.35 2.12
TBI 23,651 4.27 13.53 18.94 2.49 2.16 3.13 10.02 1.27 0.17 1.94 3.17 1.56
Table 3: Probability of errors across language disorder statuses
healthy disorders
# of tokens 30,654 12,892
# of misspellings 342 695
% of misspellings 1.12% 5.39%
Table 4: Size of the analyzed datasets and the amount of misspellings
healthy disorders
DL=1 85.67% 81.58%
DL=2 7.60% 11.94%
DL>2 6.73% 6.00%
Table 5: Distribution of the Damerau-Levenshtein distance among healthy subjects and subjects with a language disor-ders
Damerau-Levenshtein distance 2 in comparison to spelling errors of distance 1 than healthy subjects.
From these results we can draw very useful conclusions for building a spelling corrector for participants with language disorders: while the number of spelling errors produced by subjects with language disorders is almost five times higher, the differences in the distribution of Damerau-Levenshtein distances among healthy subjects and those with language disorders up to distance of 2 and above 2 are not statisti-cally significant. In both cases there is∼6-7% of spelling errors that have a Damerau-Levenshtein distance to the cor-rect form higher than 2, making the traditional approach of searching for spelling corrections not useful. One has, of course, bear in mind that among subjects with language disorders, these errors will still occur five times more fre-quently than among healthy participants, making their texts after spelling correction still less accurate. On the other hand, there is statistically significant difference in the num-ber of spelling errors of distance 1 and of distance 2 be-tween the two groups. However, both types of errors can be dealt with by using traditional spelling correction ap-proaches.
character position healthy disorders
1 10.82% 13.24%
2 14.33% 14.39%
3 17.84% 16.55%
4 16.67% 17.84%
Table 6: Distribution of the position of the first misspelled character in misspelled words
We perform another set of analyses that are directed at the problem of predicting the following word while typing. First we present the distribution of the position of the first misspelled character in a word among healthy subjects and subjects with language disorders. The results on the first four characters, as later misspellings are not crucial for the technology in question, are given in Table 6. The two dis-tributions seem quite similar, with the misspelling on the first character, which is the most dangerous one for word predictors, being∼2%more probable among participants with language disorders.
Given that there is an observable difference in the percent-age of misspellings occurring on the first position in the two groups, we ran another chi-square test with the follow-ing null hypothesis: the number of misspellfollow-ings on the first position in a word and later positions, and the language dis-order status of a person are independent. The test gives a p-value of 0.3127, not allowing us to reject the null hypoth-esis.
After the second set of analyses we can conclude that word predictors should be, at least regarding the position of the first spelling error inside a word, as useful for individuals with language disorders as they are for healthy participants.
6.
Evaluation of Language Technologies
2 4 6 8 10
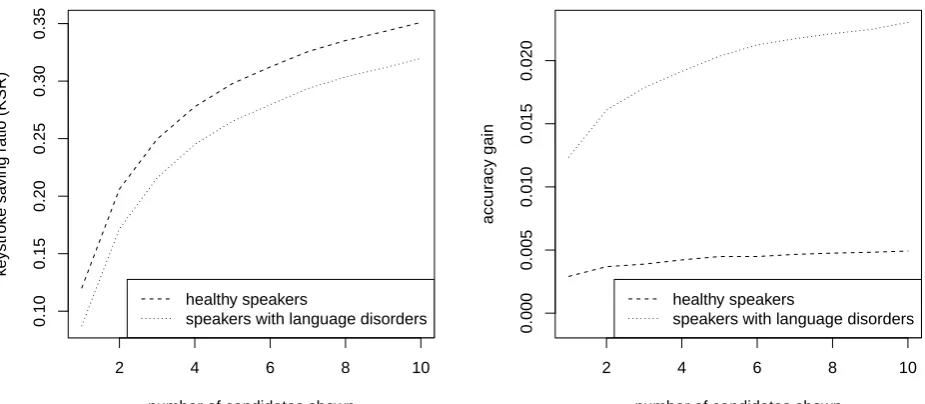
Figure 1: Evaluation results of the predictor of following words
6.1.
Predictor of the Following Word
Our predictor of the following word is based on a character-level language model, built from a large web corpus (Ljubeˇsi´c and Klubiˇcka, 2014), encoded in a trie. Encod-ing the language model on the character level enables us to query it during the process of entering the current word. Encoding the language model in a trie assures a small mem-ory footprint.
We calculate two evaluation metrics on the next word pre-diction task. The first metric is KSR – keystroke saving ratio, i.e. the ratio of keystrokes that did not have to be performed thanks to the prediction technology. The second metric is accuracy gain – the difference in word accuracy when the technology is used and when it is not. Namely, while using predictors of following words, errors can be omitted by selecting the intended word from the list of can-didates before making a misspelling.
During this evaluation we take into account two variables. The first variable is the maximum number of candidates the next word prediction technology offers to the user. As the number of candidates increases, both evaluation met-rics should increase as well. However, one should expect a negative impact of too many candidates being shown to the user, especially among participants with language dis-orders for whom reading is an issue. We expect for the positive impact of showing more candidates to fall off at some point.
The second variable we take into account is the clinical sta-tus of the subjects on whose text production we evaluate the technology. We differentiate between two levels: subjects with language disorders and healthy subjects.
The results are shown in Figure 1. Regarding the keystroke saving ratio, we can observe that it is to expect that healthy participants do make greater keystroke savings than partic-ipants with language disorders. Given that there is no sig-nificant difference in the number of misspellings on the first
characters among these two groups, we assume that the ob-served difference is due to the fact that not all errors are corrected by using this technology, and having five times more spelling errors in the context on which we predict the following words surely has an impact. Furthermore, we can hypothesize that the text being produced by partici-pants with language disorders has less of a natural flow and therefore the predictors of the following words, which use the already entered words for prediction, do not perform as good.
Regarding the optimal number of candidates to be shown to users, it should be set at around four candidates as at that point the ratio of keystroke savings does start to fall off. However, for optimizing this variable a set of experiments on live subjects should be performed.
Concerning the accuracy gain obtained through the use of this technology, among healthy subjects the absolute rise in accuracy as the number of candidates increases is much smaller than in speakers with language disorders. There is an accuracy gain of 0.3% if just one candidate is shown and 0.5% if ten candidates are shown. The error rate among those subjects is in general quite low, about 1%, so by us-ing a predictor of the followus-ing word, the error reduction among healthy speakers on the word level is between 30% and 50%.
On the other hand, among subjects with language disorders, increasing the number of candidates shown does increase the accuracy gain quite visibly. While the accuracy gain is 1.2% with one candidate shown, by showing 10 candidates, it reaches 2.3%. Therefore overall error reduction among speakers with language disorders when using a predictor of the following word, in optimal conditions, is between 25% and 45%, just slightly lower than among healthy speakers.
2 4 6 8 10
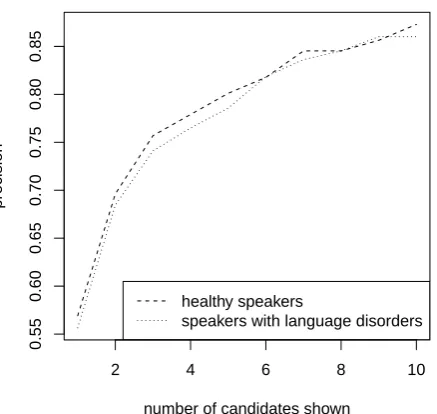
Figure 2: Evaluation results of the spelling corrector
6.2.
Spelling Corrector
Our spelling corrector is based on an inflectional lex-icon (Ljubeˇsi´c et al., 2016), calculating the Damerau-Levenshtein distance of a potentially misspelled word to other words in the lexicon, and ranking the words satisfying the similarity criterion by using a language model trained on a very large web corpus (Ljubeˇsi´c and Klubiˇcka, 2014).
We evaluate our spelling corrector by calculating the preci-sion of the candidates shown on misspelled words. Preci-sion is calculated on the level of a set of candidates where each set containing the right word is considered correct and the set not containing the correct word as incorrect.
We take into account the same two variables as in the evalu-ation of the predictor of the following word: the number of candidates shown to the user, and the two levels of language disorders status.
The results of this experiment are shown in Figure 2. Again, we can observe that the gain obtained by showing more can-didates to the users starts to drop off at three cancan-didates. At that point the precision of the candidate sets is around 75%, meaning that every fourth word does not have the correct form shown among the candidates.
Interestingly, in this experiment there is no difference to be observed among our two groups of subjects. The difference between the two groups observed in keystroke saving ratio and the lack of difference in the case of the precision in spelling suggestions can be explained by the fact that typ-ing errors are five times more frequent among subjects with language disorders. These errors impact the predictor of following words negatively if they occur before the correct word is being suggested, but they do not impact the spelling corrector as the Damerau-Levenshtein distance distribution between the two groups is identical.
7.
Conclusion
The corpus presented in this paper is a result of an 8 months long work of an interdisciplinary team consisting of speech and language pathologists, linguists, NLP scientists and in-formation experts, and is, as such, a unique language re-source, annotated on multiple levels, offering opportunities for different lines of research. However, its primary pur-pose was to provide data necessary for building a platform which would help speakers with various types of language disorders in producing written text and thus overcome one of the main obstacles in fulfilling their personal potentials in education and in the job market.
The analyses we presented here gave us important guide-lines in designing such a platform. We have shown that, although making significantly more errors than healthy sub-jects, speakers with language disorders do neither make proportionally more errors of Damerau-Levenshtein dis-tance higher than 2 nor make more errors on initial charac-ters in the word, which confirms that traditional approaches of spelling correction and next word prediction will be ap-plicable. Further on, we have searched for optimal num-ber of candidates that are to be shown to the user using several evaluation metrics, keystroke saving ratio and accu-racy gain for the next word predictor, and precision for the spelling corrector. In case of both presented technologies, the optimal number of candidates turns out to be 3 to 4. However, these numbers should be confirmed experimen-tally on live subjects.
Sad statistics reveal that not only the incidence of aphasia due to tumors or stroke gradually increases in the popula-tion, but the average age of people affected by this neuro-genic disorder actually decreases. In this light, we find the presented results very promising and hope that the platform we are creating will help with the (re)integration of the pop-ulation with language disorders into the society.
8.
Acknowledgments
The research leading to these results has received funding from the European Regional Developmental Fund 2007-2013 under grant agreement No. RC.2.2.08-0050 (project RAPUT).
9.
Bibliographical References
Damerau, F. J. (1964). A technique for computer detec-tion and correcdetec-tion of spelling errors. Commun. ACM, 7(3):171–176.
Kuvaˇc Kraljevi´c, J. and Kolograni´c Beli´c, L. (2015). Grammatical and orthographic features in written lan-guage production of youth with specific lanlan-guage impair-ment. Poster presented at IV clinical linguistics interna-tional congress, Barcelona.
Kuvaˇc Kraljevi´c, J., Hrˇzica, G., and Kolograni´c Beli´c, L. (in press). Croatian Corpus of Non-professional Writ-ten Language. University of Zagreb, Laboratory for Psy-cholinguistic Research, Zagreb.
Kuvaˇc Kraljevi´c, J., Mati´c, A., Kolograni´c Beli´c, L., and Oluji´c, M. (under revison). Written narratives of adoles-cents with specific language impairment: discourse anal-ysis.Journal of Communication Disorders.
Ljubeˇsi´c, N. and Klubiˇcka, F. (2014). {bs,hr,sr}WaC – web corpora of Bosnian, Croatian and Serbian. In Pro-ceedings of the 9th Web as Corpus Workshop (WaC-9), pages 29–35, Gothenburg, Sweden. Association for Computational Linguistics.
Ljubeˇsi´c, N., Klubiˇcka, F., Agi´c, ˇZ., and Jazbec, I.-P. (2016). New inflectional lexicons and training cor-pora for improved morphosyntactic annotation of Croa-tian and Serbian. InProceedings of the Tenth Interna-tional Conference on Language Resources and Evalua-tion (LREC’16). European Language Resources Associ-ation (ELRA).
Miłkowski, M. (2007). Automated building of error cor-pora of polish. In Barbara Lewandowska-Tomaszczyk, editor,Corpus Linguistics, Computer Tools, and Appli-cations – State of the Art, volume 17 ofŁ´od´z Studies in Language, pages 631–639. Peter Lang.
Pedler, J. (2007). Computer Correction of Real-word Spelling Errors in Dyslexic Text. PhD thesis, London University.
Rello, L., Baeza-Yates, R., Saggion, H., and Pedler, J. (2012). A first approach to the creation of a spanish cor-pus of dyslexic texts. In Nicoletta Calzolari, et al., edi-tors,LREC Workshop Natural Language Processing for Improving Textual Accessibility, pages 22–27. European Language Resources Association (ELRA).
Rodrigues, P. and Rytting, C. A. (2012). Typing race games as a method to create spelling error corpora. In Nicoletta Calzolari, et al., editors,LREC Workshop Natu-ral Language Processing for Improving Textual Accessi-bility, pages 3019–3024. European Language Resources Association (ELRA).
10.
Language Resource References
Ljubeˇsi´c, Nikola. (2013). MULTEXT-East Croatian Mor-phosyntactic Specifications, revised Version 4. 4.0-revised.
Mitton, Roger. (1985). Birkbeck spelling error corpus. University of Oxford Text Archive.