Analysis
of
Epstein
Distribution
Effect
on
Magnetized
Plasma
Reflection
using
TLM
Method
YasserEkdiha,Mohamed Kanja, KhalidMounirhandMohsineKhalladi
TelecommunicationandInformationSystemsLaboratory(LaSIT),Dep.ofphysics, FacultyofSciences,AbdelmaledEssaadiUniversity,P.O212193000,Tetouan,MOROCCO.
Abstract
Inplasmaphysics,thereflectioncoefficientisaveryimportantparameterthatdescribeshowmuchofanelectromagnetic waveisreflectedb ya ni mpedanced iscontinuityi nt het ransmissionm edium.I nt hisp aper,an ewa nalysiso fEpstein distributioneffecton anisotropicmagnetized collision plasmareflectioni sp resented.T her eflectionco efficientof an electromagneticwavethroughamagnetizedplasmaslabiscomputedusingthePLCDRC-TLMmethod. AstheEpstein distributionformulaisafunctionofthegradscoefficientσandtheplasmat hicknessz0,theeffectofthistwoparameters
on the reflectionc oefficientis an alyzed.Th ere sultssh owth atth eop timalre flectioncoe fficientcanbeo bta inedby changingthevaluesofσ and z0.
Keywords plasma, electromagnetic waves, TransmissionLine Matrix(TLM)method, PLCDRC-TLM method, Epstein distribution.
1. Introduction
TheanalysisoftheelectromagneticwavesreflectiononaplasmaoftheEpsteinprofileoftheelectrondensityn(z)hasbeen extensivelystudiedbymanyworkers[1,2].BecausealayerofplasmawiththeEpsteinprofilehasnodiscontinuitiesinthe electrondensitygradient,itcanbesuccessfullyusedforthestudyofverythinlayersandmayalsobeusedinmicrowave diagnosticsofthelaboratoryplasma[3]. Astheanalyticalsolutionsofmagnetizedplasmaproblemsaregenerallyvery complicatedtosolve,thenumericalmethodsareanalternativetoolformicrowaveanalysisandmodeling. Amongthese methods,thetransmissionlinematrix(TLM)methodwithsymmetricalcondensednode(SCN)[4,5]remainsarobustand efficientnumericaltooltomodelelectromagneticwavesproblemsinthetimed omain.Itisbasedonthediscretemodel ofHuygensprinciple. TherehavebeennumerousstudiesonTLManisotropicmediumformulationsoverthelastyears [6,7], oneof thisformulationsisthePLCDRC-TLMmethod[8]. Inthispaper, thePLCDRC-TLMmethodisusedto analyzetheeffectofEpsteindistributiononthemagnetizedplasmareflection.Thiskindofanalysiswasthesubjectof [9]. Thefigurespresentedbelowshowtherelationshipbetweendifferentvaluesof(σ,z0)andthereflectioncoefficient.
Thereasonsfortherelationshipsarediscussed.
2. Formulations
and
Equations
ThePLCDRC-TLMisusedtoanalyzetheeffectof theplasmaparametersonreflectionc oefficient,wh enth eelectron densitydistributesasEpsteinformula.Theimplementationofthemethodalgorithmisbasedontherecursivecalculation ofthecurrentdensityJ.
Foranisotropicmagnetizedcollisionplasma,andbyassumingthattheexternalstaticmagneticfieldincartesian coordi-nateisparalleltothez-axis,theMaxwellsequationsandconstitutiverelationcanbewrittenas:
∇×H=ε0
∂E
∂t +J (1)
∇×E=−µ0
∂H
∂t (2)
dJx
dt +υcJx=ε0ω
2
dJy
dt +υcJy=ε0ω
2
pEy−ωcJx (4)
dJz
dt +υcJz=ε0ω
2
pEz (5)
Where Jx,Jyand Jzare the current density components,ε0and µ0are respectively the permittivity and permeability of
free space, υcis the electron collision frequency, ωp=
p
(n(z)e2)/(mε
0)is the plasma frequency, ωc= (e/m)B0is the
cyclotron frequency, e is the electric charge, m is the mass of an electron and B0is the external static magnetic field.
After calculations, as explained in [8], with the use of analogies between the electromagnetic field and circuit param-eters, the update equations are obtained as follow:
Vun+1=Vun+∆t.∆l
ε0
(∇×H)n+
1 2
u −
∆t.∆l
2ε0
(Jnu+1+Jnu) (6)
Jun+1= 1
α∆l[β∆lJ
n
u+γVun+1+ξ0Vun+λ δ(γVun+1+ξ0Vun+ζ∆lJun)] (7)
The validity and the accuracy of the PLCDRC-TLM method have been verified through a comparaison between the obtained numerical solutions and the analytical ones in [8].
3. Effect of Epstein distribution on plasma reflection
In many previous articles [8,10] - while analyzing the reflection coefficient of electromagnetic waves on a magnetized plasma - the electron density is supposed constant all along the slab. Whereas in reality it is not the case, the profile of electron density is not always a constant profile.
In this work, the profile of the electron density is taken as an Epstein profile [11]:
n(z) = n0
1+exp(−z−0.5z0
σ )
(8)
Where: n0=3.11×10¹⁹m3is the peak value of the electron density at z= +∞, z0 is the plasma thickness, and σ
represents the grads coefficient. The forluma presented above is a function of two parameters f(σ,z0) and both of them
affect the reflection. So in the next sections, the effect of the Epstein parameters on the reflection coeficient is analyzed, once by taking a constant value of z0and three different values of σ, and once by taking a constant value of σ and
different values of z0.
3.1 Effect of gradient coefficient on the electron density
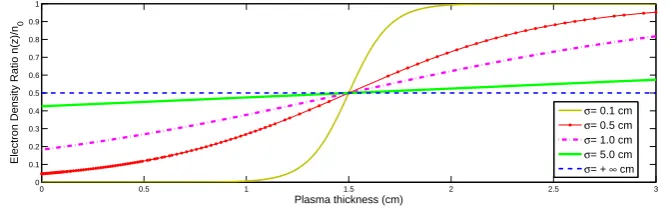
The electron density is the measure of the probability of an electron being present at a specific location. In order to discuss the effect of different values of σ on the electron density, the electron density ratio n(z)/n0is calculated with σ of 0.1
cm, 0.5 cm, 1.0 cm, 5.0 cm and infinity.
Fig. 1 shows the effects of different grads coeffcients on reffection coeffcient as follows:
(i) For all values of σthe density ratio n(z)/n0is limited between 0 and 1.
(ii) With gradient coefficient of infinity, the ratio is constant and presented as a horizontal straight line n(z)/n0=1/2,
which means that the electrons are distributed homogeneously and have the same probability of being present all along the plasma slab.
(iii) With the decrease of σ from 5.0 cm to 0.5 cm going through 1.0 cm, the ratio distributes like an inclined straight line. With the increase of thickness, the electron density increases.
(iv) With σ of 0.1 cm, the density ratio distributes as S-shape. From the slab thicknesses of 0 to 1.0 cm, the density ratio is around zero. From the slab thicknesses of 1.0 cm to 2.0 cm, the density ratio changes sharply from minimum (n(z)/n0=0) to maximum (n(z)/n0=1). And from the slab thicknesses of 2.0 cm to 3.0 cm, the density ratio
0 0.5 1 1.5 2 2.5 3 0
0.1 0.2 0.3 0.4 0.5 0.6 0.7 0.8 0.9 1
Plasma thickness (cm)
Electron Density Ratio n(z)/n
0
σ= 0.1 cm
σ= 0.5 cm
σ= 1.0 cm
σ= 5.0 cm
σ= + ∞ cm
Fig. 1 Electron density ratios versus plasma thicknesses with different gradient coefficients.
3.2 Effect of grads coefficient on the reflection coefficient
To analyze the effect of gradient coefficient on the plasma reflection, the reflection coefficient is calculated for different values of σwith a plasma thicknesses of 1.5 cm in z-direction. The computational domain is subdivided into 800 cells.
Cells from 301 to 500 are occupied by magnetized plasma, and the rest is occupied by the free space. The simulations are allowed to run 20000 time steps.
The incident wave used is a Gaussian pulsed plane wave of expression:
Ei(t) =exp(−
(t×∆t−10×T0)2
τ2 ) (9)
Where: ∆t=2∆Cl, T0=21F0 , τ=4×T0and F0=100×109Hz.
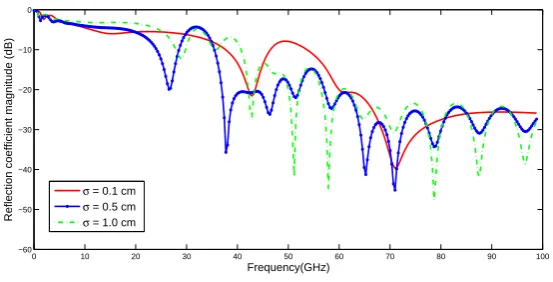
The reflection coefficients are calculated withυc=20×109rad/sand ωc=8.8×10⁹rad/s, and in order not to have a
charged figure, the curves are splitted in two figures.
Figure 2 shows the effects of grads coeffcients 0.1 cm, 0.5 cm and 5.0 cm, and the results can be interpreted as fol-lows:
(i) With σ of 0.1 cm, the curve swings smoothly within the incidence frequency range of 0 ∼22 GHz and tends
towards a constant value with the incidence frequency of above 70 GHz. The reflection coefficient has a minimum value around 72 GHz.
(ii) For the gradient coeffcient σof 0.5 cm, the curve swings sharply with the incidence frequencies under 72 Ghz, and
with the increase of the incidence frequency the curve start swinging smothly.
(iii) The case of σ=1.0 cm is discussed in the next figure.
Figure 3 shows the effects of grads coeffcients 1.0 cm, 5.0 cm and +∞cm, and the results can be interpreted as fol-lows:
(i) There is no effect within the incidence frequency range of 0∼22 GHz.
(ii) Above the incidence frequency of 22 GHz, the different values of σ affect the reflection coefficient sharply. With
σ=1.0 cm, the curve swing sharply and has a minimum value around 67 GHz.
(iii) With σ>1.0 cm, there is no effect of σon the reflection coefficient, the both curves have the same form with a
small upward shift.
As a conclusion, it is remarkable that with the increase ofσ, the reflection coefficient increase too. So it demonstrates
0 10 20 30 40 50 60 70 80 90 100 −60
−50 −40 −30 −20 −10 0
Frequency(GHz)
Reflection coefficient magnitude (dB)
σ = 0.1 cm
σ = 0.5 cm
σ = 1.0 cm
Fig. 2 Reflection coefficient with σ of 0.1 cm, 0.5 cm and 1.0 cm versus frequency.
0 10 20 30 40 50 60 70 80 90 100
−60 −50 −40 −30 −20 −10 0
Frequency(GHz)
Reflection coefficient magnitude (dB)
σ = 1.0 cm
σ = 5.0 cm
σ = + ∞ cm
Fig. 3 Reflection coefficient with σof 1.0 cm, 5.0 cm and +∞cm versus frequency.
3.3 Effect of plasma thickness on the reflection coefficient
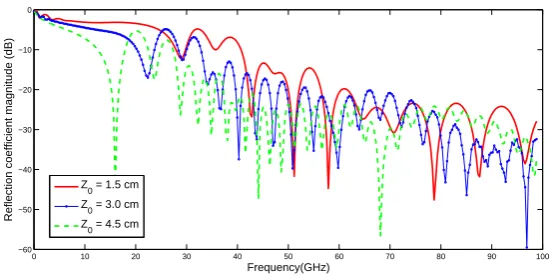
As concluded in the previous subsection, σ=1.0 cm is the optimal gradient coefficient. In order to analyze the effect of
plasma thickness on the reflection, the reflection coefficient is calculated for the case of σ=1.0 cm with three different
values of z0: 1.5 cm, 3.0 cm and 4.5 cm. So the effect of z0on the plasma reflectance is compared. The results are
discussed under the same calculating conditions ofυcand ωc.
Figure 4 with σ =1.0 cm shows the effects of different plasma thickness of 1.5 cm, 3.0 cm and 4.5 cm on reflection coefficient as follows:
(i) There is no effect of plasma thickness on the reflection coefficient within the incidence frequency range of 0∼9 GHz. The three reflection curves have no changes.
(ii) Within the incidence frequency range of 9∼64 GHz ∩81∼100 GHz, the different values of z0affect the reflection
coefficient sharply. Generally, with the increase of the thickness, the reflection coefficient decreases.
(iii) With z0of 1.5 cm, 3.0 cm and 4.5 cm, the minimum reflection values are around: 78 GHz, 68 Ghz and 96 GHz
correspondingly.
0 10 20 30 40 50 60 70 80 90 100 −60
−50 −40 −30 −20 −10 0
Frequency(GHz)
Reflection coefficient magnitude (dB)
Z0 = 1.5 cm Z
0 = 3.0 cm Z
0 = 4.5 cm
Fig. 4 Reflection coefficient with z0of 1.5 cm, 3.0 cm and 4.5 cm versus frequency.
4. Conclusion
In this paper, an analysis of Epstein distribution effect on plasma reflection using a TLM method is presented. The reflec-tion coefficient of an electromagnetic wave through a magnetized plasma slab is computed with the PLCDRC method. As the Epstein distribution formula is a function of the grads coefficientσand the plasma thickness z0, the effect of this two
parameters is also studied.
References
[1] Y. Ekdiha, K. Mounirh, M. Khalladi and S. El Adraoui, ”New TLM Formulation for Modeling Epstein Plasma”, Progress In Electromagnetics Research Letters, Vol. 83, 2019, pp. 59-64.
[2] J. Yang, Y. Zhon, Y. Zan and R. Chen, ”SO-FDTD Analysis of the Plasma Reflectance of Epstein Distribution”, Plasma Science and Technology, Vol. 8, No. 6, 2013.
[3] J. Musil, ”The reflection of electromagnetic waves on a plasma layer with the epstein profile of electron density”, Czechoslovak Journal of Physics B, Vol. 19, No. 10, 1987, pp. 1309-1311.
[4] P. B. Johns, ”A symmetrical condensed node for the TLM method microwave theory and techniques”, IEEE Trans. Microwave Theory Tech, 1987.
[5] J. R. Hoefer, ”The transmission line matrix method, theory and applications”, IEEE Trans. Microwave Theory Tech, Vol. 33, No. 10, 1985, pp. 882-893.
[6] E. S. Adraoui, K. mounirh, A. Zugari, M. Iben Yaich and M. Khalladi, ”Novel CDRC-TLM Algorithm for the Analysis of Magnetized Plasma”, Optik - International Journal for Light and Electron Optics, Vol. 125, No. 1, 2014, pp. 276-279.
[7] E. S. Adraoui, A. Zugari, M. Bassouh, MI. Yaich and M. Khalladi, ”Novel PLRC-TLM Algorithm Implementation for Modeling Electromagnetic Wave Propagation in Gyromagnetic Media”, I. J. Adv. Sci. Technol., Vol. 6, No. 1, 2013, pp. 26-32.
[8] K. Mounirh, S. El Adraoui, M. Charif, M. Khalladi and M. Iben Yaich, ”Modeling of anisotropic magnetized plasma media using PLCDRC-TLM method”, Optik - International Journal for Light and Electron Optics, Vol. 126, No. 1, 2015, pp. 1479-1482.
[9] W. Y. Hong, ”A FDTD analysis on magnetized plasma of Epstein distribution and reflection calculation”, Computer Physics Communications, Vol. 180, No. 1, 2009, pp. 55-60.
[10] E. S. Adraoui, ”RKETD-TLM modeling of Anisotropic Magnetized Plasma”, International Journal of Science and Advanced Technology, Vol. 2, No. 8, 2012, pp. 2221-8386.